- Cisco Community
- Technology and Support
- Online Tools and Resources
- Cisco CLI Analyzer
- Cisco CLI Analyzer Knowledge Base
- Using the TAC Data Collection Tool
- Subscribe to RSS Feed
- Mark as New
- Mark as Read
- Bookmark
- Subscribe
- Printer Friendly Page
- Report Inappropriate Content
- Subscribe to RSS Feed
- Mark as New
- Mark as Read
- Bookmark
- Subscribe
- Printer Friendly Page
- Report Inappropriate Content
01-31-2017 03:49 PM - edited 12-14-2018 06:27 AM
The Cisco CLI Analyzer is a standalone SSH client infused with Cisco TAC Intellectual Capital, and is available for Windows and Mac OS X platforms.
The TAC Data Collection tool is part of the CLI Analyzer and allows automatic collection of diagnostic commands requested by your TAC engineer. This is supported on ASA, IOS, IOS-XE, IOS-XR, NX-OS, WLC, and UCS platforms.
If you already have the CLI Analyzer installed, you may go directly to this video for a demo of the TAC Data Collection tool.
Objective
Collecting show commands from a device and sending the output to a TAC engineer appears to be a simple task, but often it is not. Errors created by copy-pasting commands to the device, terminal length cutting off outputs, email attachments too large, emails sent to one engineer while the TAC case is re-queued to another engineer in addition to the time it takes to complete this task and for TAC to follow up to correct any issues with collection errors. It should be faster and simpler. Now it is...
The TAC Data Collection Tool was created to make this process more reliable and easier.
This document will guide you through your first data collection.
Email From TAC Engineer
The TAC Data Collection process is initiated by a TAC engineer when diagnostic commands are needed from one or more of your devices.
The TAC engineer creates a data collection request identified by a TaskID which points a list of commands to collect and upload to your TAC case. A TaskID looks like "#TAC-D0A6-2561" (with the # sign and without the quotes). The TaskID needs to be entered in the CLI Analyzer to tell the tool which commands to collect and which case they should be uploaded to.
Note: Ensure you only run the TAC Data Collection tool on the device(s) your TAC engineer has requested.
This TaskID is shared by the TAC engineer in an email to the case contact similar to the one below:
| Subject: | Data collection task #TAC-D0A6-2561 for TAC case 681631261 |
|---|---|
| Date: | Wed, 18 Jan 2017 14:58:25 GMT |
| From: | xxxx@cisco.com |
| To: | yyyy@cisco.com |
| CC: | xxxx@cisco.com, attach@cisco.com |
Dear Customer,
In order to move things forward in SR 681631261, I need your assistance to collect a few CLI outputs from the device you opened the SR on.
This will help assess the technical direction to take.
You have a couple of options to provide the CLI outputs.
Option 1: Use Cisco CLI Analyzer to collect required CLI commands automatically.
- Step 1. Download CLI Analyzer for your platform (Win/Mac): https://cway.cisco.com/go/sa/
Note: If you already have CLI Analyzer 3.2 or greater installed proceed to Step 2. - Step 2. Use the CLI Analyzer to connect to the device.
- Step 3. Click on the Tools button (top right corner) and run the "TAC Data Collection" tool.
- Step 4. Select TaskID #TAC-D0A6-2561 from the dropdown or paste it.
Option 2: If you prefer to collect data manually, please collect the following outputs:
admin show platform
show install active summary
show run
show log
For option 2, you can use https://cway.cisco.com/csc/index.html?requestID=681631261 for diagnostic data upload.
Thank you.
As explained in the email, using the CLI Analyzer to collect the commands is optional and customers may still collect commands with their favorite telnet/SSH client and send them to the TAC engineer by email or through the Case File Uploader.
This document will guide you through the steps to collect the commands with the TAC Data Collection tool.
Step 1. Install CLI Analyzer
If you're already running CLI Analyzer 3.2 or above, you can skip this step.
The CLI Analyzer can be downloaded from:
You should be able to follow the install procedure on Mac or Windows relatively easily by selecting the defaults.
First Run - Master Password
The CLI Analyzer can remember the device credentials. A master password is used to protect these credentials on your computer:
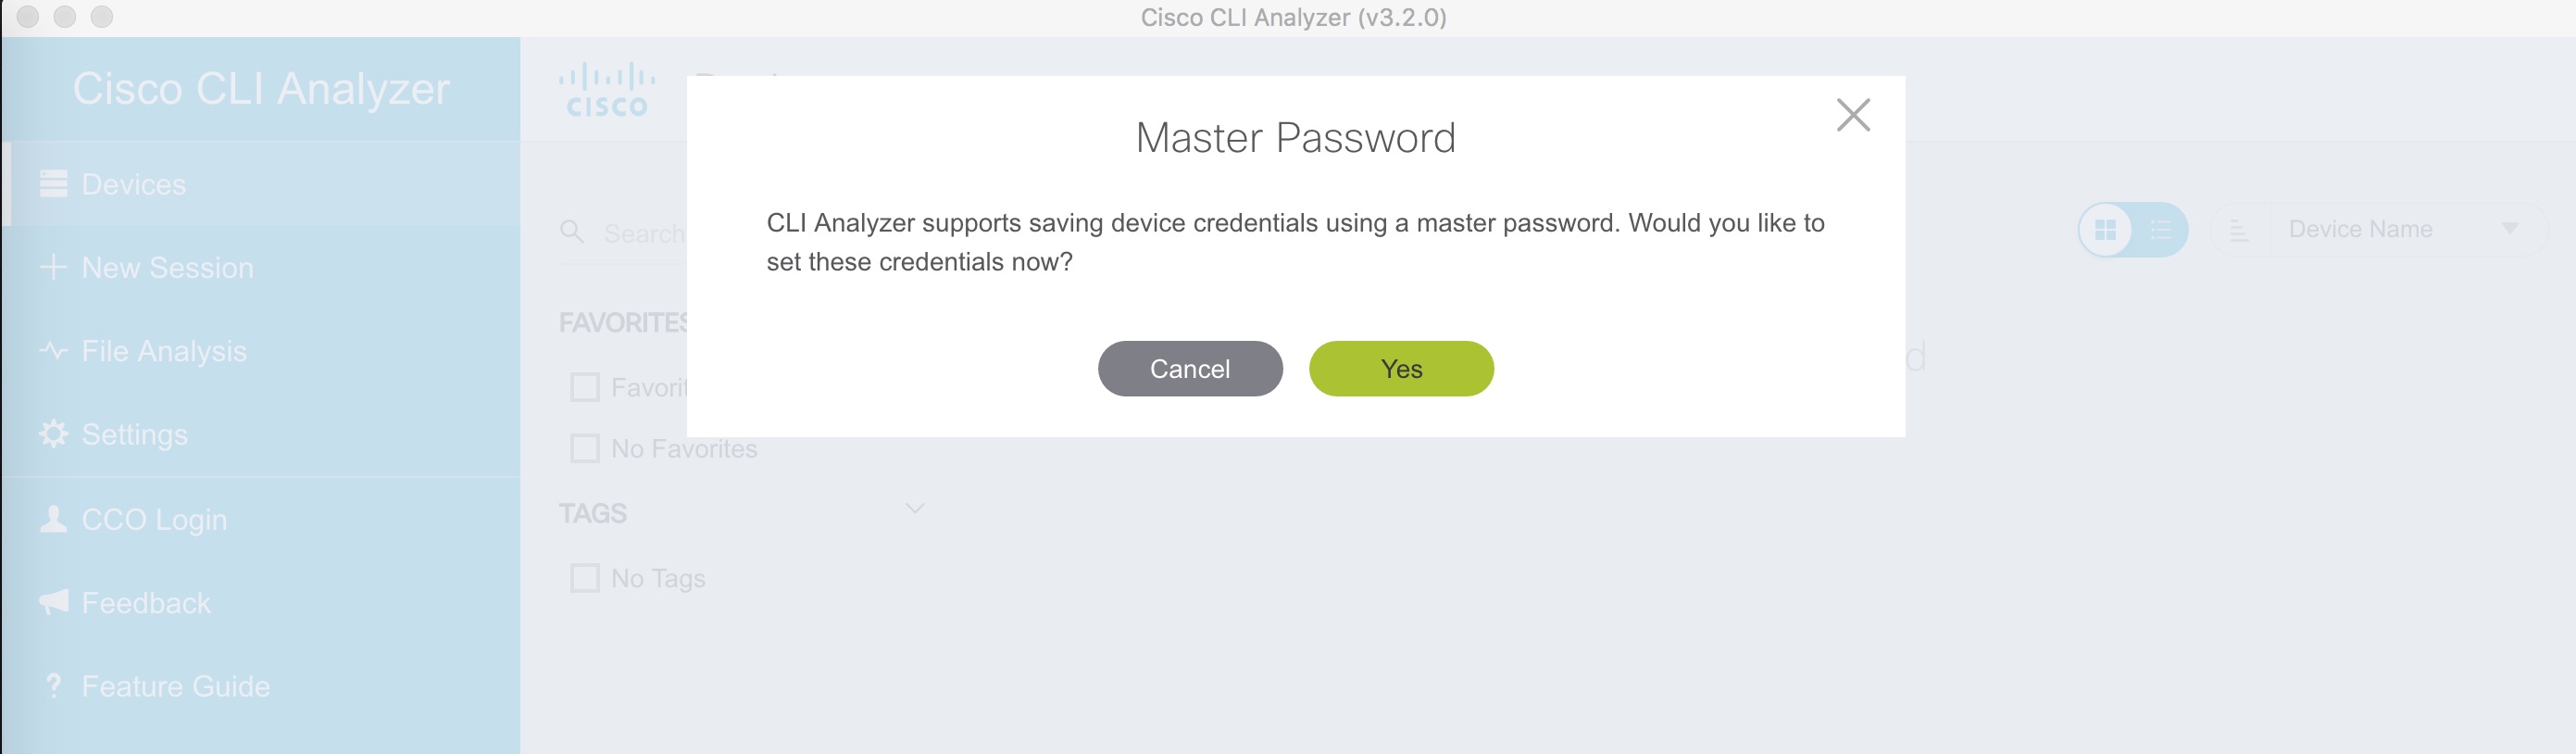
This master password will be requested each time you open the CLI Analyzer again in the future to be able to unlock the device credentials.
Main Window
After entering the master password, the main window appears:
The "Devices" tab is selected and this is where you will find all your saved devices. Once you have a few devices created, you can search by name, location, version, labels etc to limit the number of devices being displayed.
Step 2. Connect to the Device
Creating Devices
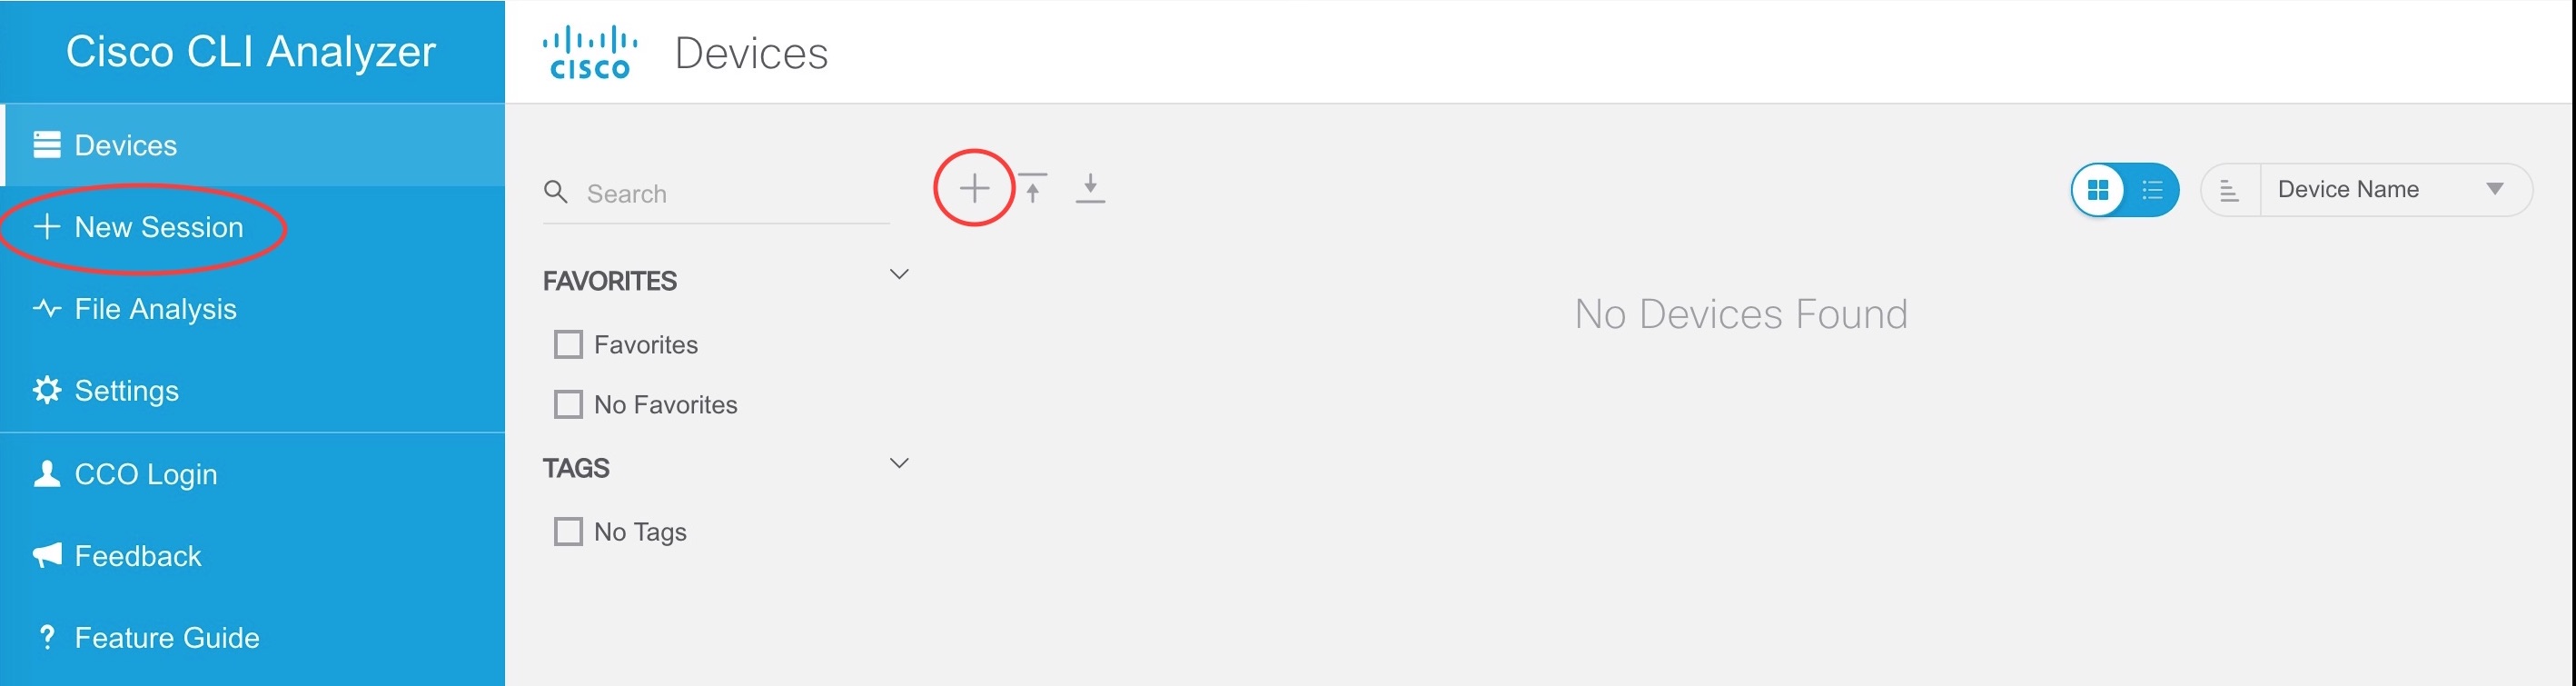
There are 3 ways to create new devices and connect to them:
- Click "New Session" in the left toolbar and enter the destination IP address or hostname, the type (SSH, telnet, serial port or shared/screen sharing) and the port number. This will connect you directly to the device but this will also created a bookmark for this device under the "Devices" tab.
- When the "Devices" tab is selected, click the "+" sign (with a red circle in the screenshot above) to first create a bookmark for the device.
When creating or editing a device, you can set some fields like a location or label(s) which can help limit the number of devices when searching for them. Here is how the "Devices" tab looks like after creating 3 new devices but filtering on "Euro-TAC" to only display devices whose location has been set to Euro-TAC:

Now you can connect to the device by clicking on "New Session" in the left bar or click on the connect button below the device (red circle in screenshot above).
Detecting Device Type
When the CLI Analyzer logs into a device for the first time, it runs a few commands automatically to detect the device type:
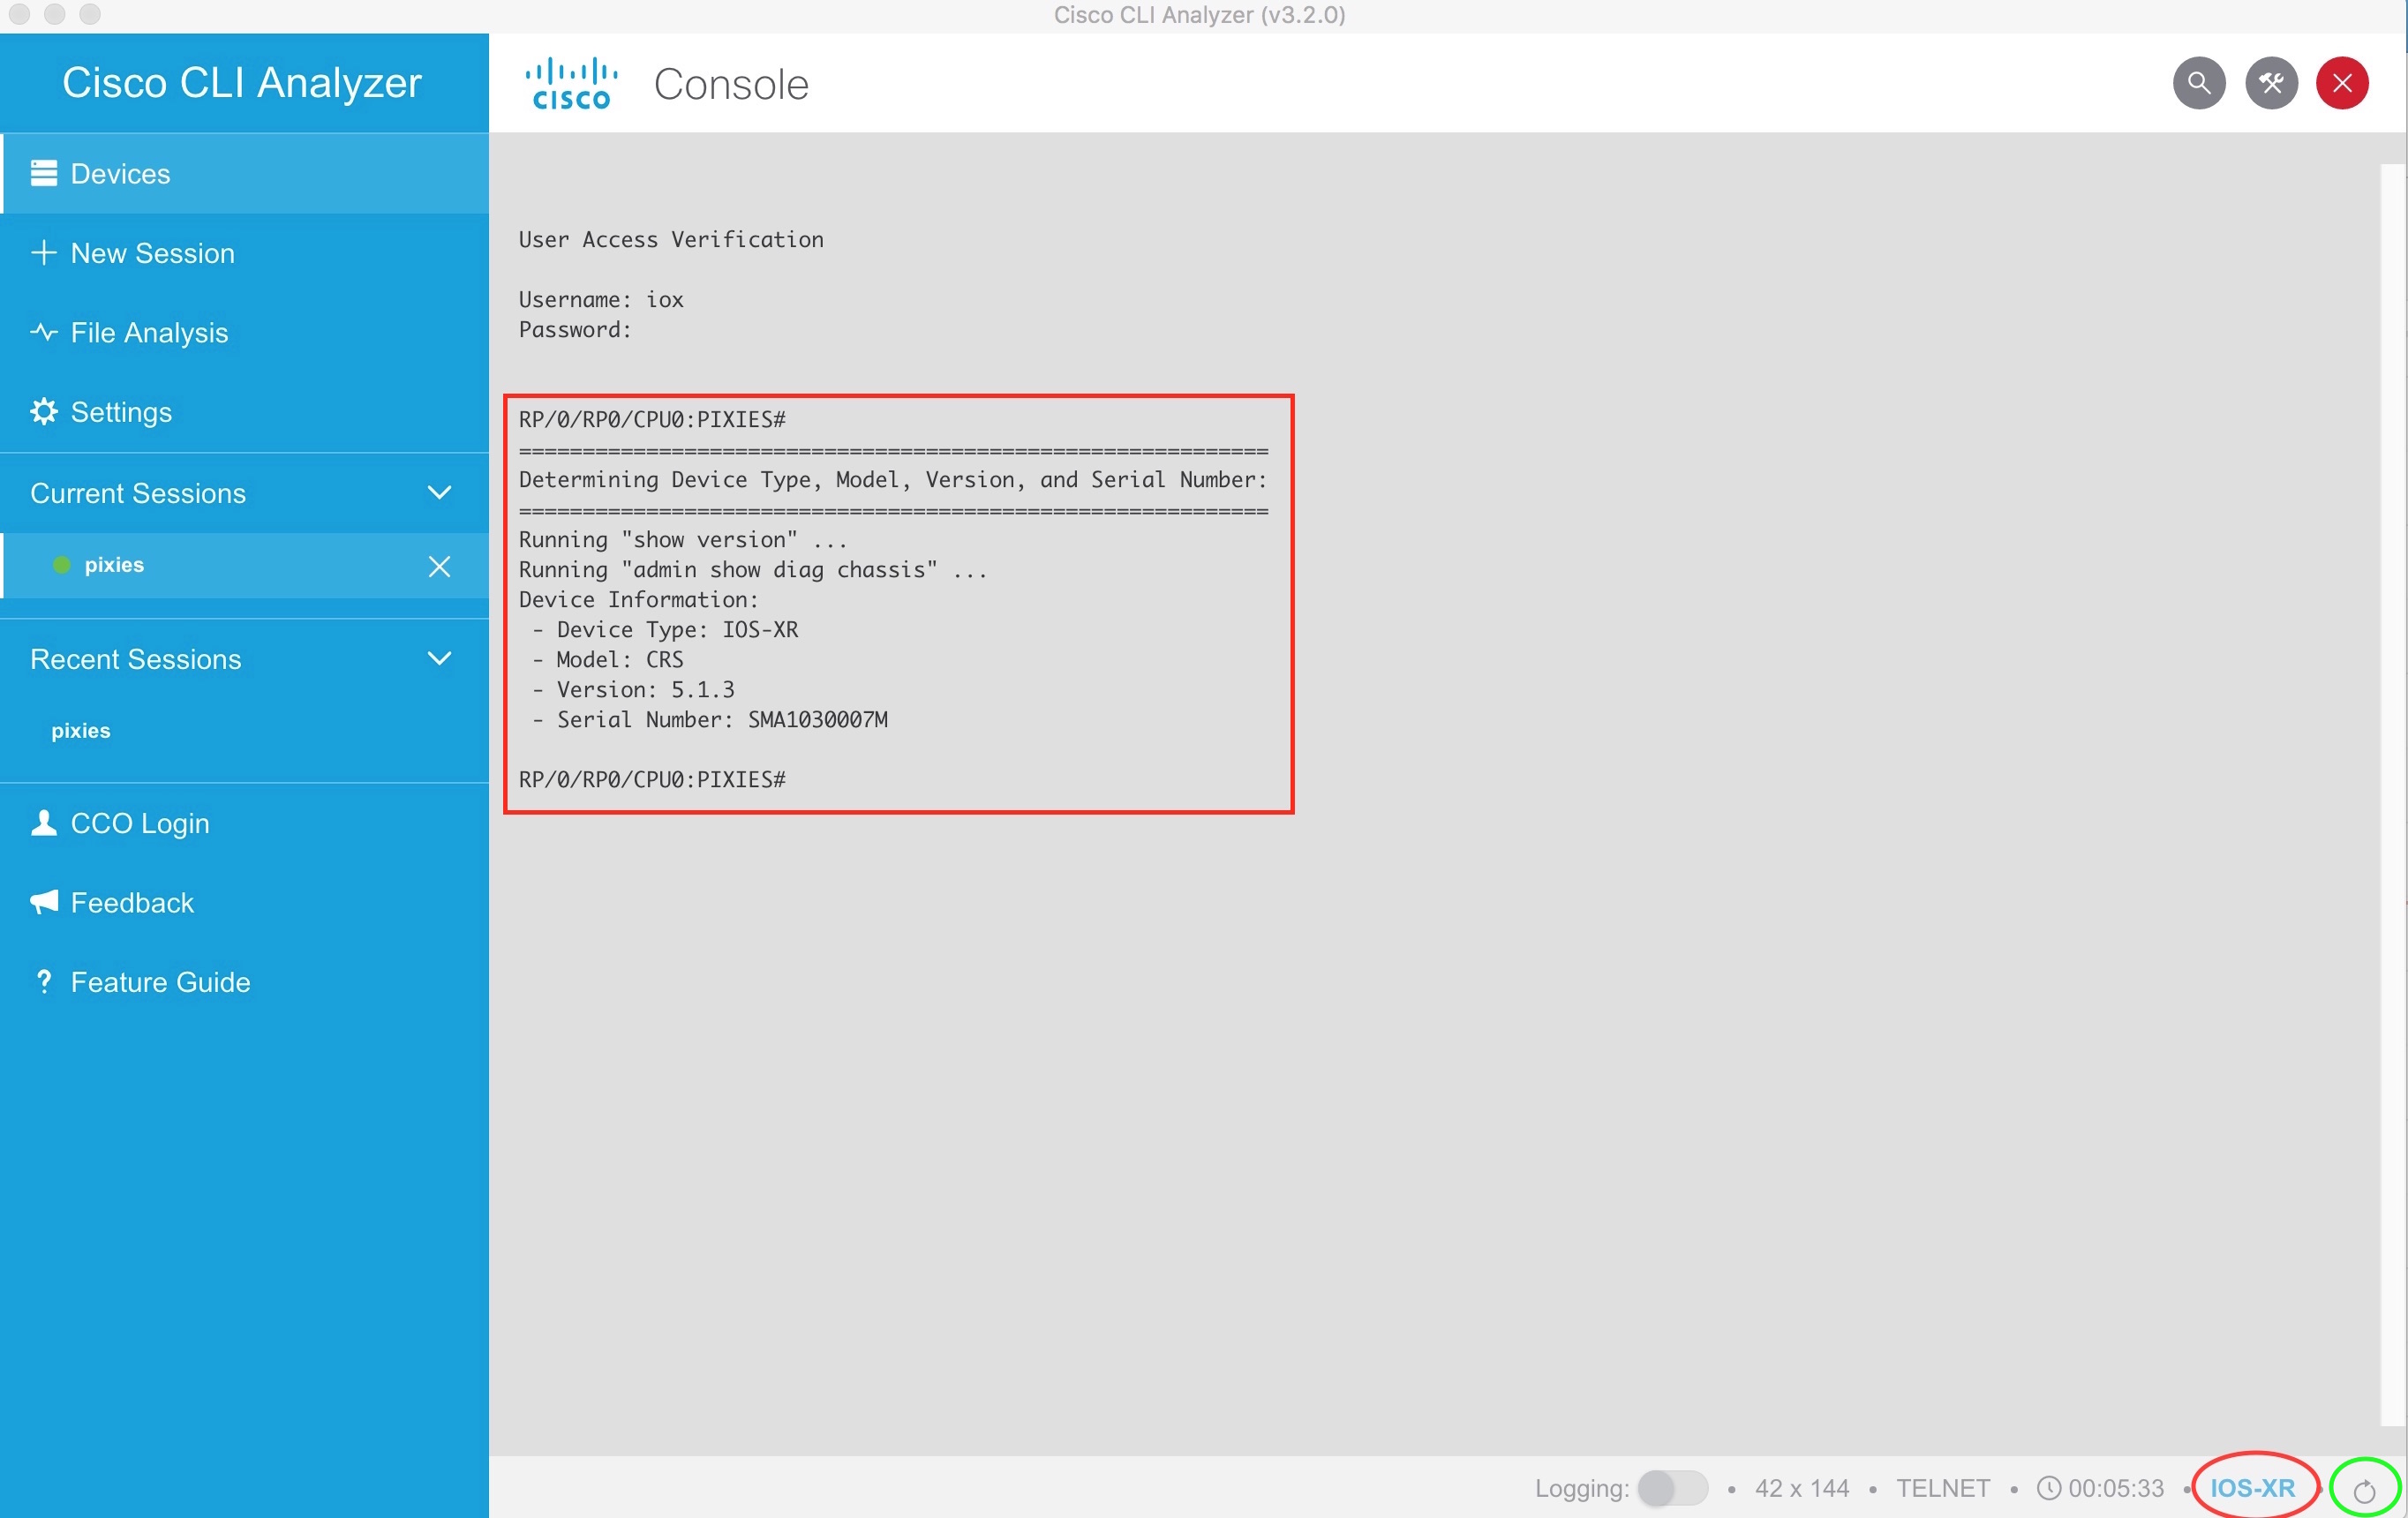
You can see in the screen shot above that the commands "show version" and "admin show diag chassis" were executed. Some commands on some platforms may take a few seconds to complete so let it run until the "Device Information" is displayed.
In the example above, the CLI Analyzer detected that this is an IOS-XR device as indicated at the bottom right of the screen (red circle).
Notes:
- If you reach the final device through some intermediate hops (jump server or other routers or switches), it's possible that the CLI Analyzer won't detect the correct device type. Always check the device type at the bottom right of the window. If it does not appear to be set correctly, click on the "Refresh Device Information" button at the bottom right of the window (green circle in the previous screenshot above).
- When connecting frequently to devices, this device detection process may not be desired. By default, the CLI Analyzer will cache this info for up to 30 days (detection frequency is configurable in the settings). This means that if you upgrade the software version on a device, it will still appear with the previous software version in the "Devices" tab for up to 30 days. You may want to click on the "Refresh Device Information" button at the bottom right of the window (green circle in the previous screenshot above) after an upgrade.
Step 3. Run the TAC Data Collection Tool
Once connected to the correct device, click on the "Tools" button in the top right corner:
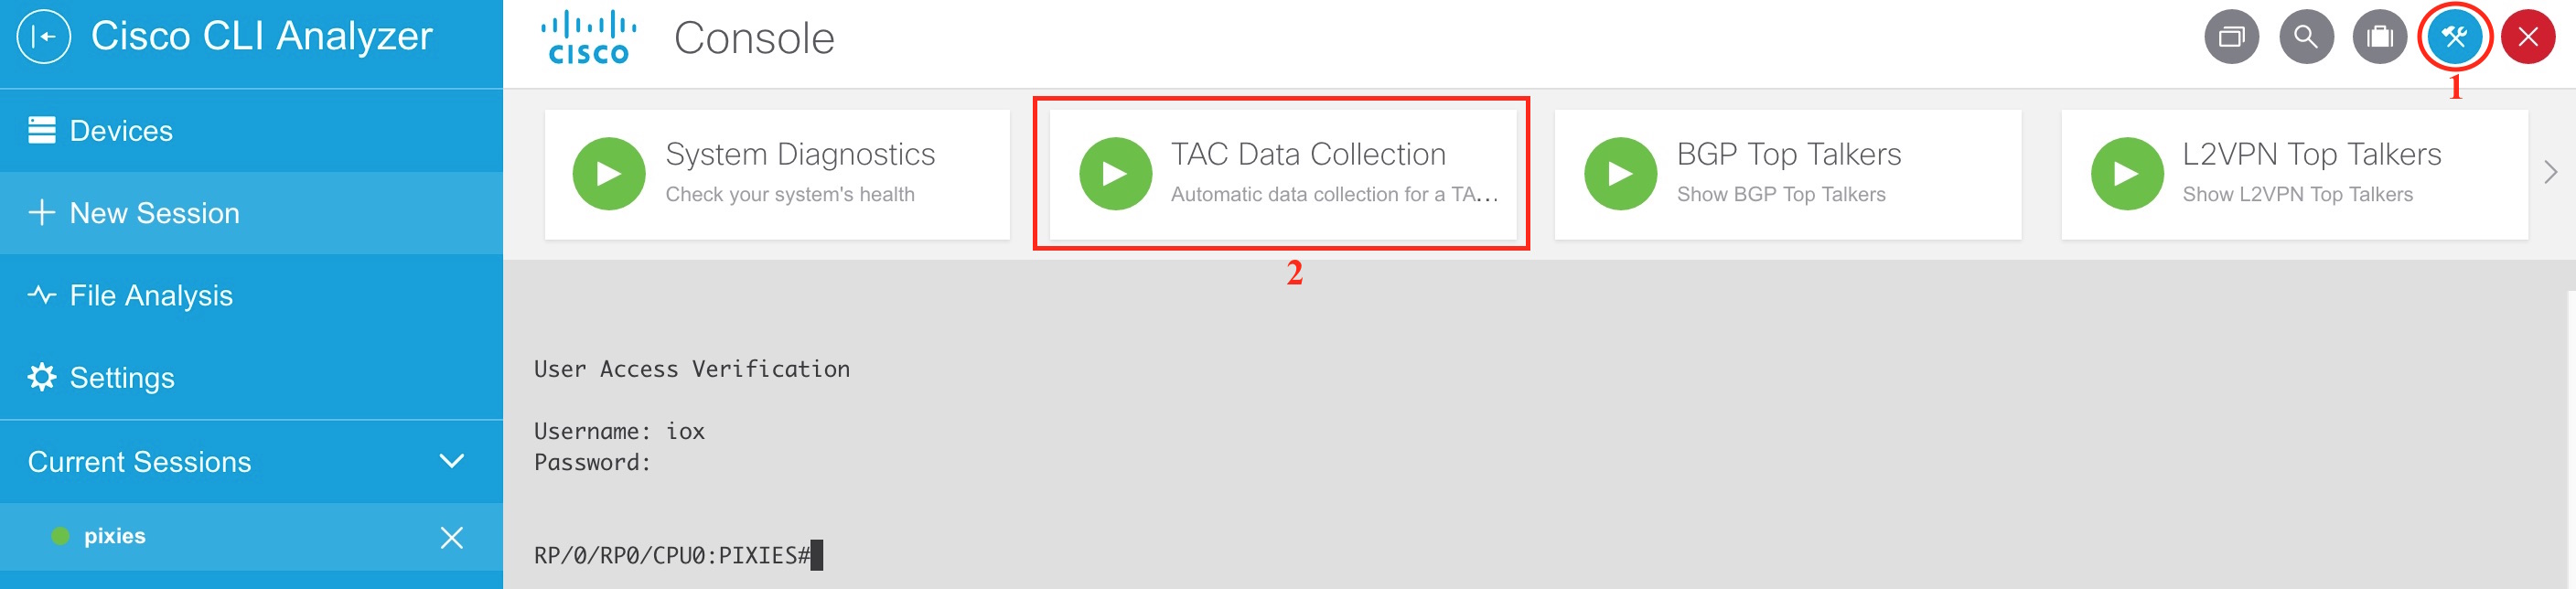
Click on the "TAC Data Collection" and a first form will appear:

The goal of this first form is to enter a TaskID. This is the TaskID you should have received from the TAC engineer via email.
- If your CCO ID is the case contact, then the TaskID should appear in the "Select recent TaskID" dropdown and you just need to select the correct one in the dropdown (you may have multiple TaskID's for the same case or from different cases). Note: Be sure the "CCO Login field in CLI Analyzer reflects the same CCO ID associated with the TAC case in question. Otherwise, use the process that follows below.
- If the email from the TAC engineer was forwarded to you by a colleague who is the case contact, then your username will not be associated with the service request and the CLI Analyzer will NOT be able to display the TaskID in the dropdown. Therefore, you will have to copy-paste the TaskID from the email to the "Enter TaskID manually" text box.
Note: If there's a TaskID selected in the dropdown and also one entered manually, then the one entered manually takes precedence.
Click "Continue" and the CLI Analyzer will retrieve the list of commands associated with this TaskID, display the list and ask you whether you want to proceed and collect the commands:

The "term len 0" is inserted as the first command and the original terminal length is reset at the end. So the 2 interesting commands are the ones in the middle in the example above. Press "Continue" if you agree to collect these 2 commands and send their outputs to the TAC case.
Commands are collected:
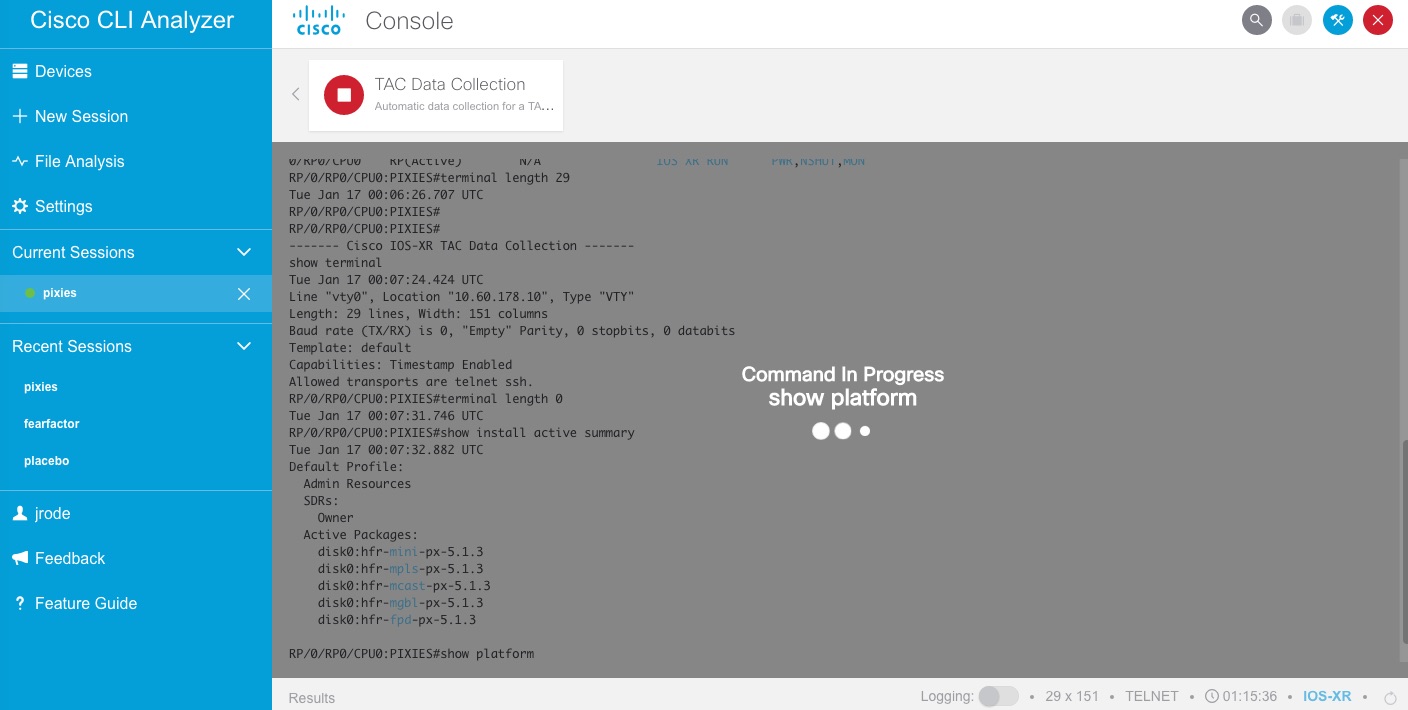
Once all commands are collected, the outputs are posted through the Cisco APIs, attached to the TAC service request and a result window appears:
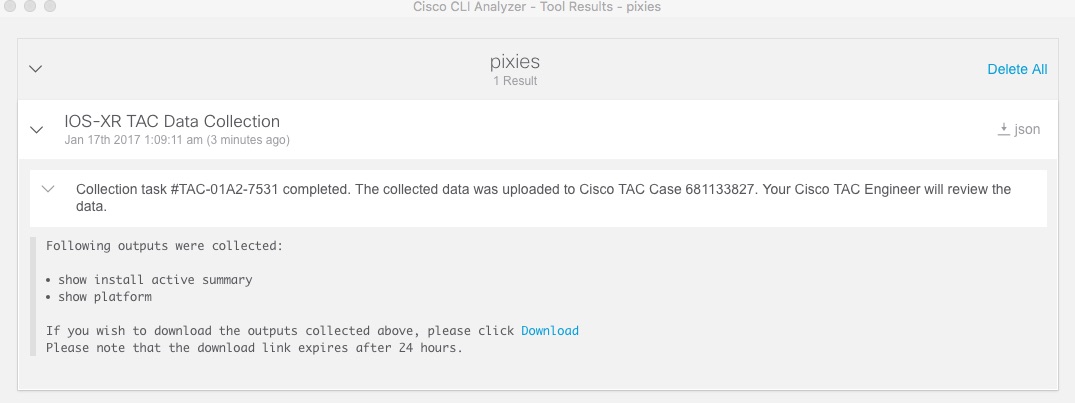
Your Cisco TAC engineer is notified of the collection so the next step is to review the outputs and get back to you with the analysis and action plan.
Please review this video for a demo of the TAC Data Collection process.
Other CLI Analyzer Features
Apart from the TAC Data Collection tool, here are some other CLI Analyzer features that you may find useful:
- Contextual Help & Highlighting (CHH)
- Tools (System Diagnostics, Packet Capture, Top Talkers, IP Route Analysis...)
- Analyzing files offline
- Create and Update TAC Cases
- Shared device sessions
- Jump servers
- Mark as Read
- Mark as New
- Bookmark
- Permalink
- Report Inappropriate Content
- Mark as Read
- Mark as New
- Bookmark
- Permalink
- Report Inappropriate Content
My file crashinfo
please help me. my device asa 5525-x is auto reboot about two weeks
Please help me
Find answers to your questions by entering keywords or phrases in the Search bar above. New here? Use these resources to familiarize yourself with the community: