- Cisco Community
- Technology and Support
- DevNet Hub
- DevNet Collaboration
- Contact Center
- Re: Charts - Formatting as HH:MM:SS
- Subscribe to RSS Feed
- Mark Topic as New
- Mark Topic as Read
- Float this Topic for Current User
- Bookmark
- Subscribe
- Mute
- Printer Friendly Page
Charts - Formatting as HH:MM:SS
- Mark as New
- Bookmark
- Subscribe
- Mute
- Subscribe to RSS Feed
- Permalink
- Report Inappropriate Content
05-12-2014 10:32 AM
When using charts, I'd like to display metrics such as ASA, AHT, etc as HH:MM:SS rather than as seconds. In the report definition, I am able to define the format as "Minutes and Seconds" but it seems like this only applies to Grid View. In the chart, the field will always display as seconds along the vertical axis, which isn't the most useful to supervisors. Is this a limitation of CUIC or is there a workaround that anyone knows about?
Thanks in advance.
- Labels:
-
Reporting
- Mark as New
- Bookmark
- Subscribe
- Mute
- Subscribe to RSS Feed
- Permalink
- Report Inappropriate Content
05-12-2014 11:13 AM
Try casting the metrics as DateTime values, then you can set "Data Units" and "Data Interval" on the Axis Settings page of the chart settings.
You can use something like this in your Report Definition's SQL statement:
DATEADD(second, (Your ASA Calulation), 0) AS ASADateTime
Just make sure the axis is not set to "Display Local Time" in the chart settings, as any time zone adjustments on this value would make no sense.
- Mark as New
- Bookmark
- Subscribe
- Mute
- Subscribe to RSS Feed
- Permalink
- Report Inappropriate Content
05-12-2014 02:56 PM
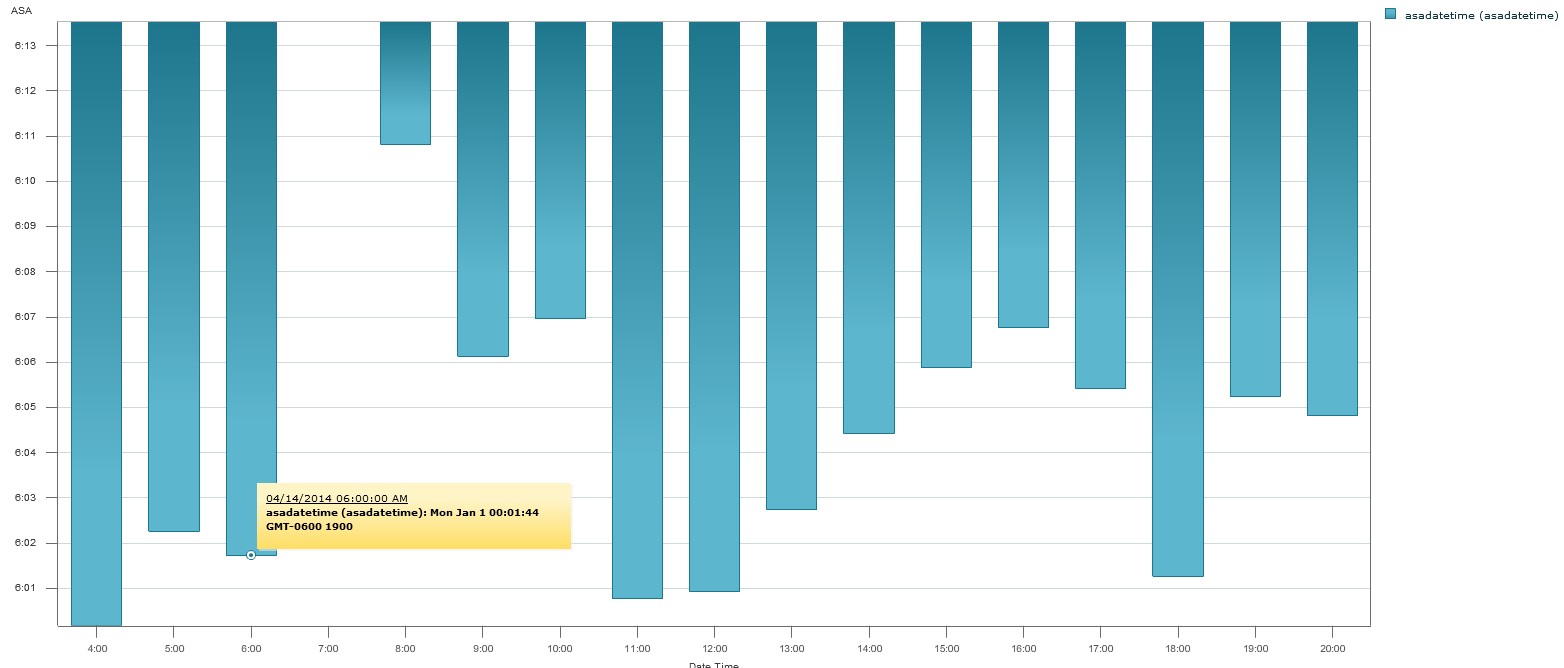
Hi Jameson, good to see you here! I did just that, and while the ASA in the time interval looks correct, the axis is completely strange and actually looks like it has flipped the bar graph upside down! heh. I set the horizontal axis to hours (which is how this custom report comes through), and the vertical ASA axis using seconds. I have no idea how it is coming up with that vertical interval or why its flipped. Getting closer at least.
- Mark as New
- Bookmark
- Subscribe
- Mute
- Subscribe to RSS Feed
- Permalink
- Report Inappropriate Content
05-13-2014 05:47 AM
Well, first off I can tell that you left "Display in Local Time" checked for the vertical axis... Turn that off. I would also change the vertical units to Seconds (it looks like it's actually showing hours) with an interval of 30 or 15. Based on the yellow box the result for the third column should be 1:44, not 6:01:44 as is displayed.
The columns coming from the top instead of the bottom probably has something to do with the Display in Local Time checkbox as well.
- Mark as New
- Bookmark
- Subscribe
- Mute
- Subscribe to RSS Feed
- Permalink
- Report Inappropriate Content
05-13-2014 10:54 AM
Another thought that may improve the output on the chart... Use "minute" instead of "second" in the DATEADD function. The chart wants to output hh:mm, so it would make sense to format the mm:ss ASA data so it looks more like hh:mm.
Find answers to your questions by entering keywords or phrases in the Search bar above. New here? Use these resources to familiarize yourself with the community: