- Cisco Community
- Technology and Support
- Security
- Network Security
- ASDM Traffic Logs
- Subscribe to RSS Feed
- Mark Topic as New
- Mark Topic as Read
- Float this Topic for Current User
- Bookmark
- Subscribe
- Mute
- Printer Friendly Page
ASDM Traffic Logs
- Mark as New
- Bookmark
- Subscribe
- Mute
- Subscribe to RSS Feed
- Permalink
- Report Inappropriate Content
01-11-2015 11:50 PM - edited 03-11-2019 10:19 PM
I'm fairly new to ASDM so I apologize for this noob question. I need to see what is actually passing through a specific source IP and destination IP, my goal is to identify which specific ports I'm missing on an IP ruleset. My logging is setup to "Debugging" but I can't seem to see what ports are being dropped/allowed whenever I check the Log Buffer & Real-Time Log Viewer.Do I need to setup some sort of packet trace? Need help on setting up filters please.
- Labels:
-
NGFW Firewalls

")
- Mark as New
- Bookmark
- Subscribe
- Mute
- Subscribe to RSS Feed
- Permalink
- Report Inappropriate Content
01-12-2015 12:27 AM
Hi,
I don't deal with ASDM that much but I do use it mainly for the same thing as you are trying to use it for which is to monitor live some connections/connection attempts.
I am not sure what the problem in this situation is. Can you confirm that you can atleast some logs on the ASDM when no filter is applied? Can you see any logs on the "Home" pages "Device Dashboard" ?
When you are looking at the logs through the actual "Monitoring" section and open the separate logging window you should see a button called "Build Filter" which provides you with different parameters with which you can filter the logs shown in the window.
If the traffic is blocked by the interface ACL you can probably even search for the logs with the Sylog ID 106023
You can naturally start by using destination/source IP address and see if you can get anything to show up. It might even be possible that the traffic is not even reaching this firewall?
- Jouni
- Mark as New
- Bookmark
- Subscribe
- Mute
- Subscribe to RSS Feed
- Permalink
- Report Inappropriate Content
01-12-2015 01:36 AM
Alright,here is the scenario. I have a request coming from a user to grant access to a cctv system. I created an ip ruleset for this but unfortunately, the access is still not working. What I'm trying to look up, is what specific ports am I missing which causes the problem. I have allowed 'IP' on the ruleset, and traffic went through which means I'm missing some specific ports. I can see logs on the dashboard & monitoring section, but I can't seem to see what ports are being dropped and from what source & to what destination.
- Mark as New
- Bookmark
- Subscribe
- Mute
- Subscribe to RSS Feed
- Permalink
- Report Inappropriate Content
01-12-2015 03:49 AM
Hi,
If you are seeing the logs in the monitoring windows then you should be looking for log messages that (by default) are colored yellow. They should also mention at the end the name of the ACL that blocks the traffic. The log message in itself should show the source/destination IP addresses and ports of this blocked connection attempt.
You should be able to build a Filter using the IP addresses alone to catch that traffic. Perhaps use the source IP address first and narrow it down if needed.
- Jouni
- Mark as New
- Bookmark
- Subscribe
- Mute
- Subscribe to RSS Feed
- Permalink
- Report Inappropriate Content
01-12-2015 11:03 PM
- Mark as New
- Bookmark
- Subscribe
- Mute
- Subscribe to RSS Feed
- Permalink
- Report Inappropriate Content
01-12-2015 11:24 PM
Hi,
You could go to the CLI (command line) or use the CLI tool on the ASDM (top menu) to insert the command
show run logging
With this we should see if you have disabled any log message IDs from showing. You are seeing debugging messages so you should also be seeing the deny messsages which to my understanding are Notifications level messages (5)
- Jouni
- Mark as New
- Bookmark
- Subscribe
- Mute
- Subscribe to RSS Feed
- Permalink
- Report Inappropriate Content
01-13-2015 12:11 AM
Hi,
Please see show results below:
Firewall# show run logging
logging enable
logging timestamp
logging standby
logging monitor debugging
logging buffered notifications
logging trap debugging
logging asdm debugging
logging host Management 10.X.X.X
logging host Management 10.X.X.X
no logging message 106015
no logging message 313001
no logging message 313008
no logging message 106023
no logging message 710003
no logging message 106100
no logging message 302015
no logging message 302014
no logging message 302013
no logging message 302018
no logging message 302017
no logging message 302016
no logging message 302021
no logging message 302020
- Mark as New
- Bookmark
- Subscribe
- Mute
- Subscribe to RSS Feed
- Permalink
- Report Inappropriate Content
01-13-2015 12:19 AM
Hi,
If you check my earlier messages you will see that I mentioned the Syslog ID 106023. In your above list its disabled so that is why the ASDM is not showing the logs. And if I can remember correctly you also have disabled some logs that show when a connection is built and torn down from the ASA. The mentioned log messages in my opinion are pretty important messages to record to Syslog server. They are great to have when a user reports a problem that might have begun several days ago or you are possibly trying to track and find a computer in your network that is causing spam and possibly blacklisting your public IPs and so on.
So you would have to enter this command
logging message 106023
Also all these disabled IDs are log messages that record TCP/UDP/ICMP connection forming and teardown
no logging message 302015
no logging message 302014
no logging message 302013
no logging message 302018
no logging message 302017
no logging message 302016
no logging message 302021
no logging message 302020
Basically it means you are not recording any connections that are formed through your firewall.
Also this Syslog ID is related to a situation when ASA blocks some traffic
no logging message 106100
- Jouni
- Mark as New
- Bookmark
- Subscribe
- Mute
- Subscribe to RSS Feed
- Permalink
- Report Inappropriate Content
01-20-2015 12:33 AM
Jouni,
Thanks for your help! I am now able to see notification logs & build a filter. Appreciate your inputs.
Regards,
Yves
- Mark as New
- Bookmark
- Subscribe
- Mute
- Subscribe to RSS Feed
- Permalink
- Report Inappropriate Content
01-20-2015 05:52 AM
Hi,
Glad to hear all is working now. :)
Please do remember to rate any helpfull answers or mark a reply as the correct answer if it answered your question.
- Jouni
- Mark as New
- Bookmark
- Subscribe
- Mute
- Subscribe to RSS Feed
- Permalink
- Report Inappropriate Content
06-21-2019 04:30 AM
Hi
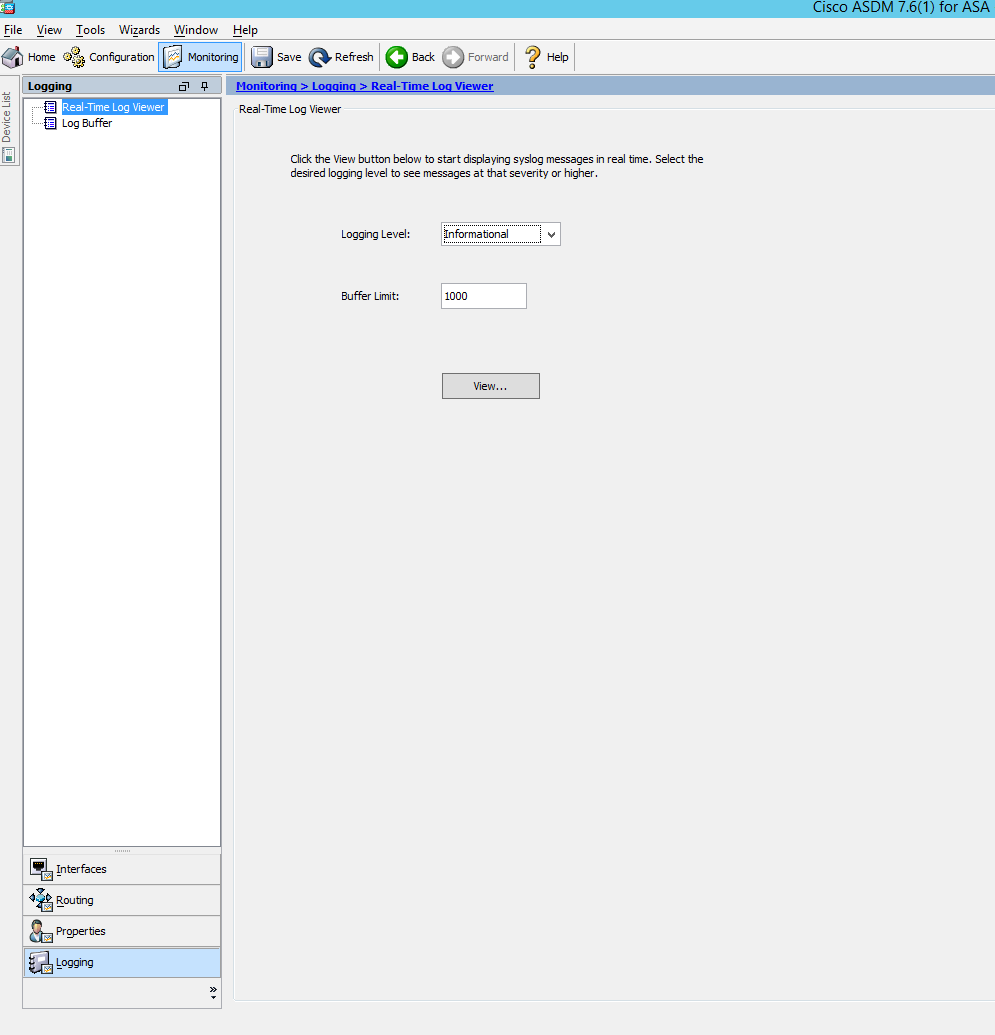
Your reply guided me where to look but the interface is slightly different in ASDM Version 7.6(1) ASA Verson 9.6(2)3
And the Real Time log viewer is located under
Monitoring ->Logging ->Real-Time Log Viewer
I set the logging level to Informational because debugging could be overwhelming.
Find answers to your questions by entering keywords or phrases in the Search bar above. New here? Use these resources to familiarize yourself with the community:
