- Cisco Community
- Technology and Support
- Security
- Network Access Control
- Historical graph of "Active Endpoints"
- Subscribe to RSS Feed
- Mark Topic as New
- Mark Topic as Read
- Float this Topic for Current User
- Bookmark
- Subscribe
- Mute
- Printer Friendly Page
- Mark as New
- Bookmark
- Subscribe
- Mute
- Subscribe to RSS Feed
- Permalink
- Report Inappropriate Content
09-12-2017 02:49 AM
In ISE v2.2 the "Active Endpoints" dashlet in the ISE homepage does a really good job of providing an (almost) real-time view of the users that have authenticated to the network (and are currently connected).
I am now looking for some kind of report that gives a graph of the "Active Endpoints", every hour. Something like, a bar chart, 9am Monday 50 endpoints connected, 10am 120 endpoints connected, etc. This will give my customer a graphical view of the authentication trends during the working week. I could not find anything in reports that does this, but it does seem like a fairly basic feature.
Note: We do not have Prime, Splunk or wish to use the Rest API for this.
Any ideas?
Darren
Solved! Go to Solution.
- Labels:
-
Identity Services Engine (ISE)
Accepted Solutions

")
- Mark as New
- Bookmark
- Subscribe
- Mute
- Subscribe to RSS Feed
- Permalink
- Report Inappropriate Content
03-24-2020 10:53 PM
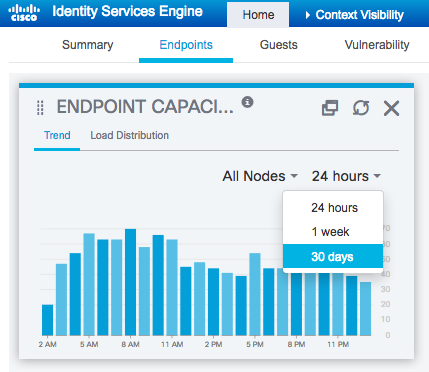
As per the Release Notes, the Endpoint Capacity dashlet was decommissioned in ISE 2.2 patch 8 to prevent performance issues.
Customers typically leverage additional systems like API toolsets or Splunk dashboards to provide this type of trend reporting.
- Mark as New
- Bookmark
- Subscribe
- Mute
- Subscribe to RSS Feed
- Permalink
- Report Inappropriate Content
09-12-2017 08:52 AM
Scratch the above as you seem not wanting to use REST API.
ISE Dashboard for Endpoints have Endpoint Capability dashlet might fit the bill.
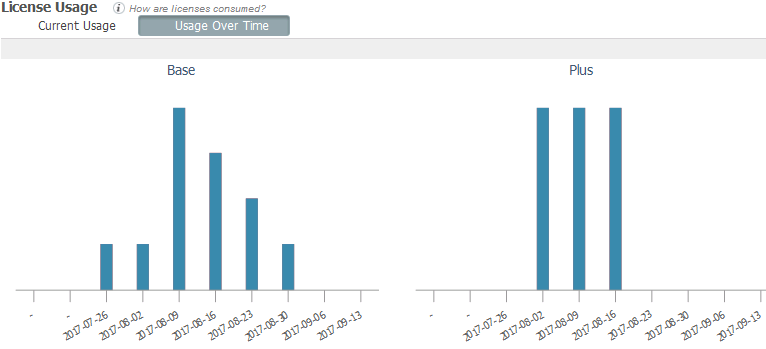
Additionally, ISE licensing page has the usage over time charts, which will give you an idea how the licenses have been used.
- Mark as New
- Bookmark
- Subscribe
- Mute
- Subscribe to RSS Feed
- Permalink
- Report Inappropriate Content
03-23-2020 08:24 AM
That Endpoint Capability dashlet is exactly what I am looking for.
How do I find it? Is it only available in 2.4 and up?
I am on 2.2 and the only chart I can find is "Inactive Endpoints" when I drill into the Active Endpoints metric on the home dashboard.

Do I need a profiler license?
Or just newer version?
Or some other setting.
- Mark as New
- Bookmark
- Subscribe
- Mute
- Subscribe to RSS Feed
- Permalink
- Report Inappropriate Content
03-24-2020 10:53 PM
As per the Release Notes, the Endpoint Capacity dashlet was decommissioned in ISE 2.2 patch 8 to prevent performance issues.
Customers typically leverage additional systems like API toolsets or Splunk dashboards to provide this type of trend reporting.
Discover and save your favorite ideas. Come back to expert answers, step-by-step guides, recent topics, and more.
New here? Get started with these tips. How to use Community New member guide