- Cisco Community
- Technology and Support
- Networking
- Switching
- High CPU (up to 30%) and finding why on cisco nexus 6001
- Subscribe to RSS Feed
- Mark Topic as New
- Mark Topic as Read
- Float this Topic for Current User
- Bookmark
- Subscribe
- Mute
- Printer Friendly Page
High CPU (up to 30%) and finding why on cisco nexus 6001
- Mark as New
- Bookmark
- Subscribe
- Mute
- Subscribe to RSS Feed
- Permalink
- Report Inappropriate Content
08-05-2021 01:20 PM
Hello,
Several weeks I've found unusually high CPU usage on my cisco nexus 6001.
It's up to 30% which leads to slow ssh cli, but console connection works normally.
How to find the issue?
CPU utilization for five seconds: 30%/3%; one minute: 31%; five minutes: 28%
PID    Runtime(ms)  Invoked   uSecs  5Sec    1Min    5Min    TTY  Process
-----  -----------  --------  -----  ------  ------  ------  ---  -----------
 3814   2080832470  2042661456      1   0.31%   0.32%  0.27%   -    snmpd
 3804   1165904730  3482137267      0   0.25%   0.18%  0.18%   -    fwm
 3862          310  2407098321      0   0.53%   0.21%  0.18%   -    pktmgr
 3733       394130  303550778      0   0.13%   0.13%  0.13%   -    sysinfo
 4089   1095081660  3302435989      0   0.13%   0.13%  0.12%   -    dhcp_snoop
 3613    868045800  135990837      6   0.11%   0.11%  0.10%   -    pfma
 3919          370  3942619880      0   0.11%   0.11%  0.10%   -    netstack
 3974          230  3329496747      0   0.05%   0.06%  0.06%   -    igmp
 3763   2147483560  534849954      4   0.03%   0.04%  0.03%   -    bigsurusd
 4091    247308700  2783399895      0   0.03%   0.03%  0.02%   -    interface-vlan
 4087    161992480  741203171      0   0.01%   0.02%  0.02%   -    lacp
 4069    236861100  2147466773      0   0.01%   0.02%  0.01%   -    stp
 3742    156547440  2080626658      0   0.03%   0.02%  0.01%   -    pfstat
 4727          180  736849811      0   0.01%   0.01%  0.01%   -    bgp
 3670    135685250  2102246259      0   0.01%   0.01%  0.01%   -    feature-mgr
show system internal processes cpu
top - 23:13:25 up 1151 days, 12:05,  1 user,  load average: 3.04, 2.27, 2.36
Tasks: 247 total,   1 running, 239 sleeping,   0 stopped,   7 zombie
Cpu(s):  5.1%us,  3.6%sy,  0.0%ni, 90.1%id,  0.0%wa,  0.0%hi,  1.1%si,  0.0%st
Mem:   8238120k total,  3989296k used,  4248824k free,      160k buffers
Swap:        0k total,        0k used,        0k free,  1857572k cached

  PID USER      PR  NI  VIRT  RES  SHR S %CPU %MEM    TIME+  COMMAND
 3862 root      20   0  255m  33m  23m S  7.6  0.4  77237:04 pm
29231 admin     20   0  3604 1544 1148 R  5.7  0.0   0:00.06 top
 3613 root      20   0  209m  29m  20m S  1.9  0.4  14496:59 pfm
 3857 root      20   0  332m  72m  22m S  1.9  0.9   6224:06 arp
 3919 root      20   0  367m  76m  29m S  1.9  1.0  62608:48 netstack
 4089 root      20   0  271m  31m  22m S  1.9  0.4  18285:45 dhcp_snoop
    1 root      20   0  1988  664  584 S  0.0  0.0  20:12.62 init
    2 root      15  -5     0    0    0 S  0.0  0.0   0:00.01 kthreadd
    3 root      RT  -5     0    0    0 S  0.0  0.0   0:56.43 migration/0
    4 root      15  -5     0    0    0 S  0.0  0.0 506:10.35 ksoftirqd/0
    5 root      RT  -5     0    0    0 S  0.0  0.0  19:26.09 watchdog/0
    6 root      RT  -5     0    0    0 S  0.0  0.0   0:43.71 migration/1
    7 root      15  -5     0    0    0 S  0.0  0.0   1005:53 ksoftirqd/1
No traffic loops exists.
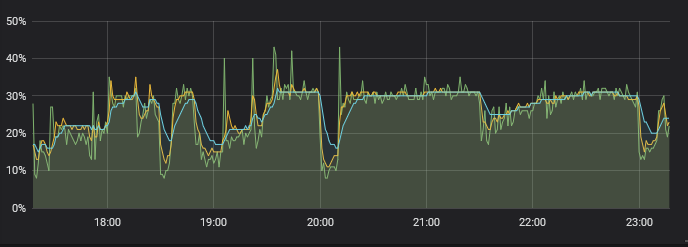
Cpu and used memory looks like this:
Thanks in advance.
- Labels:
-
Network Management
- Mark as New
- Bookmark
- Subscribe
- Mute
- Subscribe to RSS Feed
- Permalink
- Report Inappropriate Content
08-05-2021 11:17 PM
Presumably similar commands will apply to your platform too.
M.
-- ' 'Good body every evening' ' this sentence was once spotted on a logo at the entrance of a Weight Watchers Club !
- Mark as New
- Bookmark
- Subscribe
- Mute
- Subscribe to RSS Feed
- Permalink
- Report Inappropriate Content
08-14-2021 03:56 AM
Yes I know this document.
Unfortunately this don't help ((
- Mark as New
- Bookmark
- Subscribe
- Mute
- Subscribe to RSS Feed
- Permalink
- Report Inappropriate Content
08-14-2021 04:48 AM
Hello,
this is just a wild guess, but there is a bug where unused 1GB SFPs cause high CPU and switch latency. What is the output of:
sh hardware internal bigsur logs runtime
Here is the link to the bug:
Discover and save your favorite ideas. Come back to expert answers, step-by-step guides, recent topics, and more.
New here? Get started with these tips. How to use Community New member guide


