- Cisco Community
- Technology and Support
- Security
- Network Security
- Re: Hello putmanoait,
- Subscribe to RSS Feed
- Mark Topic as New
- Mark Topic as Read
- Float this Topic for Current User
- Bookmark
- Subscribe
- Mute
- Printer Friendly Page
- Mark as New
- Bookmark
- Subscribe
- Mute
- Subscribe to RSS Feed
- Permalink
- Report Inappropriate Content
07-26-2016 02:05 AM - edited 03-12-2019 06:05 AM
Dear Expert,
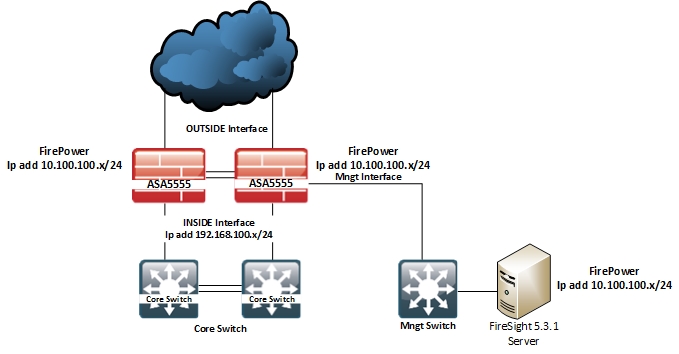
I'm quite new with Cisco FirePower. I have 2 Cisco ASA5555 with Firepower and deploy as Active/Standby. We have three zone INSIDE OUTSIDE and Management. Firesight server is stay in management zone. I registered all Cisco Firepower module to Firesight Mngt center and I succeed inspection traffic through Firepower module on cisco ASA already. I applied IPS default rule for the registered device. I have kept it for 2 day after that I take a look on cisco FireSight there is no any information. It showed "No Data". I wonder I may missed configuration. I try to re-register the devices but it still same. Please see the diagram below for more detail.
I would like to have any support for that issue. If you have any question please let me know
- INSIDE Interface: ip add 192.168.100.x/24
- OUTSIDE interface: ip add x.x.x.x/24
- Management interface: ip 10.100.100.x/24
- FireSight Server ip add: 10.100.100.x/24
Solved! Go to Solution.
- Labels:
-
NGIPS
Accepted Solutions
- Mark as New
- Bookmark
- Subscribe
- Mute
- Subscribe to RSS Feed
- Permalink
- Report Inappropriate Content
07-26-2016 06:14 AM
Hello putmanoait,
Since its a new installation , try to install the latest code to use all new features with the device.After the proper installation and having all the required license including Firesight host license you need to make sure that the traffic has been properly redirected to pass through the Firepower.If the Firepower is redirecting the traffic you can see the same by enabling the logging under the access control policy by Policies > Access Control > Rules > Logging > Logging at beginning of connection or Logging at end of connection . Once after enabling logging, save and reapply or redeploy the policy changes. Each device has its own database connection settings. So you can refer the following link and see how much of events can be logged in the device.
http://www.cisco.com/c/en/us/td/docs/security/firesight/541/user-guide/FireSIGHT-System-UserGuide-v5401/System-Policy.html#pgfId-8018593
If you can see the respective connection events under Analysis > Connection Events , the dashboard data also should populate . If you already enabled the above and still no events are coming up then please perform the following by the login to Firesight CLI by elevating to root user.
1) Verify the following service is running
pmtool status | grep SFTop10Cacher
2) Restart the service
pmtool restartbyid SFTop10Cacher
3) You should see the service as running with a different pid
pmtool status | grep SFTop10Cacher
Verify the dashboard after 30 minutes.
Rate and mark correct if the post helps you.
Regards
Jetsy
- Mark as New
- Bookmark
- Subscribe
- Mute
- Subscribe to RSS Feed
- Permalink
- Report Inappropriate Content
07-26-2016 03:16 AM
Hi,
Have you enabled logging on the access control rule ?
Do you see traffic in connection events as well ?
Thanks,
Ankita
- Mark as New
- Bookmark
- Subscribe
- Mute
- Subscribe to RSS Feed
- Permalink
- Report Inappropriate Content
07-27-2016 08:59 PM
Now everything is fine follow Jetsy.
Thanks for your suppot.
Best regards,
Mano
- Mark as New
- Bookmark
- Subscribe
- Mute
- Subscribe to RSS Feed
- Permalink
- Report Inappropriate Content
07-27-2016 11:24 PM
Hello PutmanoAIT
Glad to know that it worked for you.
Feel free to write to support forums in future.
Regards
Jetsy
- Mark as New
- Bookmark
- Subscribe
- Mute
- Subscribe to RSS Feed
- Permalink
- Report Inappropriate Content
07-26-2016 06:14 AM
Hello putmanoait,
Since its a new installation , try to install the latest code to use all new features with the device.After the proper installation and having all the required license including Firesight host license you need to make sure that the traffic has been properly redirected to pass through the Firepower.If the Firepower is redirecting the traffic you can see the same by enabling the logging under the access control policy by Policies > Access Control > Rules > Logging > Logging at beginning of connection or Logging at end of connection . Once after enabling logging, save and reapply or redeploy the policy changes. Each device has its own database connection settings. So you can refer the following link and see how much of events can be logged in the device.
http://www.cisco.com/c/en/us/td/docs/security/firesight/541/user-guide/FireSIGHT-System-UserGuide-v5401/System-Policy.html#pgfId-8018593
If you can see the respective connection events under Analysis > Connection Events , the dashboard data also should populate . If you already enabled the above and still no events are coming up then please perform the following by the login to Firesight CLI by elevating to root user.
1) Verify the following service is running
pmtool status | grep SFTop10Cacher
2) Restart the service
pmtool restartbyid SFTop10Cacher
3) You should see the service as running with a different pid
pmtool status | grep SFTop10Cacher
Verify the dashboard after 30 minutes.
Rate and mark correct if the post helps you.
Regards
Jetsy
- Mark as New
- Bookmark
- Subscribe
- Mute
- Subscribe to RSS Feed
- Permalink
- Report Inappropriate Content
06-28-2019 12:32 PM
Hello Jetsy,
Does restarting this service also solve the issue with not seeing any Intrusion Events in the dashboard? I can see Connection Events on the dashboard, but for Intrusion Events; it is showing No Data. The policies are working as should and the devices are sending the data to the FMC, but the FMC is not populating these logs in the FMC.
- Mark as New
- Bookmark
- Subscribe
- Mute
- Subscribe to RSS Feed
- Permalink
- Report Inappropriate Content
07-27-2016 08:50 PM
Thanks for your support, Jetsy. Now the dashboard is shown the event.
Have a nice day.
Best regards,
Mano
Find answers to your questions by entering keywords or phrases in the Search bar above. New here? Use these resources to familiarize yourself with the community:
