- Cisco Community
- Technology and Support
- Security
- Network Security
- FTD (Cisco FPR -2100) - IPSec Tunnels Monitoring
- Subscribe to RSS Feed
- Mark Topic as New
- Mark Topic as Read
- Float this Topic for Current User
- Bookmark
- Subscribe
- Mute
- Printer Friendly Page
FTD (Cisco FPR -2100) - IPSec Tunnels Monitoring
- Mark as New
- Bookmark
- Subscribe
- Mute
- Subscribe to RSS Feed
- Permalink
- Report Inappropriate Content
07-02-2020 07:14 AM - edited 07-02-2020 07:16 AM
Hi All,
We have to monitor the status of IPSec tunnels created FPR-2100 (managed by FMC) by Network Monitoring System(NMS) .
FPR IOS : 6.4.0.7 (Build 53).
Requirement is to monitor all IPSec tunnels status through NMS ....if any of the tunnel goes down...NMS should trigger a event or alert , followed by generation of Auto-Ticket from ticketing tool.
We tried all possible options , but can't able to find the solution even workaround also. If anyone have gone through such problem please share how it was sorted-out.
Rgds
***
- Mark as New
- Bookmark
- Subscribe
- Mute
- Subscribe to RSS Feed
- Permalink
- Report Inappropriate Content
07-03-2020 01:30 AM
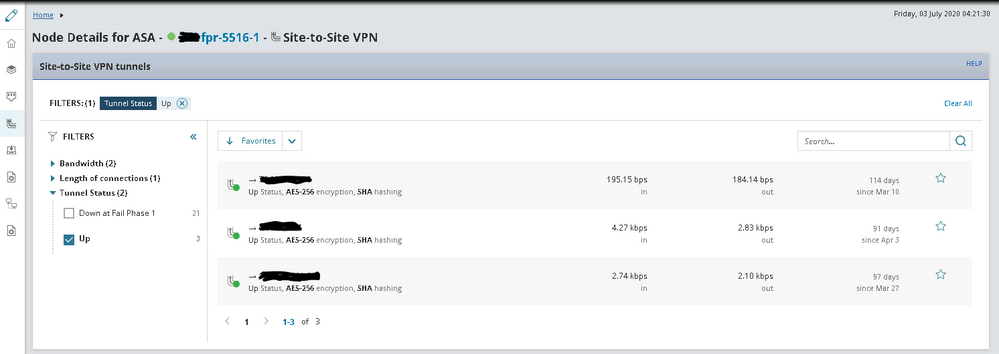
I'm doing this successfully with an FTD device and SolarWinds NPM. In my case it's running on an ASA 5516-X hardware appliance but the operation is the same since they both run the Firepower Threat Defense image.
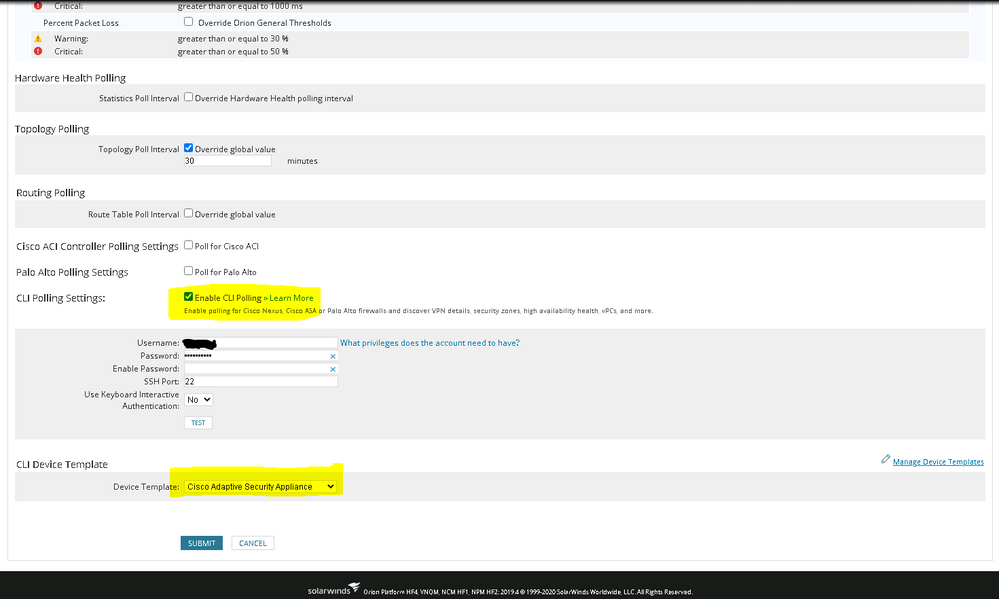
I monitor the data interface with SNMP and use the "enable cli polling" option in SolarWinds (under "edit node") to get VPN statistics. Tell it to use the ASA device template so it knows the "show" command to use for VPN stats.
- Mark as New
- Bookmark
- Subscribe
- Mute
- Subscribe to RSS Feed
- Permalink
- Report Inappropriate Content
07-07-2020 06:31 AM - edited 07-07-2020 06:40 AM
Thanks Marvin....!!
We are also working in same direction....But stuck with CLI credentials (not able to do cli on FTD with diagnostic interface) , Point to highlight here is that "we are polling FTD with Diagnostic Interfaces and not sure whether this support SSH access or not".?
Are you using any OID or simply configured or enabled "CLI polling" that's it....
If using any OID, pls share the same (FTD compatible).
Rgds
***
- Mark as New
- Bookmark
- Subscribe
- Mute
- Subscribe to RSS Feed
- Permalink
- Report Inappropriate Content
07-07-2020 10:18 AM
The instance I was polling was using the cli polling with a data interface and the ASA template. I believe under the covers SolarWinds is parsing a show command or two rather than using SNMP for this particular monitoring feature.
- Mark as New
- Bookmark
- Subscribe
- Mute
- Subscribe to RSS Feed
- Permalink
- Report Inappropriate Content
07-07-2020 11:01 PM - edited 07-07-2020 11:03 PM
Ok, Meanwhile i also checked - Diagnostic(mgmt) interface won't support SSH. Therefore have to check with some data interface as you also mentioned.
Could you please explore what you mean about ASA template. did you referring OIDs (for ASA).
- Mark as New
- Bookmark
- Subscribe
- Mute
- Subscribe to RSS Feed
- Permalink
- Report Inappropriate Content
07-08-2020 01:04 AM
When I refer to device template I am talking about the one I highlighted in my screenshot earlier. See my reply of 07-03-2020 04:30 PM.
- Mark as New
- Bookmark
- Subscribe
- Mute
- Subscribe to RSS Feed
- Permalink
- Report Inappropriate Content
07-08-2020 05:31 AM
- Mark as New
- Bookmark
- Subscribe
- Mute
- Subscribe to RSS Feed
- Permalink
- Report Inappropriate Content
07-09-2020 01:43 AM
Now new observation, When have selected other interface (data interface) for polling the FTD despite of diagnostic interface and also changed the NMS poller servers which may have best reachability from FTD's identified Data Interface.
Have configured SNMP parameters for new pollers from FMC and pushed properly also. But same are not visible in FTD's CLI, can able to see only SNMP configurations of old pollers
- Mark as New
- Bookmark
- Subscribe
- Mute
- Subscribe to RSS Feed
- Permalink
- Report Inappropriate Content
07-09-2020 04:35 AM
Sorry but I don't understand your latest question.
- Mark as New
- Bookmark
- Subscribe
- Mute
- Subscribe to RSS Feed
- Permalink
- Report Inappropriate Content
07-09-2020 07:49 AM
:-) Lemme try to explain again......
We have selected a new Data Interface (other then diagnostic interface) of Cisco FTD for polling the same from NMS and............ additionally also changed the NMS servers(eg NMS server Changed from IP-172.16.10.1 to IP-10.10.10.100) which is having the best reachability from FTD's new identified Data Interface.
From FMC.... SNMP configuration for new NMS (10.10.10.100) for Cisco FTD has been executed and pushed properly also. But same are not visible in FTD's CLI, can able to see SNMP configurations of old NMS server only which was 172.16.10.1, new SNMP configuration for 10.10.10.100 NMS is nowhere.
- Mark as New
- Bookmark
- Subscribe
- Mute
- Subscribe to RSS Feed
- Permalink
- Report Inappropriate Content
07-09-2020 08:44 AM
So you are saying the changes which were deployed (successfully according to FMC) are not appearing in the running config?
There have been some bugs with this behavior. What version of Firepower are you running?
- Mark as New
- Bookmark
- Subscribe
- Mute
- Subscribe to RSS Feed
- Permalink
- Report Inappropriate Content
07-09-2020 09:56 AM
Firepower : 6.4.0.7 (Build 53).
- Mark as New
- Bookmark
- Subscribe
- Mute
- Subscribe to RSS Feed
- Permalink
- Report Inappropriate Content
07-29-2020 06:17 AM - edited 07-30-2020 04:20 AM
Hi Marvin,
Just to share that we have successfully polled FTD device with Data Interface now.....Have configured CLI credentials as required for VPN/IPSec tunnel status monitoring, template also selected as "Cisco Adaptive Security Appliance".
But still not getting a option (at upper left site) for getting Site-to-Site VPN view . I am suspecting it could be due to privilege limitation (probably...but not sure) on given CLI credential.
What level of privilege did you configured for CLI credential which is in use for VPN status monitoring on NMS console in your case.
Or , If this require some OIDs snmp walk and configuration also. If yes, requesting if you can share those OIDs.
Pl also note that our FPR version is - FPR IOS : 6.4.0.7 (Build 53) and is managed by FMC. Hope limitation is not due to version.
You may add , if feel i am missing anything.
Rgds
***
- Mark as New
- Bookmark
- Subscribe
- Mute
- Subscribe to RSS Feed
- Permalink
- Report Inappropriate Content
08-13-2020 01:04 AM
Hello All,
We have polled below 04 OIDs for getting IPSec Tunnel Status from Cisco FTD.
1.3.6.1.4.1.9.9.171.1.2.1.1. cikeGlobalActiveTunnels (Currently active phase-1)
1.3.6.1.4.1.9.9.171.1.2.1.2. cikeGlobalPreviousTunnels (Previously active phase-1)
1.3.6.1.4.1.9.9.171.1.3.1.1. cipSecGlobalActiveTunnels (Currently active phase-2)
1.3.6.1.4.1.9.9.171.1.3.1.2. cipSecGlobalPreviousTunnels (Previously active phase-2)
getting the counts against each one. But they are not exact as per actual scenario.
Also like to understand, out of above 04 OIDs which is/are the most relevant one on which rule /alerts can be configure
As per my understanding, should be both OIDs for Phase-1.
opinion welcome.
- Mark as New
- Bookmark
- Subscribe
- Mute
- Subscribe to RSS Feed
- Permalink
- Report Inappropriate Content
08-13-2020 02:17 AM
number of SAs in the output 'show crypto isakmp sa' or 'show crypto ikev2
sa'
The 2nd set of OIDs are related to phase-2 SAs. These are equivalent to the
number of SAs in 'show crypto ipsec sa'
You might have 1st-OIDs more than 2nd-OIDs if you have tunnels completing
phase-1 but failing phase-2
***** please remember to rate useful posts
Discover and save your favorite ideas. Come back to expert answers, step-by-step guides, recent topics, and more.
New here? Get started with these tips. How to use Community New member guide


