- Subscribe to RSS Feed
- Mark Topic as New
- Mark Topic as Read
- Float this Topic for Current User
- Bookmark
- Subscribe
- Mute
- Printer Friendly Page
3750 Stacks OutDiscards drops
- Mark as New
- Bookmark
- Subscribe
- Mute
- Subscribe to RSS Feed
- Permalink
- Report Inappropriate Content
11-23-2015 12:27 AM - edited 03-05-2019 02:47 AM
Hello everybody,
I'm posting today because we have an OutDiscards drops problem, on 3750 stacks.
I've done a lot of a research, and found nothing for the moment.
i changed the jumbo MTU to 9000, but no effect.
The stacks are composed with 3 3750X.
IOS : Cisco IOS Software, C3750E Software (C3750E-IPBASEK9-M), Version 15.0(2)SE8, RELEASE SOFTWARE (fc1)
We dont use any MLS QOS and flow control is off.
The Output drops are on interfaces used to many things :
NetAPP interconnection (2 1Gb/s ports, etherchannel on), between 600GB - 1To data traffic every nights
Switchs interconnection, low traffic
Server connection for monitoring (vlan and port mirroring)
The amouts of drops are differents on all interfaces.
For exemple :
Stack 1 :
Gi1/0/2 0 0 0 0 0 413122 ---> One port of the etherchannel to NetAPP
Gi1/0/38 0 0 0 0 0 1293352 ---> Mirroring port
Gi1/0/39 0 0 0 0 0 41257167 ---> Mirroring port
Stack 2 :
Gi4/0/38 0 0 0 0 0 616456816 ---> Mirroring port
We have no specific errors on ports, like pause input or CRC etc...
The only thing i've noticed, is the port-asic drop :
Backbone_1_2_3#sh platform port-asic stats drop gi1/0/38
Interface Gi1/0/38 TxQueue Drop Statistics
Queue 0
Weight 0 Frames 0
Weight 1 Frames 0
Weight 2 Frames 0
Queue 1
Weight 0 Frames 2341
Weight 1 Frames 12
Weight 2 Frames 0
Queue 2
Weight 0 Frames 0
Weight 1 Frames 0
Weight 2 Frames 0
Queue 3
Weight 0 Frames 0
Weight 1 Frames 0
Weight 2 Frames 1293417
Queue 4
Weight 0 Frames 0
Weight 1 Frames 0
Weight 2 Frames 0
Queue 5
Weight 0 Frames 0
Weight 1 Frames 0
Weight 2 Frames 0
Queue 6
Weight 0 Frames 0
Weight 1 Frames 0
Weight 2 Frames 0
Queue 7
Weight 0 Frames 0
Weight 1 Frames 0
Weight 2 Frames 0
I dont really know what to search at this point.
Does anybody have some idea ?
Thanks !
- Labels:
-
Other Routing
")
")
- Mark as New
- Bookmark
- Subscribe
- Mute
- Subscribe to RSS Feed
- Permalink
- Report Inappropriate Content
11-23-2015 02:02 AM
can you pst one of the interfaces , have you checked what the raitio to traffic is compared to drops anything over 1% is not recommended by Cisco
3750 are known as well to hjave buffer issues in hardwrae very small so it could be legitmate that you are dropping thesesd packets due to hardware restrictions
can you post show int x/x
and
show buffers
- Mark as New
- Bookmark
- Subscribe
- Mute
- Subscribe to RSS Feed
- Permalink
- Report Inappropriate Content
11-23-2015 02:17 AM
Hi Mark, and thaks for your help.
Most of interfaces experiencing drops are un 1% of drop.
But one of them in particular, is above the 36% !
Here is a show interface of the 36% drop interface, used for monitoring to a server (SecurActive)
Backbone_4_5_6#sh int gi4/0/38
GigabitEthernet4/0/38 is up, line protocol is down (monitoring)
Hardware is Gigabit Ethernet, address is b838.6159.be26 (bia b838.6159.be26)
Description: Securactive-Vsw_Mirror2_Vmnic1-Sonde_eth2
MTU 9000 bytes, BW 1000000 Kbit/sec, DLY 10 usec,
reliability 255/255, txload 21/255, rxload 1/255
Encapsulation ARPA, loopback not set
Keepalive set (10 sec)
Full-duplex, 1000Mb/s, media type is 10/100/1000BaseTX
input flow-control is off, output flow-control is unsupported
ARP type: ARPA, ARP Timeout 04:00:00
Last input never, output 2d02h, output hang never
Last clearing of "show interface" counters never
Input queue: 0/75/0/0 (size/max/drops/flushes); Total output drops: 628803350
Queueing strategy: fifo
Output queue: 0/40 (size/max)
5 minute input rate 0 bits/sec, 0 packets/sec
5 minute output rate 84664000 bits/sec, 14539 packets/sec
2 packets input, 128 bytes, 0 no buffer
Received 2 broadcasts (0 multicasts)
0 runts, 0 giants, 0 throttles
0 input errors, 0 CRC, 0 frame, 0 overrun, 0 ignored
0 watchdog, 0 multicast, 0 pause input
0 input packets with dribble condition detected
1723080315 packets output, 1510293158202 bytes, 0 underruns
0 output errors, 0 collisions, 1 interface resets
0 unknown protocol drops
0 babbles, 0 late collision, 0 deferred
0 lost carrier, 0 no carrier, 0 pause output
0 output buffer failures, 0 output buffers swapped out
And there is a show interface for the NetAPP etherchannel :
Backbone_1_2_3#sh int po3
Port-channel3 is up, line protocol is up (connected)
Hardware is EtherChannel, address is b838.615a.8b02 (bia b838.615a.8b02)
Description: LACP-BD-34+36
MTU 9000 bytes, BW 2000000 Kbit/sec, DLY 10 usec,
reliability 255/255, txload 1/255, rxload 1/255
Encapsulation ARPA, loopback not set
Keepalive set (10 sec)
Full-duplex, 1000Mb/s, link type is auto, media type is unknown
input flow-control is off, output flow-control is unsupported
Members in this channel: Gi1/0/2 Gi2/0/2
ARP type: ARPA, ARP Timeout 04:00:00
Last input never, output 00:00:00, output hang never
Last clearing of "show interface" counters never
Input queue: 0/75/0/0 (size/max/drops/flushes); Total output drops: 415504
Queueing strategy: fifo
Output queue: 0/40 (size/max)
30 second input rate 31000 bits/sec, 3 packets/sec
30 second output rate 11000 bits/sec, 17 packets/sec
592505124 packets input, 48438660637 bytes, 0 no buffer
Received 3293 broadcasts (8 multicasts)
0 runts, 0 giants, 0 throttles
0 input errors, 0 CRC, 0 frame, 0 overrun, 0 ignored
0 watchdog, 8 multicast, 0 pause input
0 input packets with dribble condition detected
1074092093 packets output, 1630121772158 bytes, 0 underruns
0 output errors, 0 collisions, 1 interface resets
0 unknown protocol drops
0 babbles, 0 late collision, 0 deferred
0 lost carrier, 0 no carrier, 0 pause output
0 output buffer failures, 0 output buffers swapped out
There is the show buffer for the two stacks :
Stack1 :
Backbone_1_2_3#show buffers
Buffer elements:
1650 in free list (500 max allowed)
32935997 hits, 0 misses, 1641 created
Public buffer pools:
Small buffers, 104 bytes (total 50, permanent 50, peak 191 @ 2d02h):
48 in free list (20 min, 150 max allowed)
16114247 hits, 59 misses, 174 trims, 174 created
0 failures (0 no memory)
Middle buffers, 600 bytes (total 25, permanent 25, peak 115 @ 2d02h):
24 in free list (10 min, 150 max allowed)
457353 hits, 32 misses, 96 trims, 96 created
0 failures (0 no memory)
Big buffers, 1536 bytes (total 65, permanent 50, peak 345 @ 2d02h):
65 in free list (5 min, 150 max allowed)
4273031 hits, 357 misses, 1056 trims, 1071 created
0 failures (0 no memory)
VeryBig buffers, 4520 bytes (total 16, permanent 10, peak 16 @ 2d02h):
1 in free list (0 min, 100 max allowed)
74 hits, 3 misses, 18 trims, 24 created
0 failures (0 no memory)
Large buffers, 5024 bytes (total 1, permanent 0, peak 1 @ 2d02h):
1 in free list (0 min, 10 max allowed)
0 hits, 0 misses, 18 trims, 19 created
0 failures (0 no memory)
Huge buffers, 18024 bytes (total 4, permanent 0, peak 6 @ 2d02h):
4 in free list (0 min, 4 max allowed)
123808 hits, 4247 misses, 8325 trims, 8329 created
0 failures (0 no memory)
Interface buffer pools:
Syslog ED Pool buffers, 600 bytes (total 133, permanent 132, peak 133 @ 2d02h):
101 in free list (132 min, 132 max allowed)
491 hits, 0 misses
FastEthernet0-Physical buffers, 1524 bytes (total 32, permanent 32):
8 in free list (0 min, 32 max allowed)
24 hits, 0 fallbacks
8 max cache size, 8 in cache
0 hits in cache, 0 misses in cache
RxQ1 buffers, 2040 bytes (total 128, permanent 128):
1 in free list (0 min, 128 max allowed)
91025 hits, 784 fallbacks
RxQ2 buffers, 2040 bytes (total 128, permanent 128):
1 in free list (0 min, 128 max allowed)
418105 hits, 3266 fallbacks, 0 trims, 0 created
3266 failures (0 no memory)
RxQ3 buffers, 2040 bytes (total 128, permanent 128):
2 in free list (0 min, 128 max allowed)
2932619 hits, 77878 fallbacks
RxQ4 buffers, 2040 bytes (total 128, permanent 128):
0 in free list (0 min, 128 max allowed)
73107 hits, 177330 misses
RxQ5 buffers, 2040 bytes (total 128, permanent 128):
64 in free list (0 min, 128 max allowed)
64 hits, 0 misses
RxQ6 buffers, 2040 bytes (total 128, permanent 128):
0 in free list (0 min, 128 max allowed)
2606343 hits, 5197618 misses
RxQ7 buffers, 2040 bytes (total 1200, permanent 1200):
399 in free list (0 min, 1200 max allowed)
2573171 hits, 0 misses
RxQ8 buffers, 2040 bytes (total 64, permanent 64):
0 in free list (0 min, 64 max allowed)
1277497 hits, 2224814 misses
RxQ9 buffers, 2040 bytes (total 1, permanent 1):
0 in free list (0 min, 1 max allowed)
1 hits, 0 misses
RxQ10 buffers, 2040 bytes (total 64, permanent 64):
1 in free list (0 min, 64 max allowed)
2175959 hits, 36111 fallbacks
RxQ11 buffers, 2040 bytes (total 16, permanent 16):
1 in free list (0 min, 16 max allowed)
62057472 hits, 62532735 misses
RxQ12 buffers, 2040 bytes (total 96, permanent 96):
0 in free list (0 min, 96 max allowed)
112 hits, 878 misses
RxQ13 buffers, 2040 bytes (total 16, permanent 16):
0 in free list (0 min, 16 max allowed)
16 hits, 0 misses
RxQ15 buffers, 2040 bytes (total 4, permanent 4):
0 in free list (0 min, 4 max allowed)
3619753 hits, 3619749 misses
HRPCRespFallback buffers, 1500 bytes (total 80, permanent 80):
80 in free list (0 min, 80 max allowed)
0 hits, 0 misses
RxQFB buffers, 2040 bytes (total 904, permanent 904):
898 in free list (0 min, 904 max allowed)
118075 hits, 0 misses
RxQ0 buffers, 2040 bytes (total 1200, permanent 1200):
678 in free list (0 min, 1200 max allowed)
6608963 hits, 0 misses
IPC buffers, 2048 bytes (total 300, permanent 300):
279 in free list (150 min, 500 max allowed)
470693 hits, 0 fallbacks, 0 trims, 0 created
0 failures (0 no memory)
Jumbo buffers, 9240 bytes (total 200, permanent 200):
200 in free list (0 min, 200 max allowed)
0 hits, 0 misses
IPC Medium buffers, 16384 bytes (total 2, permanent 2):
2 in free list (1 min, 8 max allowed)
0 hits, 0 fallbacks, 0 trims, 0 created
0 failures (0 no memory)
IPC Large buffers, 65535 bytes (total 2, permanent 2, peak 17 @ 2d02h):
2 in free list (1 min, 8 max allowed)
0 hits, 0 misses, 1 trims, 1 created
0 failures (0 no memory)
Header pools:
Stack2
Backbone_4_5_6#show buffer
Buffer elements:
1650 in free list (500 max allowed)
21003155 hits, 0 misses, 1641 created
Public buffer pools:
Small buffers, 104 bytes (total 50, permanent 50, peak 191 @ 2d02h):
48 in free list (20 min, 150 max allowed)
10314743 hits, 56 misses, 168 trims, 168 created
0 failures (0 no memory)
Middle buffers, 600 bytes (total 25, permanent 25, peak 112 @ 2d02h):
24 in free list (10 min, 150 max allowed)
456885 hits, 31 misses, 93 trims, 93 created
0 failures (0 no memory)
Big buffers, 1536 bytes (total 53, permanent 50, peak 491 @ 2d02h):
51 in free list (5 min, 150 max allowed)
2451079 hits, 477 misses, 1428 trims, 1431 created
0 failures (0 no memory)
VeryBig buffers, 4520 bytes (total 16, permanent 10, peak 16 @ 2d02h):
1 in free list (0 min, 100 max allowed)
74 hits, 3 misses, 18 trims, 24 created
0 failures (0 no memory)
Large buffers, 5024 bytes (total 1, permanent 0, peak 1 @ 2d02h):
1 in free list (0 min, 10 max allowed)
0 hits, 0 misses, 18 trims, 19 created
0 failures (0 no memory)
Huge buffers, 18024 bytes (total 4, permanent 0, peak 6 @ 2d02h):
4 in free list (0 min, 4 max allowed)
113138 hits, 3323 misses, 6521 trims, 6525 created
0 failures (0 no memory)
Interface buffer pools:
Syslog ED Pool buffers, 600 bytes (total 133, permanent 132, peak 133 @ 2d02h):
101 in free list (132 min, 132 max allowed)
793 hits, 0 misses
FastEthernet0-Physical buffers, 1524 bytes (total 32, permanent 32):
8 in free list (0 min, 32 max allowed)
24 hits, 0 fallbacks
8 max cache size, 8 in cache
0 hits in cache, 0 misses in cache
RxQ1 buffers, 2040 bytes (total 128, permanent 128):
4 in free list (0 min, 128 max allowed)
1475936 hits, 63446 fallbacks
RxQ2 buffers, 2040 bytes (total 128, permanent 128):
1 in free list (0 min, 128 max allowed)
487925 hits, 3811 fallbacks, 0 trims, 0 created
3811 failures (0 no memory)
RxQ3 buffers, 2040 bytes (total 128, permanent 128):
6 in free list (0 min, 128 max allowed)
4362354 hits, 111195 fallbacks
RxQ4 buffers, 2040 bytes (total 128, permanent 128):
0 in free list (0 min, 128 max allowed)
73254 hits, 129603 misses
RxQ5 buffers, 2040 bytes (total 128, permanent 128):
64 in free list (0 min, 128 max allowed)
64 hits, 0 misses
RxQ6 buffers, 2040 bytes (total 128, permanent 128):
0 in free list (0 min, 128 max allowed)
4094 hits, 7988 misses
RxQ7 buffers, 2040 bytes (total 1200, permanent 1200):
399 in free list (0 min, 1200 max allowed)
918268 hits, 0 misses
RxQ8 buffers, 2040 bytes (total 64, permanent 64):
0 in free list (0 min, 64 max allowed)
2858230 hits, 3224977 misses
RxQ9 buffers, 2040 bytes (total 1, permanent 1):
0 in free list (0 min, 1 max allowed)
1 hits, 0 misses
RxQ10 buffers, 2040 bytes (total 64, permanent 64):
1 in free list (0 min, 64 max allowed)
2062886 hits, 38432 fallbacks
RxQ11 buffers, 2040 bytes (total 16, permanent 16):
0 in free list (0 min, 16 max allowed)
35034 hits, 35622 misses
RxQ12 buffers, 2040 bytes (total 96, permanent 96):
0 in free list (0 min, 96 max allowed)
96 hits, 0 misses
RxQ13 buffers, 2040 bytes (total 16, permanent 16):
0 in free list (0 min, 16 max allowed)
16 hits, 0 misses
RxQ15 buffers, 2040 bytes (total 4, permanent 4):
0 in free list (0 min, 4 max allowed)
3631788 hits, 3631784 misses
HRPCRespFallback buffers, 1500 bytes (total 80, permanent 80):
80 in free list (0 min, 80 max allowed)
0 hits, 0 misses
RxQFB buffers, 2040 bytes (total 904, permanent 904):
891 in free list (0 min, 904 max allowed)
217014 hits, 0 misses
RxQ0 buffers, 2040 bytes (total 1200, permanent 1200):
698 in free list (0 min, 1200 max allowed)
4717962 hits, 0 misses
IPC buffers, 2048 bytes (total 300, permanent 300):
279 in free list (150 min, 500 max allowed)
587480 hits, 0 fallbacks, 0 trims, 0 created
0 failures (0 no memory)
Jumbo buffers, 9240 bytes (total 200, permanent 200):
200 in free list (0 min, 200 max allowed)
0 hits, 0 misses
IPC Medium buffers, 16384 bytes (total 2, permanent 2):
2 in free list (1 min, 8 max allowed)
0 hits, 0 fallbacks, 0 trims, 0 created
0 failures (0 no memory)
IPC Large buffers, 65535 bytes (total 2, permanent 2, peak 17 @ 2d02h):
2 in free list (1 min, 8 max allowed)
0 hits, 0 misses, 1 trims, 1 created
0 failures (0 no memory)
Header pools:
Maybe a silly question, but does the fact to have a stack of 3 3750X help for buffer issues ?
- Mark as New
- Bookmark
- Subscribe
- Mute
- Subscribe to RSS Feed
- Permalink
- Report Inappropriate Content
11-23-2015 02:28 AM
some of your queues there have failures in them , just not enough resources to process the amount of traffic so its being dropped
anything under 1% is standard wouldnt bother as its under recommendation and there is always going to be legitmate drops
thats a span port what are you spanning exactly as if its multiple ports to one thats going to be expected as its overloaded ?
3750s are not great choice for SAN traffic due to there known buffer issues , flow-control can help in this situation under the interface as it gives far end device time to respond , make sure as well your SAN port is not sending burst traffic as that will cause output drops as well
Make sure the show controllers for the interfaces are clean too
- Mark as New
- Bookmark
- Subscribe
- Mute
- Subscribe to RSS Feed
- Permalink
- Report Inappropriate Content
11-23-2015 03:20 AM
I've checked with the "sh controllers ethernet-controller gix/x/x", no collisions or FCS or any error.
About the 1% thing, if my understanding is right : it's ok to have some drop but it MUST no be superior at 1% ?
We are using mirroring ports that are connected directly to a server. This server (SecurActive) is used to monitor traffic.
Some of them monitor many Vlans. For exemple, port Gi4/0/38 monitor these vlans : 10,20,140,150,160,170,200,950
On the show interface gi4/0/38, we see that the traffic used is above 68Mb/s, for a 1Gb/s link.
As u said, i think buffer is not enough for the SAN, but it's not really a problem for us.
The most of SAN traffic we have is the night, when there are replications. During the day, we dont have a lot of traffic, so no drops.
One more thing i'll have to do, is to re orgnanize the ports management on stacks.
Because one my two stacks (3 3750x), we almost dont use the last switch of the stack.
Do you think it might help for these issues ?
- Mark as New
- Bookmark
- Subscribe
- Mute
- Subscribe to RSS Feed
- Permalink
- Report Inappropriate Content
12-06-2015 02:11 AM
The Best way to check bursty traffic in your setup , the quickest process will be to do a Tx-SPAN on the interface you see ouptut drops. You need to make sure you configure the SPAN at the time of output drops incrementing.
A 2sec capture will be good enough. You can see the traffic pattern in wireshark IO-graph.
Regards
Arjun
- Mark as New
- Bookmark
- Subscribe
- Mute
- Subscribe to RSS Feed
- Permalink
- Report Inappropriate Content
12-07-2015 02:14 AM
Hi everybody,
Implementing MSL QOS did not help.
I still have OutDiscards.
I tried to do what you said Arjun.
Here are my traffic patterns :

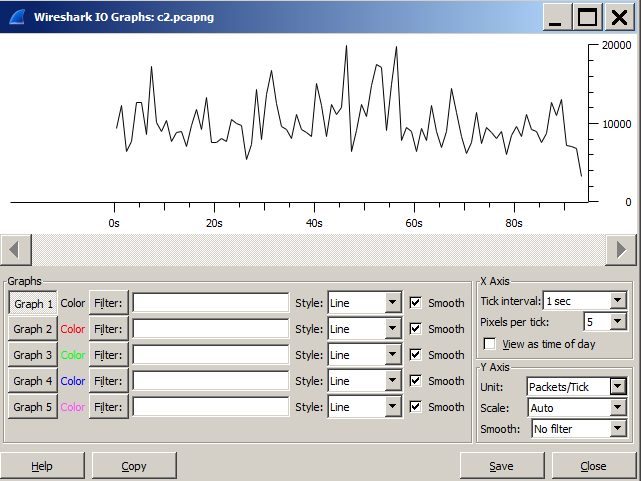
I begin to think that the problem is really comming from the 3750X and their tiny buffers
- Mark as New
- Bookmark
- Subscribe
- Mute
- Subscribe to RSS Feed
- Permalink
- Report Inappropriate Content
12-07-2015 04:54 AM
i'm looking at my pcap file and one thing seems strange to me.
I see a LOT (really, a lot!) of TCP Out-of-order/ retransmission/ Dup ack.
there is no specific source or destination. I guess that's not a good thing, but i dont really know how to troubleshot this.
- Mark as New
- Bookmark
- Subscribe
- Mute
- Subscribe to RSS Feed
- Permalink
- Report Inappropriate Content
12-11-2015 10:45 AM
Hello,
The graph shows you indeed see momentory burst. Please have look at the sudden spikes.
Regards
Arjun
- Mark as New
- Bookmark
- Subscribe
- Mute
- Subscribe to RSS Feed
- Permalink
- Report Inappropriate Content
11-23-2015 03:31 AM
Disclaimer
The Author of this posting offers the information contained within this posting without consideration and with the reader's understanding that there's no implied or expressed suitability or fitness for any purpose. Information provided is for informational purposes only and should not be construed as rendering professional advice of any kind. Usage of this posting's information is solely at reader's own risk.
Liability Disclaimer
In no event shall Author be liable for any damages wha2tsoever (including, without limitation, damages for loss of use, data or profit) arising out of the use or inability to use the posting's information even if Author has been advised of the possibility of such damage.
Posting
As Mark has already noted the 3560/3750 series are a bit infamous for dropping packets when traffic is bursty. This expecially true if you enable QoS with its default settings.
Although you note you don't have QoS enabled, I've had good success with buffer tuning (with QoS) to mitigate bursty drops. (As in going from several every second to just a few per day.)
What you migth also want to be aware of, the 3750 has 2 MB buffer RAM per 24 copper ports and for its uplink ports. So, where you connect busy ports can impact buffer drops.
- Mark as New
- Bookmark
- Subscribe
- Mute
- Subscribe to RSS Feed
- Permalink
- Report Inappropriate Content
11-23-2015 04:37 AM
Thanks for the help Joseph !
So effectively, one thing i can do is to think again about the port management, because on the two stack, each have one 3750 almost not used.
About the QoS, i did some research, but it still getting confusing me. I was wondering if i should enable it, or leave it disable.
I'm actually reading this article, but it's a but hard for me to understand everything :
https://supportforums.cisco.com/document/31581/egress-qos
If i want to enable it, and do some tuning, do you have any advice or is there a default "best practice" to implement ?
- Mark as New
- Bookmark
- Subscribe
- Mute
- Subscribe to RSS Feed
- Permalink
- Report Inappropriate Content
11-23-2015 05:36 AM
Disclaimer
The Author of this posting offers the information contained within this posting without consideration and with the reader's understanding that there's no implied or expressed suitability or fitness for any purpose. Information provided is for informational purposes only and should not be construed as rendering professional advice of any kind. Usage of this posting's information is solely at reader's own risk.
Liability Disclaimer
In no event shall Author be liable for any damages wha2tsoever (including, without limitation, damages for loss of use, data or profit) arising out of the use or inability to use the posting's information even if Author has been advised of the possibility of such damage.
Posting
So effectively, one thing i can do is to think again about the port management, because on the two stack, each have one 3750 almost not used.
Yes, and again, realize uplink ports have less ports to share their 2 MB with then the copper ports.
About the QoS, i did some research, but it still getting confusing me. I was wondering if i should enable it, or leave it disable.
I believe it's the only way to enable buffer tuning, but understand, without buffer tuning, enabling with defaults may worsen your drops.
I'm actually reading this article, but it's a but hard for me to understand everything :
https://supportforums.cisco.com/document/31581/egress-qos
That's an excellent paper, in fact, until I read it, 3750 buffer management never made any sense to me. But even it can be confusing.
If i want to enable it, and do some tuning, do you have any advice or is there a default "best practice" to implement ?
Unsure there's a "best practice". My advice, based on what I found worked for me, was to push about all buffers to the common pool (3rd parameter queue set) and increase each interface's egress queue dynamic draw allowance (1st, 2nd, 4th parameters queue set) to nearly the maximum. You can also adjust the buffer (buffers command) allocations per queue, to allow the queue (or queues) you're using to draw even more from the common pool.
e.g. (max dynamic resources - assumes you only use 1st egress queue)
mls qos queue-set output 1 buffers 99 1 0 0
mls qos queue-set output 1 threshold 1 3200 3200 1 3200
mls qos queue-set output 1 threshold 2 3200 3200 1 3200
mls qos queue-set output 1 threshold 3 3200 3200 1 3200
mls qos queue-set output 1 threshold 4 3200 3200 1 3200
For the above to be active, believe you'll need to activate QoS.
NB: above is maximum resources for egress Q1, and it might not be the ideal config for you
- Mark as New
- Bookmark
- Subscribe
- Mute
- Subscribe to RSS Feed
- Permalink
- Report Inappropriate Content
11-24-2015 06:07 AM
fyi:
If your wondering about the impact of buffer tuning, you might want to see: https://supportforums.cisco.com/discussion/12709441/high-total-ouput-dropsoutdiscards-catalyst-2960s2960x
- Mark as New
- Bookmark
- Subscribe
- Mute
- Subscribe to RSS Feed
- Permalink
- Report Inappropriate Content
11-24-2015 06:13 AM
Thanks a lot Joseph.
I'm gonna take a look about that too :)
- Mark as New
- Bookmark
- Subscribe
- Mute
- Subscribe to RSS Feed
- Permalink
- Report Inappropriate Content
11-25-2015 12:34 AM
Hello !
I've done some research with links in this post.
When i look at this :
Backbone_1_2_3#sh mls qos queue-set
Queueset: 1
Queue : 1 2 3 4
----------------------------------------------
buffers : 25 25 25 25
threshold1: 100 200 100 100
threshold2: 100 200 100 100
reserved : 50 50 50 50
maximum : 400 400 400 400
Queueset: 2
Queue : 1 2 3 4
----------------------------------------------
buffers : 25 25 25 25
threshold1: 100 200 100 100
threshold2: 100 200 100 100
reserved : 50 50 50 50
maximum : 400 400 400 400
If my understanding is right, i actually have 25% buffer allocation per Queue.
And when i look at a port where i'm having drops :
output queues enqueued:
queue: threshold1 threshold2 threshold3
-----------------------------------------------
queue 0: 0 0 0
queue 1: 267214 1687058 1342319
queue 2: 0 0 0
queue 3: 0 0 1289577031
output queues dropped:
queue: threshold1 threshold2 threshold3
-----------------------------------------------
queue 0: 0 0 0
queue 1: 0 0 0
queue 2: 0 0 0
queue 3: 0 0 466509
I'm having drops on Queue 3. First question is :
is "Queue 4" in the "show mls queue-set" equal to the "Queue 3" in the "sh mls qos interface" ?
Again, if i'm not wrong, using the command u gave me (mls qos queue-set output 1 buffers 99 1 0 0) will allocate 99% of the buffer for Queue 1, 1% for Queue 2, and 0% for the rest.
So if i do that, it will be even worse no ?
Not saying you gave me bad infos, just trying to understand how it works ;)
Discover and save your favorite ideas. Come back to expert answers, step-by-step guides, recent topics, and more.
New here? Get started with these tips. How to use Community New member guide
