- Cisco Community
- Technology and Support
- Networking
- Routing
- Re: Unable to see packet drops on GRE tunnels in Segment Routing enabled-node.
- Subscribe to RSS Feed
- Mark Topic as New
- Mark Topic as Read
- Float this Topic for Current User
- Bookmark
- Subscribe
- Mute
- Printer Friendly Page
Unable to see packet drops on GRE tunnels in Segment Routing enabled-node.
- Mark as New
- Bookmark
- Subscribe
- Mute
- Subscribe to RSS Feed
- Permalink
- Report Inappropriate Content
09-23-2019 09:10 AM
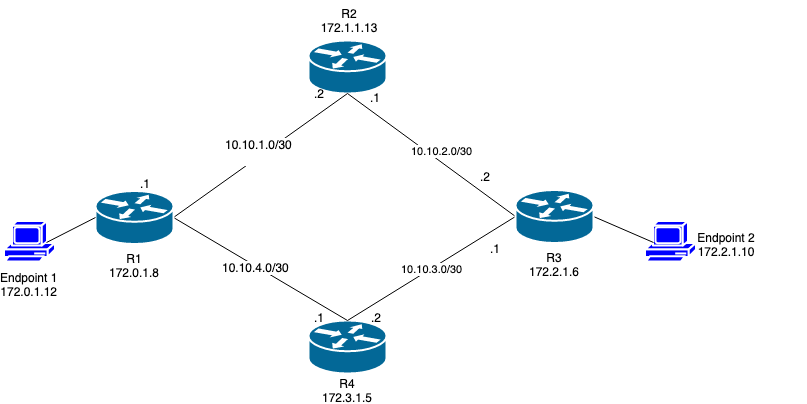
I have the following topology set on AWS where there are 4 CSR 1000v Routers deployed and Segment Routing enabled in which the Segment Routing Headend is R1 and the destination is R3.
I aim to send perf traffic from Endpoint1(Client) to Endpoint2 (Server) with the following:
SR path = { R1, R2, R3, R4, R3, R2, R1, R2, and R3 }.
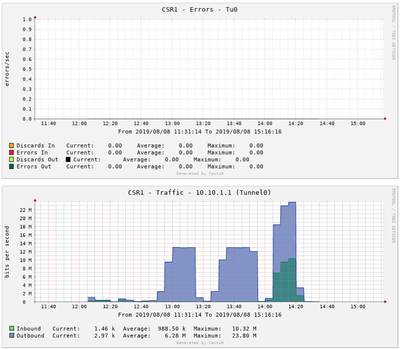
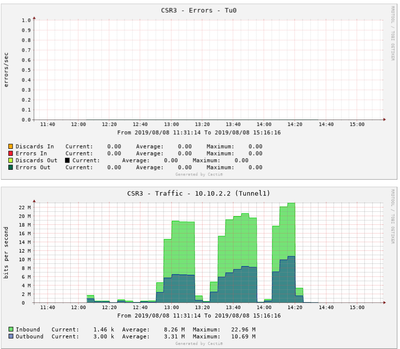
First of all, the traffic generated by iperf from Endpoint1 a linearly increasing UDP traffic until I stop manually. Using SNMP and Cacti I could get throughput across the links (GRE Tunnels) which are summarized below.
I set all tunnels' bandwidth as 10Mbps , I was expecting to see packet loss but I didn't. It is obvious from the plots that the throughput has exceeded the tunnels' bandwidth. However, no packet loss is recorded.
here's the tunnels' configuration:
interface Tunnel0
bandwidth 10000
tunnel bandwidth transmit 10000
tunnel bandwidth receive 10000
ip address 10.10.2.1 255.255.255.252
ip router isis aws
load-interval 30
mpls traffic-eng tunnels
keepalive 2 3
tunnel source GigabitEthernet1
tunnel destination 52.27.173.12
tunnel path-mtu-discovery
isis metric 1
After such gib amount of traffic, the `txload` is reached the overload which supposed to happen seeing drops on the tunnel. However, there are no losses `0 output errors`.
ip-172-1-1-13#sh int t0
Tunnel0 is up, line protocol is up
Hardware is Tunnel
Internet address is 10.10.2.1/30
MTU 9976 bytes, BW 10000 Kbit/sec, DLY 50000 usec,
reliability 255/255, txload 255/255, rxload 200/255
Encapsulation TUNNEL, loopback not set
Keepalive set (2 sec), retries 3
Tunnel linestate evaluation up
Tunnel source 172.1.1.13 (GigabitEthernet1), destination 52.38.167.137
Tunnel Subblocks:
src-track:
Tunnel0 source tracking subblock associated with GigabitEthernet1
Set of tunnels with source GigabitEthernet1, 2 members (includes iterators), on interface <OK>
Tunnel protocol/transport GRE/IP
Key disabled, sequencing disabled
Checksumming of packets disabled
Tunnel TTL 255, Fast tunneling enabled
Path MTU Discovery, ager 10 mins, min MTU 92
Tunnel transport MTU 1476 bytes
Tunnel transmit bandwidth 10000 (kbps)
Tunnel receive bandwidth 10000 (kbps)
Last input 00:00:05, output 00:00:00, output hang never
Last clearing of "show interface" counters 01:18:49
Input queue: 0/375/0/0 (size/max/drops/flushes); Total output drops: 0
Queueing strategy: fifo
Output queue: 0/0 (size/max)
30 second input rate 32000 bits/sec, 5 packets/sec
30 second output rate 59000 bits/sec, 8 packets/sec
1221047 packets input, 936187461 bytes, 0 no buffer
Received 0 broadcasts (0 IP multicasts)
0 runts, 0 giants, 0 throttles
0 input errors, 0 CRC, 0 frame, 0 overrun, 0 ignored, 0 abort
2938865 packets output, 2309121792 bytes, 0 underruns
0 output errors, 0 collisions, 0 interface resets
0 unknown protocol drops
0 output buffer failures, 0 output buffers swapped out
I tried to configure a Policing bandwidth on the interface's tunnel which is the following:
policy-map police
 description Police above 10 Mbps
  class class-default
    police cir 10000 conform-action transmit exceed-action drop
!
interface Tunnel0
 service-policy output police
!
interface Tunnel1
  service-policy output police
!
and have it enabled on the tunnels interfaces ` service-policy input police`.
The problem I am facing is that, I could see drops on the tunnels, but those drops are recorded even before the tunnels reach the maximum throughput which is defined as 10Mb which is around 2-3Mbps as maximum throughput. I really don't understand why the policy-map is dropping. I want to policy map to drop packet when exactly/above the throughput is 10Mbps.
Is there any way to see drops without using policy-map? Or another way to fix the problem.
- Mark as New
- Bookmark
- Subscribe
- Mute
- Subscribe to RSS Feed
- Permalink
- Report Inappropriate Content
09-24-2019 02:30 AM
Any ideas?
- Mark as New
- Bookmark
- Subscribe
- Mute
- Subscribe to RSS Feed
- Permalink
- Report Inappropriate Content
09-24-2019 03:19 AM - edited 09-24-2019 03:26 AM
Hi,
The "bandwidth" statement does not actively affect the traffic throughput capability of the tunnel interface- tunnel traffic throughput is limited only by CPU traffic processing capability (if tunnel processing is not being performed in HW- usually not a limitation on most cisco routers unless this is being performed at scale) and the physical interface forwarding hardware. The only exception would be if BW-based QoS policies applied.
And Share an output:
Show policy-map police
Deepak Kumar,
Don't forget to vote and accept the solution if this comment will help you!
- Mark as New
- Bookmark
- Subscribe
- Mute
- Subscribe to RSS Feed
- Permalink
- Report Inappropriate Content
09-24-2019 05:21 AM
Thanks for the reply Kumar,
ip-172-0-1-8#Show policy-map police
  Policy Map police
    Class class-default
     police cir 10000000 bc 312500
       conform-action transmit
       exceed-action drop
Even after sending 6501kbps traffic, I got some drops on the tunnel where the load was 8785kbps on the tunnel as well
ip-172-1-1-13#sh policy-map int t0
 Tunnel0

  Service-policy output: police

    Class-map: class-default (match-any)
      99869 packets, 78539772 bytes
      30 second offered rate 8018000 bps, drop rate 51000 bps
      Match: any
      police:
          cir 10000000 bps, bc 312500 bytes
        conformed 99191 packets, 77720512 bytes; actions:
          transmit
        exceeded 678 packets, 819260 bytes; actions:
          drop
        conformed 7967000 bps, exceeded 51000 bps
I'm applying this policy-map on all the tunnels' interfaces for all 4 routers.
- Mark as New
- Bookmark
- Subscribe
- Mute
- Subscribe to RSS Feed
- Permalink
- Report Inappropriate Content
09-24-2019 05:54 AM
Hi,
I think this is happening due to BC value in the default configuration. Try with increase the value and here is the guide:
I am also checking in my LAB.
Deepak Kumar,
Don't forget to vote and accept the solution if this comment will help you!
Discover and save your favorite ideas. Come back to expert answers, step-by-step guides, recent topics, and more.
New here? Get started with these tips. How to use Community New member guide


