- Cisco Community
- Technology and Support
- Security
- Security Knowledge Base
- ASA: Using Packet Capture to troubleshoot ASA Firewall : Configuration and Scenario's
- Subscribe to RSS Feed
- Mark as New
- Mark as Read
- Bookmark
- Subscribe
- Printer Friendly Page
- Report Inappropriate Content
- Subscribe to RSS Feed
- Mark as New
- Mark as Read
- Bookmark
- Subscribe
- Printer Friendly Page
- Report Inappropriate Content
08-07-2011 05:10 AM - edited 03-08-2019 06:42 PM
What are Packet Captures - A Brief Introduction to Packet Captures
Packet capture is a activity of capturing data packets crossing networking devices
There are 2 types - Partial packet capture and Deep packet capture
Partial packet capture just record headers without recording content of datagrams, used for basic troubleshooting upto L4
Deep packet capture will give us everything that a packet can tell, doing a deep packet analysis is like investigating in a forensic lab,
it is used in advanced troubleshooting like troubleshooting at L7, troubleshooting for performance related issues, traffic patterns etc
There are 2 ways of looking at traffic coming to any device, either collect captures on the ingress of the device or collect captures on the egress interface of the device behind the device in question
It might be sometimes necessary to collect captures on the egress interface, for example in case our device is dropping packets even before it is processing it or if we have to collect captures for large data as captures on some devices are limited by buffer size
Collecting captures on ASA
You can enable captures on ASA either from CLI or from ASDM
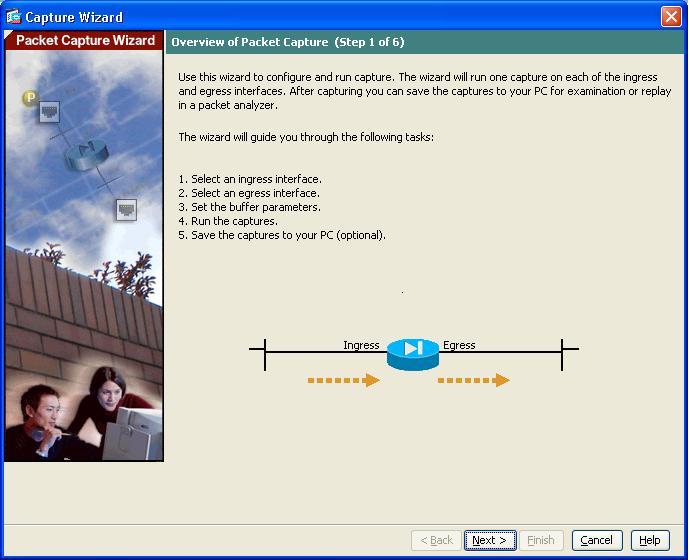
Enable captures on ASDM
Go to wizards and select packet capture wizard, it will take you through 6 simple self explanatory steps, once done with captures select save captures. This has been illustrated in Scenario 1
Enable captures in CLI
This is the syntax to apply capture
capture <name of capture>
These are the options available
| access-list | Capture packets that match access-list, when you specify access-list make sure that you specify the traffic in both direction if you want to capture bi-directional traffic |
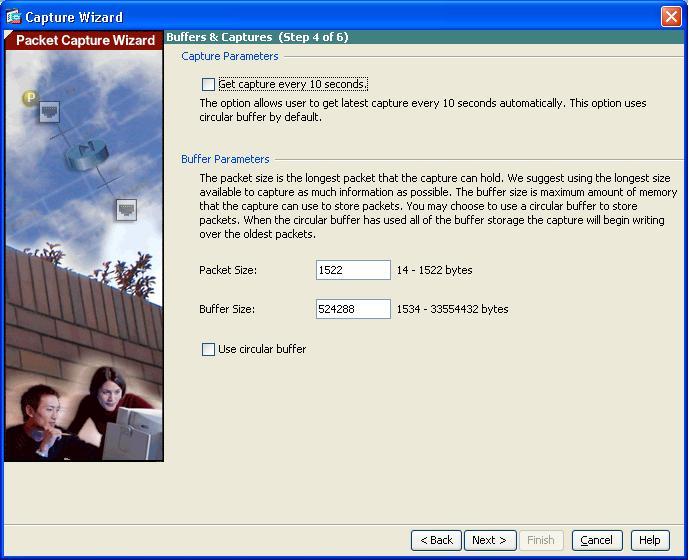
buffer | Default is 512 KB and you can configure it upto 32 MB, you do not need to change this in most cases. Just a note of caution - applying captures will add to memory utilization so keep an eye on memory before enabling captures with max buffer |
circular-buffer | Overwrite buffer from beginning when full, default is non-circular |
ethernet-type | EtherType is a two-octet field in an Ethernet frame. It is used to indicate which protocol is encapsulated in the PayLoad of an Ethernet Frame. Default is IP Here is link for iana assigned ethernet type numbers http://www.iana.org/assignments/ethernet-numbers |
headers-only | Capture only L2, L3 and L4 headers of packet without data in them, useful for collecting partial packet capture |
interface | Used to specify the interface on which you want to apply the capture |
match | Capture packets matching five-tuple - 5 tuple consists of -> Type of protocol - eg ip, gre, esp, icmp etc> -> Source Destination IP -> and other specific detail related to type of protocol specified for example in case of tcp it would be src dst port or in case of icmp it would be icmp type (optional) |
packet-length | Defines maximum length of each packet to capture, default is 1518 bytes which is the mtu in most cases, maximum is 9216 bytes |
real-time | Display captured packets in real-time. Warning: using this option with a slow console connection may result in an excessive amount of non-displayed packets due to performance limitations. This is very rarely useful |
trace | This keyword enables you to check the output of packet tracer for each packet, note that this will show packet tracer output only for inbound packets. This is useful in cases when you want to check the various checks in firewall for consecutive packets as the normal packet tracer command will always show you output for new connection check the view packet capture section to learn how to check the trace output. |
type | These are the various option available here
asp-drop Capture packets dropped with a particular reason isakmp Capture encrypted and decrypted ISAKMP payloads raw-data Capture inbound and outbound packets on one or more interfaces tls-proxy Capture decrypted inbound and outbound data from TLS Proxy on one or more interfaces webvpn Capture WebVPN transactions for a specified user
You need to know what you are looking for when you want to collect these captures, for example asp drop captures might generate lot of output so unless you dont know what kind of drop you are looking for you might end up looking at lot of packets |
Example of capture
capture capin interface inside match ip host 1.1.1.1 host 2.2.2.2 ----> this will use defaults for other parameters
Viewing captures
You can view captures in 2 ways view it on CLI/ASDM or in other words view it on the device itself or you can view it on a packet analyser after exporting it in pcap form
Let us examine each of them closely
Viewing it on the device itself
You can watch the captures in real time when you enable it on asdm or you can watch it real time when you enable capture on cli using the option "real-time" (not really recommended as it may lead to excessive amount of non displayed packets in some cases)
Once you are done with capturing you can view them by issueing the command show capture <capname> this will display minimum information - src dst ip, src dst port, timestamp and ethertype
You can view some more information by using the extended form of show cap <capname>
show cap <capname> <one of the keywords below>
| access-list | Display packets matching access-list |
| count | Display <number> of packets in capture - lets you display specified number of packets |
| detail | Display more information for each packet - like src dst mac address, ttl, ip id - this has been illustrated in Scenario 1 |
| dump | Display hex dump for each packet - shows datagram in hex |
| packet-number | Display packet <number> in capture - lets you view captures starting from a specified packet number |
| trace | Display extended trace information for each packet - used if capture is set using the trace keyword as mentioned above, this will show the output of packet tracer for each packet in the inbound direction |
Viewing it on a packet anaylser tool
You can export these captures and save them on your PC and view it using a packet anaylser tool like wireshark (open source tool available for free on internet). there are 2 ways of doing this
Export via https
For this you need to enable http server on your ASA and you need to know the credentials used to access asa via asdm (default is no username no password)
Comamnds to enable http server
asa#config t asa(config)# http server enable asa(config)# crypto key generate rsa modulus 1024
Note: This is for creating keys because we communicate with asa via https, if you have ssh access you probably have these keys |
Once you have enabled http server on asa go to your browser and give the following in the url field
https://<ip address of asa>/capture/<capname>/pcap
if it is in multiple context mode you have to specify the context
https://<ip address of asa>/capture/<context name>/<capname>/pcap
After you enter this you will be prompted for username password and once you enter that the captures are stored on your PC and you can open them in a packet anaylser tool
Export via copy command
copy /pcap capture:
| disk |
| flash |
| ftp |
| smb |
| system |
| tftp |
As metioned before in some cases you might need to capture packets on devices directly connected to asa and in most cases it is a switch connected to ASA and in such cases you can also span the switchport to collect captures
Here is a link which will help you setup a span on your catalyst switch
Once done always make sure that you remove the captures using the command
no capture <capname>
Troubleshooting simple scenario's using packet capture
Scenario - 1 - Basic Connectivity
To verify if ASA is dropping any packet - simple connectivity issues
Topology:
So here we nat all users to interface ip
Commands to capture traffic
Inside:
access-list capi extended permit ip host 192.168.1.2 host 4.2.2.2 access-list capi extended permit ip host 4.2.2.2 host 192.168.1.2 capture capin interface inside access-list capi
Or
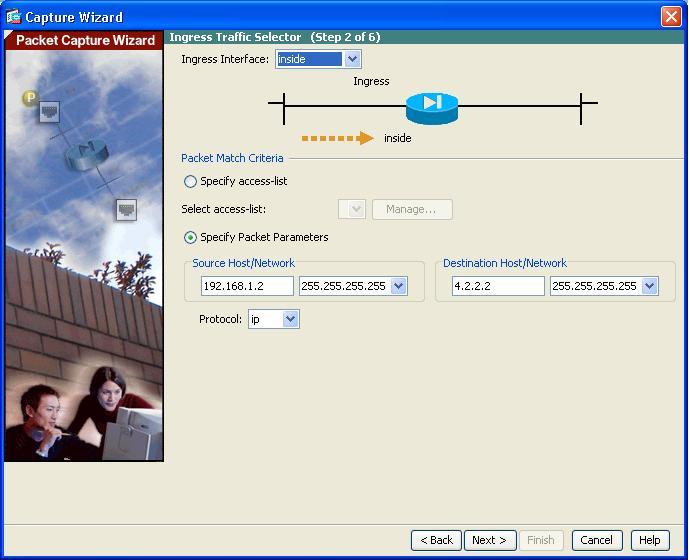
capture capin interface inside match ip host 192.168.1.2 host 4.2.2.2
[this is possible in asa 8.0 and above and we do not need to be in config mode to put apply an capture]
Outside:
access-list capo extended permit ip host a.b.c.d host 4.2.2.2 access-list capo extended permit ip host 4.2.2.2 host a.b.c.d capture capout interface outside access-list capo
Or
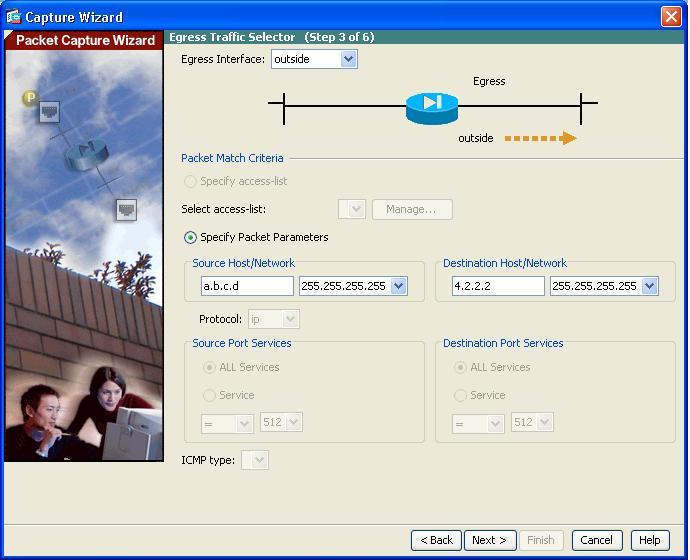
capture capout interface outside match ip host a.b.c.d host 4.2.2.2
[Note that we are using the natted ip - so for capture use the ip addresses that you expect to see on the wire after all processing is done for egress interface and before any processing is done for ingress interface] |
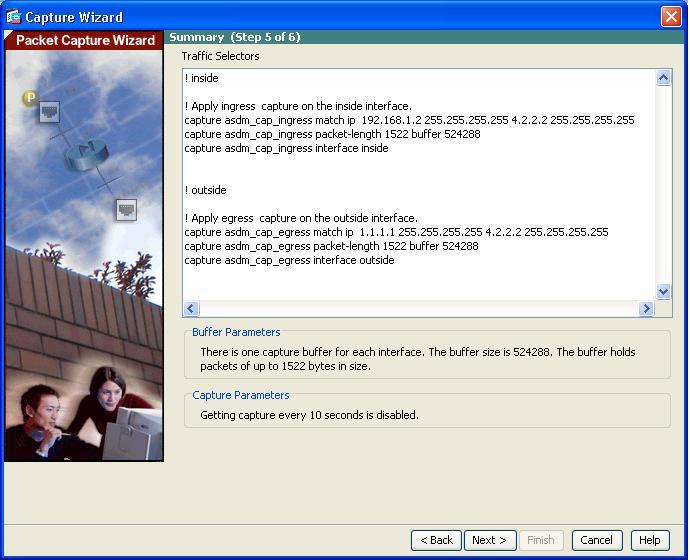
We can also apply capture using ASDM and the below screen shots show the steps for that

Ping from 192.168.1.2 to 4.2.2.2
Pings Succed
show capture capin
192.168.1.2> 4.2.2.2: icmp: echo request 4.2.2.2 > 192.168.1.2: icmp: echo reply 192.168.1.2 > 4.2.2.2: icmp: echo request 4.2.2.2 > 192.168.1.2: icmp: echo reply
show capture capout
a.b.c.d> 4.2.2.2: icmp: echo request 4.2.2.2 > a.b.c.d: icmp: echo reply a.b.c.d > 4.2.2.2: icmp: echo request 4.2.2.2 > a.b.c.d: icmp: echo reply
So you can see we have captured bidirectional traffic
If you want to see more details you can use the detailed keyword at the end
show capture capin detail
000c.29d6.7dca 0026.0b09.420c 0x0800 74: 192.168.1.2 > 4.2.2.2: icmp: echo request (ttl 128, id 52241) 0026.0b09.420c 000c.29d6.7dca 0x0800 74: 4.2.2.2 > 192.168.1.2: icmp: echo reply (ttl 127, id 16992) 000c.29d6.7dca 0026.0b09.420c 0x0800 74: 192.168.1.2 > 4.2.2.2: icmp: echo request (ttl 128, id 52242) 0026.0b09.420c 000c.29d6.7dca 0x0800 74: 4.2.2.2 > 192.168.1.2: icmp: echo reply (ttl 127, id 16993) 000c.29d6.7dca 0026.0b09.420c 0x0800 74: 192.168.1.2 > 4.2.2.2: icmp: echo request (ttl 128, id 52243) 0026.0b09.420c 000c.29d6.7dca 0x0800 74: 4.2.2.2 > 192.168.1.2: icmp: echo reply (ttl 127, id 17008) 000c.29d6.7dca 0026.0b09.420c 0x0800 74: 192.168.1.2 > 4.2.2.2: icmp: echo request (ttl 128, id 52244) 0026.0b09.420c 000c.29d6.7dca 0x0800 74: 4.2.2.2 > 192.168.1.2: icmp: echo reply (ttl 127, id 17251)
show capture capout detail
0026.0b09.420d 0022.556d.f140 0x0800 74: a.b.c.d > 4.2.2.2: icmp: echo request (ttl 128, id 52241) 0022.556d.f140 0026.0b09.420d 0x0800 74: 4.2.2.2 > a.b.c.d: icmp: echo reply (ttl 127, id 16992) 0026.0b09.420d 0022.556d.f140 0x0800 74: a.b.c.d > 4.2.2.2: icmp: echo request (ttl 128, id 52242) 0022.556d.f140 0026.0b09.420d 0x0800 74: 4.2.2.2 > a.b.c.d: icmp: echo reply (ttl 127, id 16993) 0026.0b09.420d 0022.556d.f140 0x0800 74: a.b.c.d > 4.2.2.2: icmp: echo request (ttl 128, id 52243) 0022.556d.f140 0026.0b09.420d 0x0800 74: 4.2.2.2 > a.b.c.d: icmp: echo reply (ttl 127, id 17008) 0026.0b09.420d 0022.556d.f140 0x0800 74: a.b.c.d > 4.2.2.2: icmp: echo request (ttl 128, id 52244) 0022.556d.f140 0026.0b09.420d 0x0800 74: 4.2.2.2 > a.b.c.d: icmp: echo reply (ttl 127, id 17251)
You can see we have some additonal information here like mac address, ip id, ttl etc.
TIP: For basic connectivity issues always check the following
-> interface access-list -> nat rules -> if pings are not working check for
inspect icmp -> Check if you have this in the policy-map, you can either add this or explicitly add acl's to permit icmp packets in access-lists on the lower security level interfaces
icmp deny any outside -> check if you have any deny statements like this, this statement means that we deny any icmp traffic on outisde interface
Once you have checked the above use packet tracer and packet capture to isolate the issue further |
Scenario - 2 - ICMP works but TCP traffic does not work
Users report that they can ping a particular server but cannot access any TCP services on it
Topology:
This is a typical case of asymmetric routing were users complain that they can ping the server but cannot access it on any of the tcp services
Lets see how captures help us in such scenarios
Commands to capture traffic
Inside:
access-list capi extended permit ip host 192.168.1.2 host x.x.x.x access-list capi extended permit ip host x.x.x.x host 192.168.1.2 capture capin interface inside access-list capi
Or
capture capin interface inside match ip host 192.168.1.2 host x.x.x.x
[this is possible in asa 8.0 and above and we do not need to be in config mode to put apply an capture]
Outside:
access-list capo extended permit ip host a.b.c.d host x.x.x.x access-list capo extended permit ip host x.x.x.x host a.b.c.d capture capout interface outside access-list capo
Or
capture capout interface outside match ip host a.b.c.d host x.x.x.x
[Note that we are using the natted ip - so for capture use the ip addresses that you expect to see on the wire after all processing is done for egress interface and before any processing is done for ingress interface] |
When the user tries to browse a webpage on this server
Capture Outputs
show cap capin
192.168.1.2.58458 > x.x.x.x.80: S 2331481362:2331481362(0) win 5840 <mss 1460,sackOK,timestamp 2359730964 0,nop,wscale 7>
192.168.1.2.58458 > x.x.x.x.80: . ack 712296789 win 5840
show cap capout
a.b.c.d .58458 > x.x.x.x.80: S 126872520:126872520(0) win 5840 <mss 1380,sackOK,timestamp 2359730964 0,nop,wscale 7>
Captures on client
192.168.1.2.58458 > x.x.x.x.80: S 2331481362:2331481362(0) win 5840 <mss 1460,sackOK,timestamp 2359730964 0,nop,wscale 7>
192.168.1.2.58458 > x.x.x.x.80: S 126872520:126872520(0) win 5840 <mss 1380,sackOK,timestamp 2359730964 0,nop,wscale 7>
192.168.1.2.58458 > x.x.x.x.80: . ack 712296789 win 5840
So as you can see the ASA just saw one side of traffic and dropped the ack from the client to the server becuase it did not see the syn-ack go to the client
So this suggests that there is asymmetric routing
Solution:
Correct this assymetric routing and make sure that ASA see's both sides of traffic. For any security appliance performing tcp checks it is important that it see's both sides of traffic. Sometimes it is unavoidable and we have to live with asymmetric routing in that case we can configure tcp state bypass for this traffic (you need to run asa version 8.2.1 and later )
http://www.cisco.com/en/US/products/ps6120/products_configuration_example09186a0080b2d922.shtml |
Scenario - 3 - Capture Backplane traffic to troubleshoot module related issues
Some times you might need to capture backplane captures hwen troubleshooting module related issues
Here is the command to enable backplane captures on dataplane
capture <capname> interface asa_dataplane
Some scenario's where these could be useful
-> Some websites not accesible when traffic passes through csc module
-> If dataplane communication issue is reported in the logs
Here is the command to enable backplane captures on control plane
capture <capname> interface cplane
We will need control plane captures to troubleshoot issues related to communication between asa and module
If the issue is one of the above it will be helpful to attach the captures while opening a TAC case
Scenario - 4 - VPN troubleshooting using captures
A variety of VPN issues can be troubleshooted using packet captures. Packet captures are easy to read and understand if we know what exactly we need to capture. As far as VPN is concered we are mainly concerned about the traffic between peer IP's on the internet facing side and traffic between internal subnets on the internal side.
You can capture the traffic in the same way as explained in the previous sections, the intention on this section is to give an idea on what captures to apply for specific issues
Lan to Lan Tunnel (Site to Site)
- Tunnel not coming UP, show crypto isakmp sa does not show up anything on either sides
- There is something wrong in the config the tunnel was never initiated
- Tunnel not coming UP, show crypto isakmp sa shows that tunnel is initited on one of the side but on the responder nothing shows up in this output
- The phase one for IPSEC VPN uses udp 500 so apply captures for this on both sides and verify that you are actually getting the packets on the responder side. If you dont receive the packets something in the way is blokcing these packets. Check if you have the required ports open on the upstream devices and check with both of the ISP's if they have the required ports open, if you receive the packets and still nothing shows up its probably a configuration issue check configuration
- Tunnel is UP, show crypto isakmp sa shows that the tunnel is up (state is MM_ACTIVE on ASA and QM_IDLE on Router) but you are unable to pass any traffic between the 2 sites
- Apply captures between the peer ip's and check that there is 2 way traffic for ip protocol 50 or 51 (ESP or AH depending on what you are using). Again as before if you see packets leaving one side and not reaching the other check upstrean devices and check with both the ISP's
- If you see 2 way traffic for ESP or AH check if you see encap's/decap's in the output of show crypto ipsec sa, if you don't see incremtns then you might want to apply captures to check if we are sending and receiving packets for the traffic between the 2 subnets
- If any of the device is behind a nat device and nat traversal is enabled you will capture packets for udp 4500 instead of ESP or AH
Remote Access VPN
- Most of the above is applicable to this as well, just one addition and that is sometimes we might use tcp 10000 for phase 2, so as i said before it is very important to know what traffic we are trying to capture in order to make troubleshooting easy using packet capture
- Mark as Read
- Mark as New
- Bookmark
- Permalink
- Report Inappropriate Content
Thank you very much
- Mark as Read
- Mark as New
- Bookmark
- Permalink
- Report Inappropriate Content
Excellent article.
- Mark as Read
- Mark as New
- Bookmark
- Permalink
- Report Inappropriate Content
Such an awesome article!!!!! Really good. However can you give us similar troubleshooting on either Cisoc wsa or esa.
Thanks
Kwabena
- Mark as Read
- Mark as New
- Bookmark
- Permalink
- Report Inappropriate Content
Hi Kwabena,
I am glad you found this article useful. Unfortunately I am not well versed with Cisco WSA or ESA so not sure how much I can help here. I found 2 articles see if they help
http://www.cisco.com/c/en/us/support/docs/security/email-security-appliance/117843-qanda-csa-00.html
http://www.cisco.com/c/en/us/support/docs/security/email-security-appliance/117797-technote-esa-00.html
If you need more information, there is a separate board for ESA/WSA, may be you could post there and somebody more knowledgeable may be able to assist you
- Mark as Read
- Mark as New
- Bookmark
- Permalink
- Report Inappropriate Content
Thanks Jitendriya, I think this helps too, will dig for more info.
- Mark as Read
- Mark as New
- Bookmark
- Permalink
- Report Inappropriate Content
Thank you very much!! it´s excellent!
- Mark as Read
- Mark as New
- Bookmark
- Permalink
- Report Inappropriate Content
Thanks alot , it was very helpfull
- Mark as Read
- Mark as New
- Bookmark
- Permalink
- Report Inappropriate Content
Please is they any tool that can generate a report on my Pcap from a Cisco ASA
- Mark as Read
- Mark as New
- Bookmark
- Permalink
- Report Inappropriate Content
Very nice Article. Thank you.
- Mark as Read
- Mark as New
- Bookmark
- Permalink
- Report Inappropriate Content
Nice!!
Find answers to your questions by entering keywords or phrases in the Search bar above. New here? Use these resources to familiarize yourself with the community: