- Cisco Community
- Technology and Support
- Security
- Security Knowledge Base
- Information to Acquire for DAP Troubleshooting
- Subscribe to RSS Feed
- Mark as New
- Mark as Read
- Bookmark
- Subscribe
- Printer Friendly Page
- Report Inappropriate Content
- Subscribe to RSS Feed
- Mark as New
- Mark as Read
- Bookmark
- Subscribe
- Printer Friendly Page
- Report Inappropriate Content
07-24-2014 10:34 AM - edited 08-29-2017 02:38 PM
Introduction(Purpose)
To investigate the Endpoint security behaviors using Dynamic access policies (DAP), most cases require collecting the debug information and the logs specialized for DAP.cisco.com also introduces the acquired information utilized for DAP tuning or troubleshooting, but there is no material where you can find comprehensive information. The following section introduces the summarized/categorized information generally acquired on ASA or on the client.
DAP Sequence
The DAP sequence is introduced in this material.
1. The remote client attempts to establish a VPN connection.
2. ASA executes a posture assessment using the NAC value configured and the Host Scan value of Cisco Secure Desktop.
3. ASA authenticates the user through AAA. The AAA server also returns the certificate attribute of the user.
4. ASA applies the AAA certificate attribute to that session and establishes a VPN tunnel.
5. ASA selects a DAP record based on the AAA certificate information and the posture assessment information of the session.
6. ASA aggregates DAP attributes from the DAP record selected. The aggregated attributes comprise the DAP policy.
7. ASA applies the DAP policy to the session.
With DAP + Endpoint Security, the Host Scan engine loaded onto ASA evaluates the AAA attributes and the end-point attributes applied to the corresponding VPN user in the subsequent processes after step 4 to determine if they match the DAP record defined by the administrator.
Many of the DAP-related troubles occur as events where a client connection does not match the expected DAP record. The causes include a software bug where the Host Scan engine cannot detect a certain attribute correctly and a client terminal problem where the terminal itself does not satisfy the criteria defined by DAP.
Acquiring all the following information together in the initial stage of an investigation will help us to determine where the problem is.
List of Information to Acquire
1. ASA Debugs
| Information to acquire | Description | Supplementary note |
| debug dap trace (required) | Output the trace result of the overall DAP processing. * Record the entire sequence from 5 to 7 listed above. | Most of the outputs are AAA attributes and end-point attributes detected by the Host Scan engine. For this reason, the output volume is not constant as it depends on the target client terminal. |
| debug dap error (recommended) | Output errors occurred during DAP processing. * Nothing will be recorded in most cases. | Please acquire this information just in case. |
| debug menu dap 1 (recommended) | Output DAP records in the XML format. | The same output as displaying dap.xml by the more command will be acquired. |
| debug menu dap 2 (required) | Output DAP records in the LUA format. | TAC and the development team use this for analysis. |
show running-config all dynamic-access-policy-record (recommended) | DAP settings of ASA on CLI. | Usually not required if show run or show tech is available. |
・Besides those listed above, the following information is necessary for us to understand the overall ASA settings and the equipment status. Please obtain them together.
- show tech-support output
- syslog (debugging level)
・"debug dap trace" and "debug dap error" can be output as syslog (%ASA-7-711001) by enabling the logging debug-trace.
・syslog has the output method called %ASA-7-734003, which is similar to debug dap trace. However, using debug dap trace is recommended for acquiring the output.
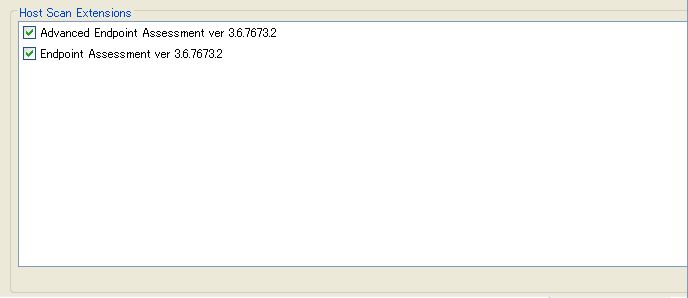
・In addition, some information is difficult to confirm unless you verify from ASDM.
Ex) Checking if Endpoint Assessment module is enabled
Configuration > Remote Access VPN > Secure Desktop Manager > Host Scan
2. Client Debugs
| Information to acquire | Description |
| DART (AnyConnect Diagnostics and Reporting Tool) log | This is a log acquisition tool used to collect overall AnyConnect connection info on the client side all at once. For the tool overview, how to obtain the tool and the installation method,please read here. |
・When you acquire DART, the Host Scan and CSD-related logs will be acquired together. However, if you perform a simulation test in order to obtain logs, go to Configuration > Remote Access VPN > Secure Desktop Manager > Global Settings on ASDM and change the logging level to Debugging in advance.
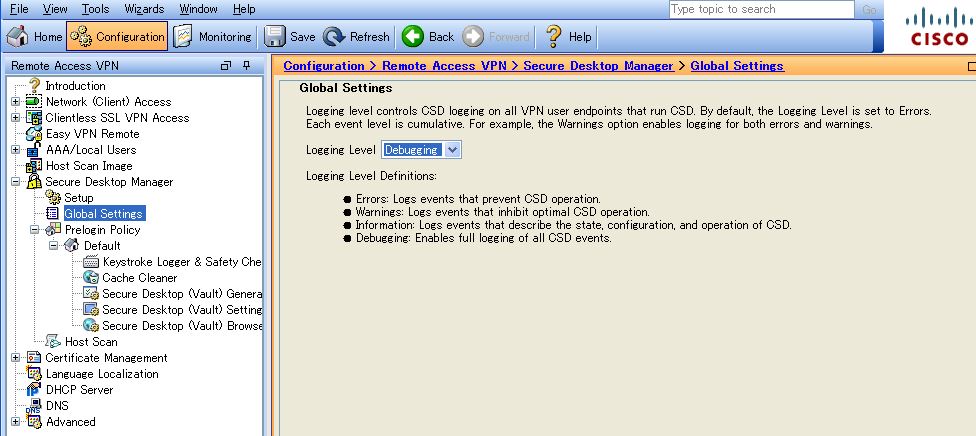
* From the first connection after changing the logging level to debugging, the logs created in the debug level will be recorded in the client.
* It gets confusing, but please note that the log output will always be recorded as [debug] regardless of whatever the logging level is.
・If you acquire logs by DART, there is no need to be conscious of where to store the file. If you need to collect Host Scan or CSD-related logs individually, refer to the file path below and acquire them directly in accordance with the operating system you are using.
CSD Log File Locations
http://www.cisco.com/en/US/docs/security/csd/csd35/configuration/guide/CSDglobe.html#wp1208960
* Although they are introduced as csd.log, csd_child.log, hostscan.log, the actual targets are cscan.log and libcsd.log located in the same file path. Try to acquire all the files in the log directory first.
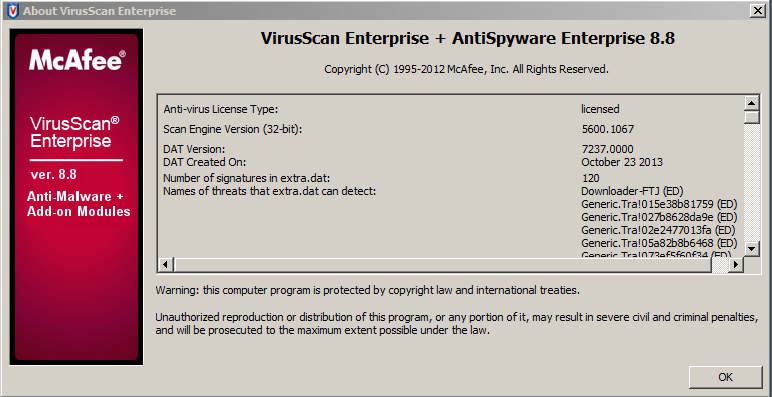
・If you contact TAC regarding a problem where the Host Scan engine does not detect certain anti-virus software or anti-spyware, their versions, or the last update as intended, provide us with information so we can confirm the criteria target of the corresponding software installed on the client, just like the following screenshot using a screen capture.
How to Check the Logs
The acquired information only shows the DAP record selected and the attribute value detected by the Host Scan engine. You cannot see which value was evaluated by the DAP record criteria at a glance. (Enhancement CSCtx83707). So, I will show you the basic reference method of the logs collected using very simple settings. Because of space limitations, it is difficult to introduce the method here, so please see the file attached.
Reference Information
・We confirmed a bug that all of the outputs will not be displayed when there are too many debug dap trace outputs. This bug has been fixed by the recent release.
CSCud57759 DAP: debug dap trace not fully shown after +1000 lines
・For compatibility of the Host Scan engine with anti-virus software, anti-spyware, and firewall, please see this material.
Related Information
Original Document: https://supportforums.cisco.com/ja/document/11937701
Author: Shinpei Kono
Posted on October 24, 2013
Find answers to your questions by entering keywords or phrases in the Search bar above. New here? Use these resources to familiarize yourself with the community: