- Cisco Community
- Technology and Support
- Service Providers
- Service Providers Knowledge Base
- ASR9000/XR: Understanding SNMP and troubleshooting
- Subscribe to RSS Feed
- Mark as New
- Mark as Read
- Bookmark
- Subscribe
- Printer Friendly Page
- Report Inappropriate Content
- Subscribe to RSS Feed
- Mark as New
- Mark as Read
- Bookmark
- Subscribe
- Printer Friendly Page
- Report Inappropriate Content
on 03-25-2013 09:43 AM
Introduction
In this document we'll be discussing the SNMP architecture as it is implemented in IOS-XR. As you can read in the IOS to XR migration guide (A starting point), some of the high level differences between IOS and XR are already being highlighted.
As IOS-XR is a highly distributed operating system and is using hardware forwarding, the way that SNMP retrieves counts and responds to requests is a bit different then what you might be used to and in this article we deep dive into the architecture of stats collection, how it operates and what show commands you can use to verify the performance of your SNMP in regards to IOS-XR and specifically for the ASR9000 (though this article also applies to CRS and GSR running IOS-XR).
XR routers are highly distributed. Increasing capacity by distribution and replication does come at a cost. In any scaled design where replication or multiplication of the processing devices is used, a critical additional component is the design is the inter process communication path between the processing components
The nature for this article originated from the fact that some of our customers have seen SNMP timeouts in XR 4.2.3 and has raised a lot of questions in regards to caching, stats collection and the way SNMP operates. Hopefully with this technote we can clear up some of the confusion.
SNMP architecture in IOS-XR
This section describes the symptoms of the problem and the main issue the document resolves.
SNMP Packet flow inside the system
Depending on your configuration SNMP packets can be received in band or out of band (as per MPP definitions, see article on LPTS and MPP for more info) and after intial reception and punting to the control plane (RSP), they are handed over to NETIO. NETIO is sort of an IP INPUT process in IOS that deals with process level switching.
IF the SNMP requests are "for me" they are handed over to the SNMP-D process for evaluation of the request and dispatch to the next layer of processing.

XR SNMP Specifics
- Informs supported as of 4.1 (Inform proxy not supported)
- Full AES Encryption support in 4.1 (V3 related)
- Full IPv6 support In 4.2 (snmp engine transport)
- VRF-aware support in 3.3 (snmp engine, some MIBs already available)
- Across Cisco capability files not well supprtoed, ASR9K MIB guide developed to improve situation
- Event/expression MIB support for extendibility as in IOS
- Warm standby on snmp agent
- Management plane protection (mpp) / snmp overload control to limit impact of snmp on device
- Standards based MIB support (IETF & IEEE)
ENTITY-MIB
IF-MIB
IP MIBs support
Routing MIBs support (BGP, OSPF, ISIS, etc)
MPLS, Pseudowire, VPLS MIBs support
IEEE 802x (LAG, CFM, OAM)
SNMP performance improvements
- Asynchronous request processing / multithreading (4.2)
- Bulk processing (dedicated processing path for bulking) (4.2)
- Data Collection Manager – bulk MIB data collection and file push (4.2.0 & 4.2.1)
- Additional IPv6 / VRF aware MIB support (4.2 and after)
- Additional improvements with Async IPC and SysDB Backend infra (4.1)
- Overload Control Integration (4.0)
SNMP request processing blocked during critical event periods (i.e. OSPF convergence)
Debugability:
- Additional PDU performance monitoring support (4.2)
- MIB guide update (4.2)
Caching
Caching is an integral part of IOS XR SNMP processing allowing it to perform at best performance while maintaining the most accurate stats possible.
There are various levels of caching and some of them are configurable, some of them are not. The reason why we cache is also to alleviate the hardware from the burden of getting continuous requests, especially in WALK scenarios retrieving many requests for eg interface stats counters.
There is a process called STATS-D which is a proc running on the linecard that periodically scrapes statistics of the linecards hardware and updates the interface counters and MIB stats.
This means that if you poll within the stats-D update time, you'd realistically see the same counter being returned twice.
Show interface commands (depending on release) will force a direct update read from hardware to get the most accurate reading, but the IF-MIB stats are cached.
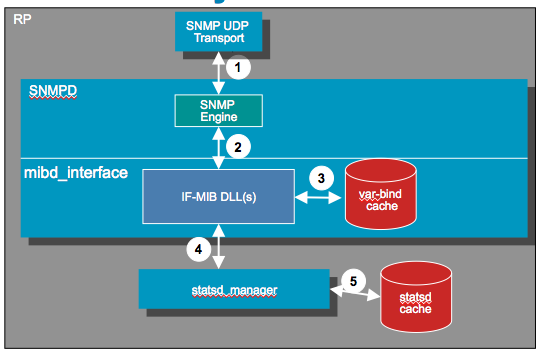
Visualizing caching differently:

Two caching mechanisms:
- Statsd caching
- Lookahead caching
1: Statsd caching:
Used for interface related statistics (IF-MIB, IF-EXTENSON-MIB, etc.)
Statsd caching is configurable (via CLI).
2: Lookahead caching:
Conceptually a varbind cache.
Not configurable.
Not all MIBs leverage/use this cache.
Statsd cache:
System maintains look ahead cache:
***Data for up to 500 interfaces kept in cache
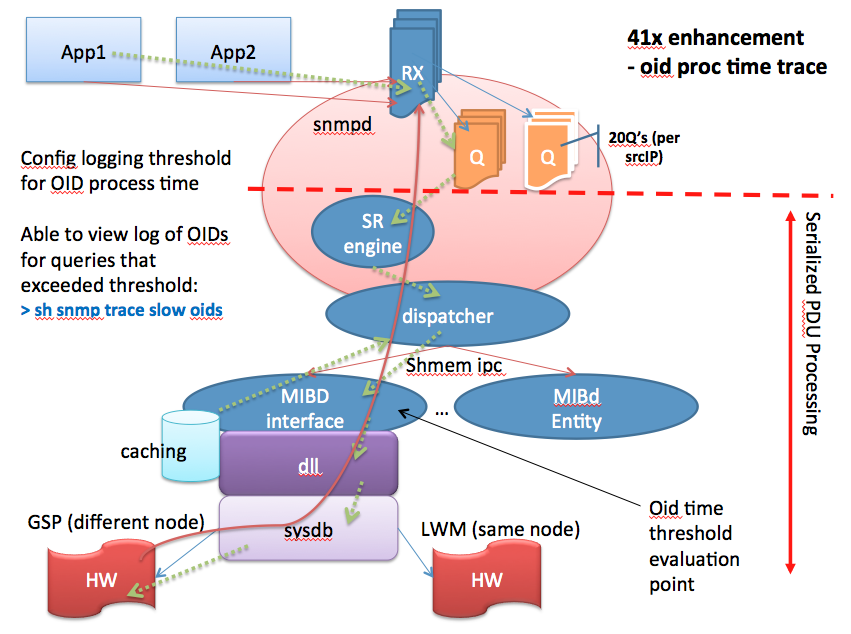
Parallel vs Serialized processing
The following picture tries to explain what the serialized processing means:
When an SNMP request is being received they are handled in a sequential manner. If one request currently in progress is "slow", subsequent requests are waiting to be handled and may time out.
The NMS station may resend its SNMP request building up the request queue potentially causing more trouble.
Now the good news is in 431 we have the ability to detect duplicate requests and throw them out of the queue making sure we're dealing only with "NEW" requests.

Enhancements in XR 4.1
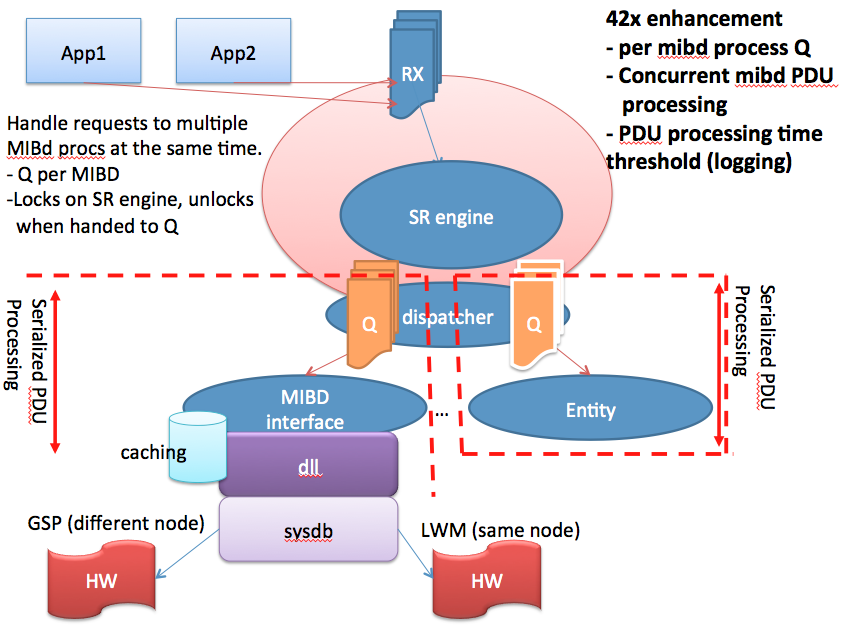
Enhancements in XR 4.2
Example (performance) trace point logging

SNMP process architecture
- All management interfaces (SNMP, XML, CLI) utilize the same core processing architecture [sysdb].
- The SNMP processing architecture serializes PDU processing (pre-4.2).
- Request PDUs for all pollers effect the response rate seen for a single poller.
- The SNMP per-OID polling rate is very MIB specific (each MIB’s underlying data model dictates the performance of MIB’s OID access)
- MIB request processing commonly involves the GSP IPC mechanism, sysDB (data store) and statsd in some cases.
- In band and out of band SNMP requests are treated the same within SNMP.
- (In band means that the SNMP request can be received on an interface that is also transporting customer/user traffic. Out of band interfaces, such as the MGMT interfaces on the RSP are dedicated for management and carry management traffic only).
- The current SNMP architecture has an SNMP daemon enqueue requests and separate MIB daemons process requests (requests are enqueued from transport layer receive fairly quickly)
- There are multiple MIB-specific caching mechanisms in place to improve performance which also complicate the polling rate calculations.
- There is no queue size limit for SNMP requests (grows with memory).
XR processes referenced
StatsD is a process that collects statistics from various places (eg hardware) and updates tables on the LC shared memory.
IPC is an inter process call or communication that is used by processes to talk to each other to request data or send commands.
GSP is group services protocol, which is a process in IOS-XR that allows for one process to communicate with multiple "nodes" at the same time (like a sort of multicast way that the RSP can use to talk to multiple linecards, for instance to update a FIB route).
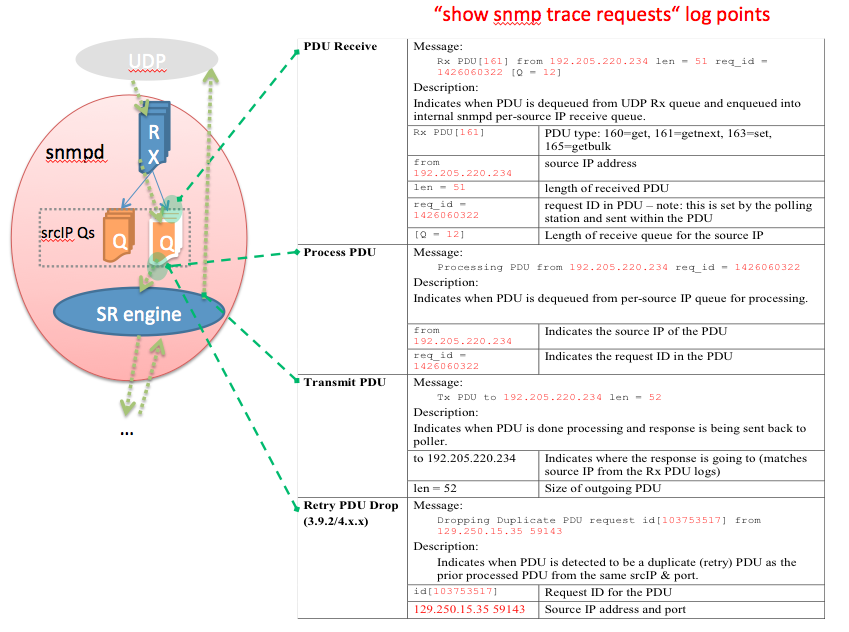
SNMP tracepoints
XR MIB implementation specifics

Troubleshooting commands and what they do
The following show and debug commands are very powerful to verify and track SNMP.
show snmp | Global agent counters—incoming, outgoing (request and trap), & error PDUs Technique: - Periodically collect output to determine overall PDU response rate and identify error rate. |
show snmp trace requests | Log of high level PDU processing tracepoints—Rx, Proc Start, Tx time Technique: Periodically collect this log. Decode and use the data to determine the following per-PDU data: 1.Source IPs of pollers 2.Queue lengths of per-source IP PDU queues 3.Types of request PDUs being used 4.Timestamp when PDUs are enqueued into the queues for the source IPs 5.Duration of the PDU enqueued & waiting to be processed 6.Processing time of PDUs from pollers |
show snmp mib access | Per-OID counters indicating the number of times an operation was done on that OID, ie. GET, GETN, SET. Technique: Periodically collecting & diff will indicate what was polled during the time periods. |
show snmp mib access time |
Per-OID timestamp of the last operation on the OID. Technique: Periodically collecting & diff will indicate if any polling on the OID was done in the time period. |
debug snmp request (careful!!!) | Enable to log every OID being processed by every PDU to syslog. Need to enable “debug snmp packet” as well to identify source of PDUs. NOTE: Disable “logging trap debug” if “snmp trap syslog” is configured!!! |
debug snmp packet (careful!!!) | Enable to log same data as “sh snmp trace requests” to syslog. NOTE: Disable “logging trap debug” if “snmp trap syslog” is configured!!! |
Show commands that are new to XR 4.2 onwards
show snmp mib statistics | Per-OID statistics summarizing transaction times within the mibd level—count + min/max/avg . Technique: Collect to determine if specific MIB objects are averaging high processing times and/or large variance (low min, high avg & max). |
show snmp queue rx | Indicates the min/max/avg queue sizes for the PDU receive and pending queues. Real-time and 5min views. |
show snmp queue trap | Indicates the min/max/avg queue sizes for the internal trap PDU queue |
(config)# snmp logging thresh oid show snmp trace slow oid | Allows configuring a duration threshold for logging per-OID transactions exceeding the time threshold. This is measured within the mibd process beginning with the call to the MIB specific handler for the OID and ending with the response from the same. |
(config)# snmp logging thresh pdu show snmp trace slow pdu |
Allows configuring a duration threshold for logging per-PDU transactions exceeding the time threshold. When logging all OIDs within the PDU are also logged to this buffer. This is measured within the snmpd process beginning with the dequeue of the PDU from the receive queue and ending when all the OIDs in the PDU have been processed and the response is ready to be sent. |
Troubleshooting PDU performance issues
Some MIBs dont have accelerated processing or dont have caching and because in certain releases SNMP is processed serially, it could happen that you'll see timeouts on OID requests that are normally operating perfectly fine. An example of a slow MIB is the SONET MIB. Because this mib needs to talk from the SNMP process all the way down to the SPA of the SIP-700 linecard (on the ASR9000), the response may not be provided in a timely manner. At the same time new requests for other OID's may be in the holding or pending queue causing timeouts and retries.
Retries to an already under performing MIB may exacerbate the overal issue.
The vast majority of PDU performance issues are related to a poller polling a specific MIB which is slow to process its OIDs.
This causes all other pollers to see some of their PDUs slowed due to queueing delays (waiting on slow MIB)
Troubleshooting Goal:
Workarounds
Use SNMP View Access Control to block access to the slow MIB tables / objects
snmp-server view MyPollView <slow MIB OID> excluded
Use ACLs to permit only “known” NMS devices/applications . In this case “known” is referring to content of requests issued from the app
Determining Internal Timeout of a MIBd
snmpd will timeout a mibd process if it has not received a response to a request for an OID/s within 10s by default.
Once in timeout state, snmpd will continue processing requests BUT it will mark the mibd as unavailable until it responds to the timed-out request.
- Getnext operations to any OIDs for MIBs in the timed out mibd will skip to the lexi-next OID owned by a different mibd process.
- Get/Set operations to any OIDs for MIBs in the timed out mibd will be responded to with a PDU error-code of “resourceUnavailable”.
Troubleshooting
(in addition to normal “slow OID” techniques):
Examples and Recommendations
For the purpose of clarification the following is an example of an snmp table. The columns (vertical) represent the instance or entity, and the rows represent the objects. In this case we have 3 instances 1, 2 and 3, and each instance has 3 objects, ifName, ifInOctets and ifMtu.
ifIndex | ifName | ifInOctets | ifMtu |
1 | Ethernet1/0 | 1234 | 1500 |
2 | POS2/0 | 512 | 500 |
3 | Serial3/0 | 235 | 600 |
The customers current snmp design is using snmpwalk. Snmpwalk works by performing a sequence of get-nexts, but on a column by column basis if the column object is specified as the starting point.
An example of a column walk specifying the ifDescr from IF-MIB
[no-sense-1 68] ~ > snmpwalk -c public 10.66.70.87 IF-MIB::ifDescr
IF-MIB::ifDescr.1 = STRING: Loopback0
IF-MIB::ifDescr.2 = STRING: Bundle-POS1
IF-MIB::ifDescr.3 = STRING: Bundle-Ether1
IF-MIB::ifDescr.4 = STRING: TenGigE1/2/0/0
IF-MIB::ifDescr.5 = STRING: TenGigE1/2/0/1
IF-MIB::ifDescr.6 = STRING: SONET0/2/0/0
IF-MIB::ifDescr.7 = STRING: SONET0/2/0/1
IF-MIB::ifDescr.8 = STRING: SONET0/2/0/2
IF-MIB::ifDescr.9 = STRING: SONET0/2/0/3
IF-MIB::ifDescr.10 = STRING: SONET0/2/0/4
<cut>
Snmpwalk can also be used to get a single object only, for instance, the object IF-MIB::ifDescr.9. It does not support the ability to specify any more than 1 object in its request. The example below shows two objects being requested, but only the first returned.
[no-sense-1 69] ~ > snmpwalk -c public 10.66.70.87 IF-MIB::ifDescr.9
IF-MIB::ifDescr.9 = STRING: SONET0/2/0/3
[12:18 - 0.31]
[no-sense-1 70] ~ > snmpwalk -c public 10.66.70.87 IF-MIB::ifDescr.9 IF-MIB::ifDescr.10
IF-MIB::ifDescr.9 = STRING: SONET0/2/0/3
[12:18 - 0.36]
For efficiency row traversal is preferred, with multiple objects requested in a single snmp transaction. This reduces unnecessary overhead on the XR system. For this reason snmpwalk is not recommended.
Examples of row traversal
The customer is currently requesting via snmpwalk the following IF-MIB objects
ifDescr
ifHCInOctets
ifHCOutOctets
ifHCInUcastPkts
ifHCOutUcastPkts
ifInNUcastPkts
ifOutNUcastPkts
ifInOctets
ifOutOctets
ifInUcastPkts
ifOutUcastPkts
The preferred method is to specify all the objects required from an instance/entity in a single command such as get-next or bulk-get. An example follows using snmpbulkget
[no-sense-1 115] ~ > snmpbulkget -v 2c -c public 10.66.70.87 IF-MIB::ifDescr IF-MIB::ifHCInOctets IF-MIB::ifHCOutOctets IF-MIB::ifHCInUcastPkts IF-MIB::ifHCOutUcastPkts IF-MIB::ifInNUcastPkts IF-MIB::ifOutNUcastPkts IF-MIB::ifInOctets IF-MIB::ifOutOctets IF-MIB::ifInUcastPkts IF-MIB::ifOutUcastPkts
IF-MIB::ifDescr.1 = STRING: Loopback0
IF-MIB::ifHCInOctets.2 = Counter64: 0
IF-MIB::ifHCOutOctets.2 = Counter64: 7116596
IF-MIB::ifHCInUcastPkts.2 = Counter64: 0
IF-MIB::ifHCOutUcastPkts.2 = Counter64: 99611
IF-MIB::ifInDiscards.2 = Counter32: 0
IF-MIB::ifOutDiscards.2 = Counter32: 0
IF-MIB::ifInOctets.2 = Counter32: 0
IF-MIB::ifOutOctets.2 = Counter32: 7116596
IF-MIB::ifInUcastPkts.2 = Counter32: 0
IF-MIB::ifOutUcastPkts.2 = Counter32: 99611
IF-MIB::ifDescr.2 = STRING: Bundle-POS1
IF-MIB::ifHCInOctets.3 = Counter64: 38796828
IF-MIB::ifHCOutOctets.3 = Counter64: 66076323
IF-MIB::ifHCInUcastPkts.3 = Counter64: 331833
IF-MIB::ifHCOutUcastPkts.3 = Counter64: 402546
IF-MIB::ifInDiscards.3 = Counter32: 0
IF-MIB::ifOutDiscards.3 = Counter32: 0
IF-MIB::ifInOctets.3 = Counter32: 38796828
IF-MIB::ifOutOctets.3 = Counter32: 66076323
IF-MIB::ifInUcastPkts.3 = Counter32: 331833
IF-MIB::ifOutUcastPkts.3 = Counter32: 402546
IF-MIB::ifDescr.3 = STRING: Bundle-Ether1
<snip>
Note above that all the objects in a row for all instances (columns) are obtained with one command. The same can be done with a get-next, however the added overhead of including the instance must be used for each instance present.
[no-sense-1 120] ~ > snmpgetnext -v 2c -c public 10.66.70.87 IF-MIB::ifDescr.1 IF-MIB::ifHCInOctets.1 IF-MIB::ifHCOutOctets.1 IF-MIB::ifHCInUcastPkts.1 IF-MIB::ifHCOutUcastPkts.1 IF-MIB::ifInNUcastPkts.1 IF-MIB::ifInOctets.1 IF-MIB::ifOutOctets.1 IF-MIB::ifInUcastPkts.1 IF-MIB::ifOutUcastPkts.1
IF-MIB::ifDescr.2 = STRING: Bundle-POS1
IF-MIB::ifHCInOctets.2 = Counter64: 0
IF-MIB::ifHCOutOctets.2 = Counter64: 7116596
IF-MIB::ifHCInUcastPkts.2 = Counter64: 0
IF-MIB::ifHCOutUcastPkts.2 = Counter64: 99611
IF-MIB::ifInDiscards.2 = Counter32: 0
IF-MIB::ifInOctets.2 = Counter32: 0
IF-MIB::ifOutOctets.2 = Counter32: 7116596
IF-MIB::ifInUcastPkts.2 = Counter32: 0
IF-MIB::ifOutUcastPkts.2 = Counter32: 99611
[13:03 - 0.35]
Although the examples are specific to IF-MIB, the same concept is relevant to all MIBs.
Timeout and Retry Setting on NMS
Timeout recommenations:
- use dynamic timeout when available
- if dynamic timeout is not available, increase timeout if more management applications are simultaneously polling the SNMP agent on asr9k. Multiply the default timeout by the number of applications that are simultaneously polling the SNMP agent on asr9k.
Retry recommendations:
- use dynamic retry when available
- if dynamic retry is not available, establish number of retries based on testing
For more details refer to IOS XR SNMP Best Practices.
Related Information
- Monitoring power supplies via SNMP, technote https://supportforums.cisco.com/docs/DOC-21667
Special thanks to the XR SNMP dev team for some of the amazing content used in this article, most notably Timothy Swanson and Leon Zachary
Xander Thuijs CCIE #6775
Principal Engineer, ASR9000
- Mark as Read
- Mark as New
- Bookmark
- Permalink
- Report Inappropriate Content
Hello Xander,
I have a problem where our NMS shows intermittent SNMP Poll failures with our 9ks. Issue occurs every couple hours or so, at seemingly irregular intervals. Polling to other IOS device types (6509, 3750, 7206) works ok. We are running XR 4.3.1.
When I try to ping the server from a 9k with a series of 10k pings I don’t see any packet loss.
Tried to explore slow oid but we don’t always have slow requests coincide with the poll fail.
'show snmp trace request' shows pdu requests with the same src ip/port and occasionally same req_id. After an SNMP poll fail if I run the command 'show snmp trace dupdrop' it reflects Dup Count increasing. Is there a way to disable on the 9k the ability to detect duplicate requests?
Regards,
Eric
- Mark as Read
- Mark as New
- Bookmark
- Permalink
- Report Inappropriate Content
hi eric,
yeah there are some perf issues in 431 that we have uncovered. although there are improvements in 431 over 423, we were not done there. So in 432 you'll see better results in especially in 434. we have put a lot of testing effort into the snmp operations and discovered/implemented many improvements. I dont know right off hand if we smu'd things in 431.
the issue you are running into is likely not network connectivity or anything but just the snmp processing inside that is the culprit.
you cant enable dupe request checking, that is one of the performance improvements, if we are alrady working on a request and getting the retry in, it would only excarbate the issue if we enqueue the same request again.
for sure enable the caching if not already, and try to stay current on the smu's pertaining to snmp.
when XR434 comes out in December consider that as a goto release if you're planning an upgrade.
regards
xander
- Mark as Read
- Mark as New
- Bookmark
- Permalink
- Report Inappropriate Content
4.3.4 doesn't solve our snmp timeout issue.
here is the strange thing - we have 4 ASR's, a mix of 4.2.3 and 4.3.4, every 30 mins or so each ASR will stop responding to snmp queries.
and not at the same time, ie at *:15 and *:45 the first ASR will stop responding, then at *:20 and *:50 the second ASR will stop responding, I am querying both ASR's from multiple clients, just incase its a client issue and the same thing occurs on both clients.
its almost like there is some sort of 30 min garbage collection timer that blocks snmp queries to IFMIB but not say the hostname mib (tested).
also I havn't confirmed this, but the more interfaces the ASR has the longer the outage, eg the 4.3.4 ASR which has maybe 100 interfaces has an snmp outage for about 1 minute, whereas the the 4.2.3 ASR has 400 interfaces seems to have a few minutes of outage time...
btw - icmp/ping to each is working properly (i have a script which runs every second, first pings and then snmpget's, the ping always works, the snmpget stops every 30 mins or so)
- Mark as Read
- Mark as New
- Bookmark
- Permalink
- Report Inappropriate Content
thanks for that notification davecs, I did not expect that in 434 where we have put a lot of improvements in place.
the "outage time to number of interfaces" seems suspicious and a resurrection of a previous problem that I thought
was fixed.
I may need to ask you to file a tac case to have this investigated in depth asap so we can identify the reasoning for this issue and address it if necessary.
regards
xander
- Mark as Read
- Mark as New
- Bookmark
- Permalink
- Report Inappropriate Content
Yeah I logged a TAC case and they told me to use "snmp-server ifmib stats cache" (and a restart of snmpd) which worked straight away on 4.3.4, but didn't work at all on the other three ASR's running 4.2.3.
BUT I just had another look and my cacti graphs started looking gappy again, and log show snmp timeouts...
Something interesting, I also graph CPU, when I initially enabled stats cache (on 4.3.4) one of the four CPU basically went idle instead of peaks every 30 mins, now that the graph has returned to "gappy mode" that CPU is back to it's 30 min peaky behaviour.
- Mark as Read
- Mark as New
- Bookmark
- Permalink
- Report Inappropriate Content
davecs,
yup leveraging the cache is key for good snmp performance.
the 30 min spikes you see, needs to be correlated to something, it could be the snmp process, it could be something else periodic.
also it may help to increase the timeout on your snmp requests, especially when long mib walks are done.
considering you have a tac case open, perhaps we can drive it through that channel, and we can report back on thsi discussion when the situation is resolved for everyone's awareness. otherwise we may be duplicating efforts potentially.
regards
xander
- Mark as Read
- Mark as New
- Bookmark
- Permalink
- Report Inappropriate Content
short answer = solarwinds topology mapping (occurs at a 30 min interval)
disable or change (ie max) the interval and it fixes the ifmib problems.
long answer = hopefully TAC/DE can work out what OID is causing snmp ifmib to hang
- Mark as Read
- Mark as New
- Bookmark
- Permalink
- Report Inappropriate Content
davecs,
We have this exact same problem; gaps in cacti graphs.
We opened a TAC case and found the policer was limiting the SNMP queries and dropping packets.
Do the following command for each location:
show lpts pifib hardware police location 0/0/CPU0
If you have drops listed for SNMP you are being policed by the default policy.
The default of 300pps on the SNMP LPTS policer was causing our drops.
We are considering increasing this from 300pps to a higher value.
Would be interested in if this is your problem as well.
You can email me off line at fmjordan@fsu.edu
Thanks, and hope this helped.
- Mark as Read
- Mark as New
- Bookmark
- Permalink
- Report Inappropriate Content
interesting and good to know about this command.
but no there are 0 drops for anything in that list
i believe the problem to be that solarwinds is trying to grab routing tables from the ASR, and perhaps the ASR is blocking on this request...
- Mark as Read
- Mark as New
- Bookmark
- Permalink
- Report Inappropriate Content
Xander,
My question about the periodic MIB data collection and transfer feature is also known as bulk statistics on asr9k. More detail about Bulk Statistics Transfer Options.
Is it possible to download the data to the server that is located in the VRF?
- Mark as Read
- Mark as New
- Bookmark
- Permalink
- Report Inappropriate Content
hi there,
the destination location is in the form of a url, and in 41 we added the vrf capability to that in this way:
ftp://<ftp-server-ip>;<vrf-name>//<pie-path >
but this was specifically for the install add, so I am not sure if this is going to work also for the snmp bulk stat url. I haven't tried it myself though.
regards
xander
- Mark as Read
- Mark as New
- Bookmark
- Permalink
- Report Inappropriate Content
Xander,
Thank you for quick reply. I tried. For snmp bulk stat url doesn't work vrf-aware mechanism. May be in future IOS XR releases will be support vrf-aware feature.
- Mark as Read
- Mark as New
- Bookmark
- Permalink
- Report Inappropriate Content
Xander,
I found with you help that it works for tftp.
url primary tftp://192.168.x.x;Mgmt/
without filename after last slash. All other combinations doesn't work for tftp.
For ftp doesn't work in any my combinations. With anonymous ftp, with authenticated ftp user, with/without filename after last slash, with "ftp client vrf Mgmt username/password".
- Mark as Read
- Mark as New
- Bookmark
- Permalink
- Report Inappropriate Content
do you see the connection attempt going out when using FTP or there is nothing happening? Looking at the ddts that provided support for that ;<vrf> it tells me this is in the base infra that takes a url input, hence should also be applicable to this CLI in question.
With that a case/ddts is probably warranted.
Also see if it makes a difference using a mgmt interface on the RSP vs a fabric enabled interface on a linecard.
thanks for the testing btw!
cheers
xander
- Mark as Read
- Mark as New
- Bookmark
- Permalink
- Report Inappropriate Content
Hi Xander,
We have a brand new ASR9K and I was wondering if we should monitor this device in the same way we do with our 6500, 4900, 7500, etc. I mean, monitor the interfaces status, drop packets counters, etc; or we should consider another important variable based on the complexity added by this kind of device. Do you have any recommendations about this you could provide me?
thanks
Abraham
Find answers to your questions by entering keywords or phrases in the Search bar above. New here? Use these resources to familiarize yourself with the community: