- Cisco Community
- Technology and Support
- Service Providers
- Service Providers Knowledge Base
- ASR9000/XR: Understanding SNMP and troubleshooting
- Subscribe to RSS Feed
- Mark as New
- Mark as Read
- Bookmark
- Subscribe
- Printer Friendly Page
- Report Inappropriate Content
- Subscribe to RSS Feed
- Mark as New
- Mark as Read
- Bookmark
- Subscribe
- Printer Friendly Page
- Report Inappropriate Content
on 03-25-2013 09:43 AM
Introduction
In this document we'll be discussing the SNMP architecture as it is implemented in IOS-XR. As you can read in the IOS to XR migration guide (A starting point), some of the high level differences between IOS and XR are already being highlighted.
As IOS-XR is a highly distributed operating system and is using hardware forwarding, the way that SNMP retrieves counts and responds to requests is a bit different then what you might be used to and in this article we deep dive into the architecture of stats collection, how it operates and what show commands you can use to verify the performance of your SNMP in regards to IOS-XR and specifically for the ASR9000 (though this article also applies to CRS and GSR running IOS-XR).
XR routers are highly distributed. Increasing capacity by distribution and replication does come at a cost. In any scaled design where replication or multiplication of the processing devices is used, a critical additional component is the design is the inter process communication path between the processing components
The nature for this article originated from the fact that some of our customers have seen SNMP timeouts in XR 4.2.3 and has raised a lot of questions in regards to caching, stats collection and the way SNMP operates. Hopefully with this technote we can clear up some of the confusion.
SNMP architecture in IOS-XR
This section describes the symptoms of the problem and the main issue the document resolves.
SNMP Packet flow inside the system
Depending on your configuration SNMP packets can be received in band or out of band (as per MPP definitions, see article on LPTS and MPP for more info) and after intial reception and punting to the control plane (RSP), they are handed over to NETIO. NETIO is sort of an IP INPUT process in IOS that deals with process level switching.
IF the SNMP requests are "for me" they are handed over to the SNMP-D process for evaluation of the request and dispatch to the next layer of processing.

XR SNMP Specifics
- Informs supported as of 4.1 (Inform proxy not supported)
- Full AES Encryption support in 4.1 (V3 related)
- Full IPv6 support In 4.2 (snmp engine transport)
- VRF-aware support in 3.3 (snmp engine, some MIBs already available)
- Across Cisco capability files not well supprtoed, ASR9K MIB guide developed to improve situation
- Event/expression MIB support for extendibility as in IOS
- Warm standby on snmp agent
- Management plane protection (mpp) / snmp overload control to limit impact of snmp on device
- Standards based MIB support (IETF & IEEE)
ENTITY-MIB
IF-MIB
IP MIBs support
Routing MIBs support (BGP, OSPF, ISIS, etc)
MPLS, Pseudowire, VPLS MIBs support
IEEE 802x (LAG, CFM, OAM)
SNMP performance improvements
- Asynchronous request processing / multithreading (4.2)
- Bulk processing (dedicated processing path for bulking) (4.2)
- Data Collection Manager – bulk MIB data collection and file push (4.2.0 & 4.2.1)
- Additional IPv6 / VRF aware MIB support (4.2 and after)
- Additional improvements with Async IPC and SysDB Backend infra (4.1)
- Overload Control Integration (4.0)
SNMP request processing blocked during critical event periods (i.e. OSPF convergence)
Debugability:
- Additional PDU performance monitoring support (4.2)
- MIB guide update (4.2)
Caching
Caching is an integral part of IOS XR SNMP processing allowing it to perform at best performance while maintaining the most accurate stats possible.
There are various levels of caching and some of them are configurable, some of them are not. The reason why we cache is also to alleviate the hardware from the burden of getting continuous requests, especially in WALK scenarios retrieving many requests for eg interface stats counters.
There is a process called STATS-D which is a proc running on the linecard that periodically scrapes statistics of the linecards hardware and updates the interface counters and MIB stats.
This means that if you poll within the stats-D update time, you'd realistically see the same counter being returned twice.
Show interface commands (depending on release) will force a direct update read from hardware to get the most accurate reading, but the IF-MIB stats are cached.
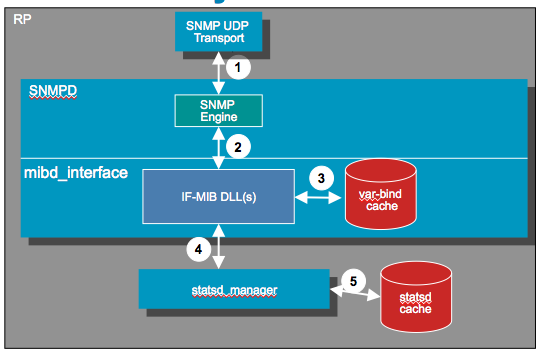
Visualizing caching differently:

Two caching mechanisms:
- Statsd caching
- Lookahead caching
1: Statsd caching:
Used for interface related statistics (IF-MIB, IF-EXTENSON-MIB, etc.)
Statsd caching is configurable (via CLI).
2: Lookahead caching:
Conceptually a varbind cache.
Not configurable.
Not all MIBs leverage/use this cache.
Statsd cache:
System maintains look ahead cache:
***Data for up to 500 interfaces kept in cache
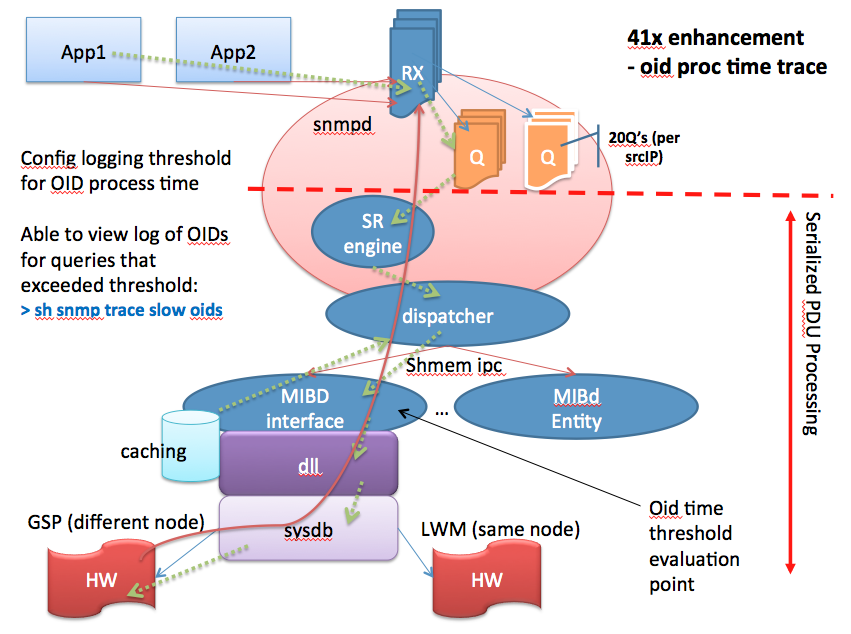
Parallel vs Serialized processing
The following picture tries to explain what the serialized processing means:
When an SNMP request is being received they are handled in a sequential manner. If one request currently in progress is "slow", subsequent requests are waiting to be handled and may time out.
The NMS station may resend its SNMP request building up the request queue potentially causing more trouble.
Now the good news is in 431 we have the ability to detect duplicate requests and throw them out of the queue making sure we're dealing only with "NEW" requests.

Enhancements in XR 4.1
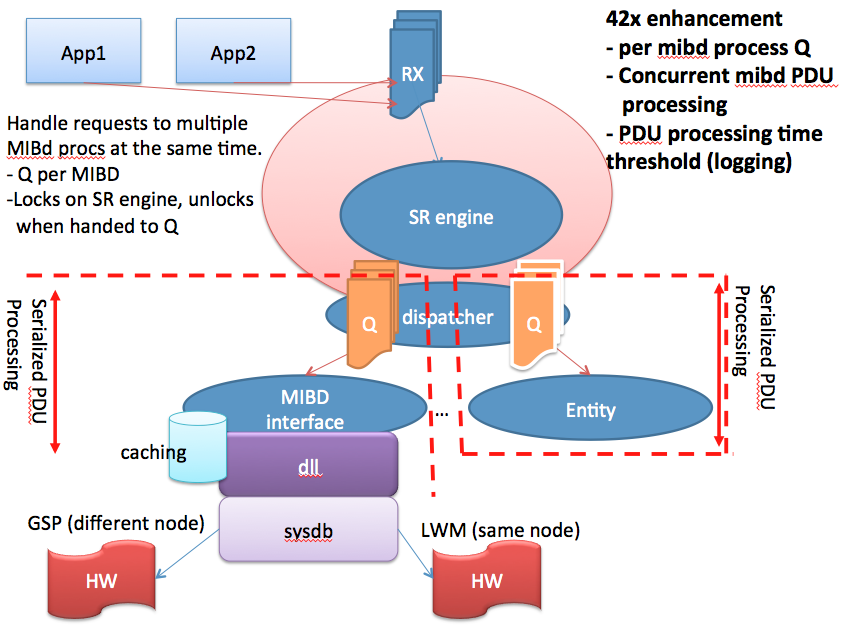
Enhancements in XR 4.2
Example (performance) trace point logging

SNMP process architecture
- All management interfaces (SNMP, XML, CLI) utilize the same core processing architecture [sysdb].
- The SNMP processing architecture serializes PDU processing (pre-4.2).
- Request PDUs for all pollers effect the response rate seen for a single poller.
- The SNMP per-OID polling rate is very MIB specific (each MIB’s underlying data model dictates the performance of MIB’s OID access)
- MIB request processing commonly involves the GSP IPC mechanism, sysDB (data store) and statsd in some cases.
- In band and out of band SNMP requests are treated the same within SNMP.
- (In band means that the SNMP request can be received on an interface that is also transporting customer/user traffic. Out of band interfaces, such as the MGMT interfaces on the RSP are dedicated for management and carry management traffic only).
- The current SNMP architecture has an SNMP daemon enqueue requests and separate MIB daemons process requests (requests are enqueued from transport layer receive fairly quickly)
- There are multiple MIB-specific caching mechanisms in place to improve performance which also complicate the polling rate calculations.
- There is no queue size limit for SNMP requests (grows with memory).
XR processes referenced
StatsD is a process that collects statistics from various places (eg hardware) and updates tables on the LC shared memory.
IPC is an inter process call or communication that is used by processes to talk to each other to request data or send commands.
GSP is group services protocol, which is a process in IOS-XR that allows for one process to communicate with multiple "nodes" at the same time (like a sort of multicast way that the RSP can use to talk to multiple linecards, for instance to update a FIB route).
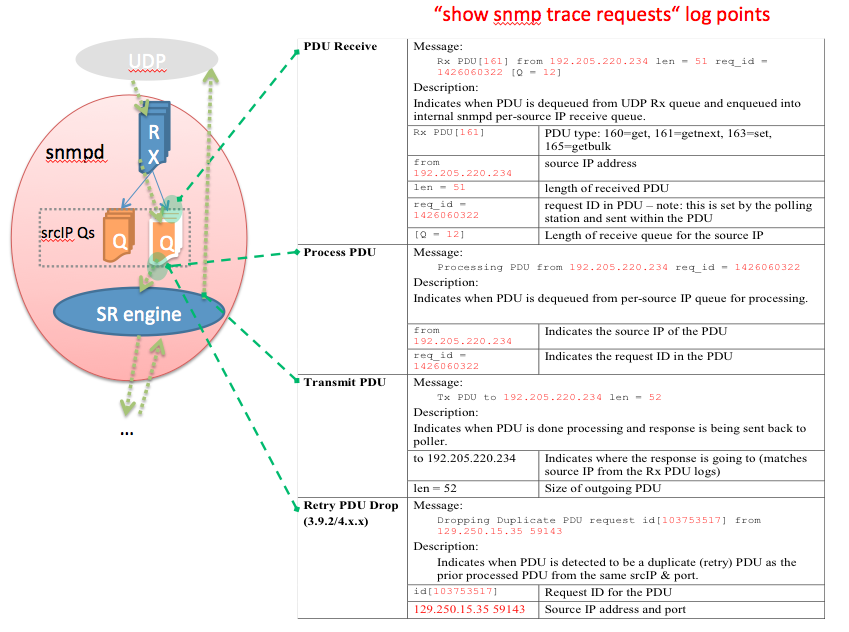
SNMP tracepoints
XR MIB implementation specifics

Troubleshooting commands and what they do
The following show and debug commands are very powerful to verify and track SNMP.
show snmp | Global agent counters—incoming, outgoing (request and trap), & error PDUs Technique: - Periodically collect output to determine overall PDU response rate and identify error rate. |
show snmp trace requests | Log of high level PDU processing tracepoints—Rx, Proc Start, Tx time Technique: Periodically collect this log. Decode and use the data to determine the following per-PDU data: 1.Source IPs of pollers 2.Queue lengths of per-source IP PDU queues 3.Types of request PDUs being used 4.Timestamp when PDUs are enqueued into the queues for the source IPs 5.Duration of the PDU enqueued & waiting to be processed 6.Processing time of PDUs from pollers |
show snmp mib access | Per-OID counters indicating the number of times an operation was done on that OID, ie. GET, GETN, SET. Technique: Periodically collecting & diff will indicate what was polled during the time periods. |
show snmp mib access time |
Per-OID timestamp of the last operation on the OID. Technique: Periodically collecting & diff will indicate if any polling on the OID was done in the time period. |
debug snmp request (careful!!!) | Enable to log every OID being processed by every PDU to syslog. Need to enable “debug snmp packet” as well to identify source of PDUs. NOTE: Disable “logging trap debug” if “snmp trap syslog” is configured!!! |
debug snmp packet (careful!!!) | Enable to log same data as “sh snmp trace requests” to syslog. NOTE: Disable “logging trap debug” if “snmp trap syslog” is configured!!! |
Show commands that are new to XR 4.2 onwards
show snmp mib statistics | Per-OID statistics summarizing transaction times within the mibd level—count + min/max/avg . Technique: Collect to determine if specific MIB objects are averaging high processing times and/or large variance (low min, high avg & max). |
show snmp queue rx | Indicates the min/max/avg queue sizes for the PDU receive and pending queues. Real-time and 5min views. |
show snmp queue trap | Indicates the min/max/avg queue sizes for the internal trap PDU queue |
(config)# snmp logging thresh oid show snmp trace slow oid | Allows configuring a duration threshold for logging per-OID transactions exceeding the time threshold. This is measured within the mibd process beginning with the call to the MIB specific handler for the OID and ending with the response from the same. |
(config)# snmp logging thresh pdu show snmp trace slow pdu |
Allows configuring a duration threshold for logging per-PDU transactions exceeding the time threshold. When logging all OIDs within the PDU are also logged to this buffer. This is measured within the snmpd process beginning with the dequeue of the PDU from the receive queue and ending when all the OIDs in the PDU have been processed and the response is ready to be sent. |
Troubleshooting PDU performance issues
Some MIBs dont have accelerated processing or dont have caching and because in certain releases SNMP is processed serially, it could happen that you'll see timeouts on OID requests that are normally operating perfectly fine. An example of a slow MIB is the SONET MIB. Because this mib needs to talk from the SNMP process all the way down to the SPA of the SIP-700 linecard (on the ASR9000), the response may not be provided in a timely manner. At the same time new requests for other OID's may be in the holding or pending queue causing timeouts and retries.
Retries to an already under performing MIB may exacerbate the overal issue.
The vast majority of PDU performance issues are related to a poller polling a specific MIB which is slow to process its OIDs.
This causes all other pollers to see some of their PDUs slowed due to queueing delays (waiting on slow MIB)
Troubleshooting Goal:
Workarounds
Use SNMP View Access Control to block access to the slow MIB tables / objects
snmp-server view MyPollView <slow MIB OID> excluded
Use ACLs to permit only “known” NMS devices/applications . In this case “known” is referring to content of requests issued from the app
Determining Internal Timeout of a MIBd
snmpd will timeout a mibd process if it has not received a response to a request for an OID/s within 10s by default.
Once in timeout state, snmpd will continue processing requests BUT it will mark the mibd as unavailable until it responds to the timed-out request.
- Getnext operations to any OIDs for MIBs in the timed out mibd will skip to the lexi-next OID owned by a different mibd process.
- Get/Set operations to any OIDs for MIBs in the timed out mibd will be responded to with a PDU error-code of “resourceUnavailable”.
Troubleshooting
(in addition to normal “slow OID” techniques):
Examples and Recommendations
For the purpose of clarification the following is an example of an snmp table. The columns (vertical) represent the instance or entity, and the rows represent the objects. In this case we have 3 instances 1, 2 and 3, and each instance has 3 objects, ifName, ifInOctets and ifMtu.
ifIndex | ifName | ifInOctets | ifMtu |
1 | Ethernet1/0 | 1234 | 1500 |
2 | POS2/0 | 512 | 500 |
3 | Serial3/0 | 235 | 600 |
The customers current snmp design is using snmpwalk. Snmpwalk works by performing a sequence of get-nexts, but on a column by column basis if the column object is specified as the starting point.
An example of a column walk specifying the ifDescr from IF-MIB
[no-sense-1 68] ~ > snmpwalk -c public 10.66.70.87 IF-MIB::ifDescr
IF-MIB::ifDescr.1 = STRING: Loopback0
IF-MIB::ifDescr.2 = STRING: Bundle-POS1
IF-MIB::ifDescr.3 = STRING: Bundle-Ether1
IF-MIB::ifDescr.4 = STRING: TenGigE1/2/0/0
IF-MIB::ifDescr.5 = STRING: TenGigE1/2/0/1
IF-MIB::ifDescr.6 = STRING: SONET0/2/0/0
IF-MIB::ifDescr.7 = STRING: SONET0/2/0/1
IF-MIB::ifDescr.8 = STRING: SONET0/2/0/2
IF-MIB::ifDescr.9 = STRING: SONET0/2/0/3
IF-MIB::ifDescr.10 = STRING: SONET0/2/0/4
<cut>
Snmpwalk can also be used to get a single object only, for instance, the object IF-MIB::ifDescr.9. It does not support the ability to specify any more than 1 object in its request. The example below shows two objects being requested, but only the first returned.
[no-sense-1 69] ~ > snmpwalk -c public 10.66.70.87 IF-MIB::ifDescr.9
IF-MIB::ifDescr.9 = STRING: SONET0/2/0/3
[12:18 - 0.31]
[no-sense-1 70] ~ > snmpwalk -c public 10.66.70.87 IF-MIB::ifDescr.9 IF-MIB::ifDescr.10
IF-MIB::ifDescr.9 = STRING: SONET0/2/0/3
[12:18 - 0.36]
For efficiency row traversal is preferred, with multiple objects requested in a single snmp transaction. This reduces unnecessary overhead on the XR system. For this reason snmpwalk is not recommended.
Examples of row traversal
The customer is currently requesting via snmpwalk the following IF-MIB objects
ifDescr
ifHCInOctets
ifHCOutOctets
ifHCInUcastPkts
ifHCOutUcastPkts
ifInNUcastPkts
ifOutNUcastPkts
ifInOctets
ifOutOctets
ifInUcastPkts
ifOutUcastPkts
The preferred method is to specify all the objects required from an instance/entity in a single command such as get-next or bulk-get. An example follows using snmpbulkget
[no-sense-1 115] ~ > snmpbulkget -v 2c -c public 10.66.70.87 IF-MIB::ifDescr IF-MIB::ifHCInOctets IF-MIB::ifHCOutOctets IF-MIB::ifHCInUcastPkts IF-MIB::ifHCOutUcastPkts IF-MIB::ifInNUcastPkts IF-MIB::ifOutNUcastPkts IF-MIB::ifInOctets IF-MIB::ifOutOctets IF-MIB::ifInUcastPkts IF-MIB::ifOutUcastPkts
IF-MIB::ifDescr.1 = STRING: Loopback0
IF-MIB::ifHCInOctets.2 = Counter64: 0
IF-MIB::ifHCOutOctets.2 = Counter64: 7116596
IF-MIB::ifHCInUcastPkts.2 = Counter64: 0
IF-MIB::ifHCOutUcastPkts.2 = Counter64: 99611
IF-MIB::ifInDiscards.2 = Counter32: 0
IF-MIB::ifOutDiscards.2 = Counter32: 0
IF-MIB::ifInOctets.2 = Counter32: 0
IF-MIB::ifOutOctets.2 = Counter32: 7116596
IF-MIB::ifInUcastPkts.2 = Counter32: 0
IF-MIB::ifOutUcastPkts.2 = Counter32: 99611
IF-MIB::ifDescr.2 = STRING: Bundle-POS1
IF-MIB::ifHCInOctets.3 = Counter64: 38796828
IF-MIB::ifHCOutOctets.3 = Counter64: 66076323
IF-MIB::ifHCInUcastPkts.3 = Counter64: 331833
IF-MIB::ifHCOutUcastPkts.3 = Counter64: 402546
IF-MIB::ifInDiscards.3 = Counter32: 0
IF-MIB::ifOutDiscards.3 = Counter32: 0
IF-MIB::ifInOctets.3 = Counter32: 38796828
IF-MIB::ifOutOctets.3 = Counter32: 66076323
IF-MIB::ifInUcastPkts.3 = Counter32: 331833
IF-MIB::ifOutUcastPkts.3 = Counter32: 402546
IF-MIB::ifDescr.3 = STRING: Bundle-Ether1
<snip>
Note above that all the objects in a row for all instances (columns) are obtained with one command. The same can be done with a get-next, however the added overhead of including the instance must be used for each instance present.
[no-sense-1 120] ~ > snmpgetnext -v 2c -c public 10.66.70.87 IF-MIB::ifDescr.1 IF-MIB::ifHCInOctets.1 IF-MIB::ifHCOutOctets.1 IF-MIB::ifHCInUcastPkts.1 IF-MIB::ifHCOutUcastPkts.1 IF-MIB::ifInNUcastPkts.1 IF-MIB::ifInOctets.1 IF-MIB::ifOutOctets.1 IF-MIB::ifInUcastPkts.1 IF-MIB::ifOutUcastPkts.1
IF-MIB::ifDescr.2 = STRING: Bundle-POS1
IF-MIB::ifHCInOctets.2 = Counter64: 0
IF-MIB::ifHCOutOctets.2 = Counter64: 7116596
IF-MIB::ifHCInUcastPkts.2 = Counter64: 0
IF-MIB::ifHCOutUcastPkts.2 = Counter64: 99611
IF-MIB::ifInDiscards.2 = Counter32: 0
IF-MIB::ifInOctets.2 = Counter32: 0
IF-MIB::ifOutOctets.2 = Counter32: 7116596
IF-MIB::ifInUcastPkts.2 = Counter32: 0
IF-MIB::ifOutUcastPkts.2 = Counter32: 99611
[13:03 - 0.35]
Although the examples are specific to IF-MIB, the same concept is relevant to all MIBs.
Timeout and Retry Setting on NMS
Timeout recommenations:
- use dynamic timeout when available
- if dynamic timeout is not available, increase timeout if more management applications are simultaneously polling the SNMP agent on asr9k. Multiply the default timeout by the number of applications that are simultaneously polling the SNMP agent on asr9k.
Retry recommendations:
- use dynamic retry when available
- if dynamic retry is not available, establish number of retries based on testing
For more details refer to IOS XR SNMP Best Practices.
Related Information
- Monitoring power supplies via SNMP, technote https://supportforums.cisco.com/docs/DOC-21667
Special thanks to the XR SNMP dev team for some of the amazing content used in this article, most notably Timothy Swanson and Leon Zachary
Xander Thuijs CCIE #6775
Principal Engineer, ASR9000
- Mark as Read
- Mark as New
- Bookmark
- Permalink
- Report Inappropriate Content
Hi Abraham,
There's a lot to monitor, some guidance in the below links. Basically you should first decide what is important for you to monitor (a healthy system and services) then translate that to OIDs.
Implementing SNMP on Cisco IOS XR Software
SNMP Server Commands on Cisco IOS XR Software
SNMP Object Navigator:
http://tools.cisco.com/Support/SNMP/do/BrowseOID.do?objectInput=
MIB Guide:
http://www.cisco.com/en/US/docs/routers/asr9000/mib/guide/asr9kmib.html
General guide to supported MIBs:
http://www.cisco.com/en/US/docs/routers/asr9000/mib/guide/asr9kmib3.html
Specific MIBs for 4.2.0:
CISCO-PROCESS-MIB information:
ftp://ftp.cisco.com/pub/mibs/v2/CISCO-PROCESS-MIB.my
Collecting CPU utilisation on Cisco IOS devices using SNMP:
http://www.cisco.com/en/US/tech/tk648/tk362/technologies_tech_note09186a0080094a94.shtml
Determining free and the largest block of contiguous memory usage on Cisco IOS devices with SNMP:
http://www.cisco.com/en/US/customer/tech/tk648/tk362/technologies_tech_note09186a0080094a95.shtml
Performance Monitoring feature offers CPU, memory, bgp, ldp and interface monitoring:
- Mark as Read
- Mark as New
- Bookmark
- Permalink
- Report Inappropriate Content
hey abraham,
you can, but you probably don't want to. Let me explain:
in the XR sw account for drops differently then in IOS, so if you have a KPI that looks at ifdrops to determine an issue, XR will erroneously generate trouble; in XR we accumulate ANY drop under that SNMP counter (eg policer drop, acl drop etc).
Same as with cpu and memory, since XR manages mem same was as Linux or OSX, the free mem is not necessarily a point of concern, since some mem is marked as "ready for use", eventhough not marked free as such.
Managing cpu and mem for IOS to XR is not the same, and that is most important. Best practices? Hard to define, this is Linux based, so you need to "manage" that accordingly.
cheers
xander
- Mark as Read
- Mark as New
- Bookmark
- Permalink
- Report Inappropriate Content
Hi Xander,
Thanks a lot for your answer. One final question based on your previous reponse. Does Monitoring Interfaces + Traffic also have the same "variation" for this platform in comparison with regular Cisco Routers?
regards
Abraham
- Mark as Read
- Mark as New
- Bookmark
- Permalink
- Report Inappropriate Content
It used to, but I want to say that in the recent codes such as 513 the implementation is rather robust. There is a delta between the interface CLI counters and the snmp counters, this simply because of the caching, the cli pulls it directly from the hardware, while snmp reads it out of the cache that gets periodically updated.
regards!!
xander
")
")
- Mark as Read
- Mark as New
- Bookmark
- Permalink
- Report Inappropriate Content
Xander - great to see you at Cisco Live and I appreciate you taking the time to meet with us to discuss BNG.
Quick question for you on SNMPv2c on v5.1.3. What is the command to show the 'hits' on the ACL? I can't seem to find the ingress location to reference. My customer's SNMP server is unable to poll the 9k, but he is receiving traps from the 9k. I suspect there is a configuration issue on the SNMP server somewhere. We can ping between loopback0 on the 9k and the A.B.C.D address on the server. I'm not seeing any packets coming in to the 9k from the SNMP server.
Here is my config:
snmp-server host A.B.C.D traps version 2c [string]
snmp-server community [string] RO SNMP_ACL
snmp-server traps
snmp-server trap-source Loopback0
ipv4 access-list SNMP_ACL
10 remark SNMP_ACL
20 permit ipv4 host A.B.C.D any
1000 remark ** DENY EVERYTHING ELSE **
1010 deny ipv4 any any
RP/0/RSP0/CPU0:CORE-1#sh snmp
Wed Jun 17 15:21:27.144 CDT
Chassis:
0 SNMP packets input
0 Bad SNMP version errors
0 Unknown community name
0 Illegal operation for community name supplied
0 Encoding errors
0 Number of requested variables
0 Number of altered variables
0 Get-request PDUs
0 Get-next PDUs
0 Set-request PDUs
1265 SNMP packets output
0 Too big errors (Maximum packet size 1500)
0 No such name errors
0 Bad values errors
0 General errors
0 Response PDUs
1265 Trap PDUs
SNMP logging: Enabled
Logging to Notification host: A.B.C.D, udp-port: 162
Trap Statistics
---------------
Number of pkts in Trap Queue: 0
Maximum length of Trap Queue: 100
Number of pkts sent: 636
Number of pkts dropped: 629
Inform Statistics
-----------------
Number of Informs sent: 0
Number of Informs retries: 0
Number of Informs pending: 0
Number of Informs dropped: 0
- Mark as Read
- Mark as New
- Bookmark
- Permalink
- Report Inappropriate Content
hey Ben!! yeah that was really awesome!! enjoyed our bng talk very much also!
say for this issue, do you have MPP configured? (management plane protection).
if so, it may be necessary to enable the interface that receives the snmp request to have snmp allowed. (check the local packet transport services document for more detail or the cisco live 2014 sanfran id 2904 for more details on LPTS).
show access-list should report it, but it sounds like the requests are not even coming in!
if the acl is removed do oyu see the requests coming in? if still not it must be MPP related, so lets try to add the interface to the mpp section and enable that interace to allow inband snmp.
cheers
xander
- Mark as Read
- Mark as New
- Bookmark
- Permalink
- Report Inappropriate Content
You nailed it - this customer is doing in band management and I never opened up SNMP in MPP. Once SNMP peer is added to the backbone interfaces in MPP we see ACL hits and SNMP working. The security works too well on the 9k!
Thanks again, Xander.
- Mark as Read
- Mark as New
- Bookmark
- Permalink
- Report Inappropriate Content
super! great we found it!
ha yeah, that lpts works pretty well!
cheers!
xander
- Mark as Read
- Mark as New
- Bookmark
- Permalink
- Report Inappropriate Content
I am looking at the output from "show snmp mib statistics" and wonder about the "COUNT" column. Does anyone know what timeframe this reflects? i.e. Is this since reboot, last 15min, etc?
My output gives me a couple OIDs in the 1.3.6.1.4.1.9.10.106.1...group that show an avg response time >100000ms, but only show a 1 for count.
Thanks in advance for the assist!
- Mark as Read
- Mark as New
- Bookmark
- Permalink
- Report Inappropriate Content
hi scott! its indicative of the number of queries it had received on that mibD:
example:
RP/0/RSP0/CPU0:A9K-BNG#proc restart mibd_interface
Thu Sep 10 13:47:44.450 EDT
RP/0/RSP0/CPU0:Sep 10 13:47:44.479 : sysmgr_control[65900]: %OS-SYSMGR-4-PROC_RESTART_NAME : User root (con0_RSP0_CPU0) requested a restart of process mibd_interface at 0/RSP0/CPU0
RP/0/RSP0/CPU0:A9K-BNG#show snmp mib statistics
Thu Sep 10 13:47:48.901 EDT
Object ID COUNT AVG[ms] MAX[ms] MIN[ms] MAX_TS
.....
Group:interface <<< no queries now!
RP/0/RSP0/CPU0:A9K-BNG#
running a walk:
......
20260: ifNumber.0 (INTEGER) 188
20261: ifNumber.0 (INTEGER) 188
20262: ifNumber.0 (INTEGER) 188
20263: ifNumber.0 (INTEGER) 188
***** SNMP QUERY ABORTED *****
Group:interface
1.3.6.1.2.1.2.1 20264 <1 <1 <1 Sep 10 13:48:25.201
ok one off :) but good enough right :)
xander
- Mark as Read
- Mark as New
- Bookmark
- Permalink
- Report Inappropriate Content
WOW - thanks for the quick response!
OK, so it looks like that increment then continues to count up since the process was last started. That helps a lot. Assuming that I have been running for some time, the following shouldn't be an issue?
****SNIP****
1.3.6.1.4.1.9.10.106.1.2.1.3 1 100006 100006 100006
1.3.6.1.4.1.9.10.106.1.2.1.4 1 100007 100007 100007
1.3.6.1.4.1.9.10.106.1.2.1.5 1 100007 100007 100007
1.3.6.1.4.1.9.10.106.1.2.1.6 1 38913 38913 38913
****SNIP****
- Mark as Read
- Mark as New
- Bookmark
- Permalink
- Report Inappropriate Content
10.106 is the pw mib.
this mib is known to have some performance issues and I think only recently we are adding it back into service for limited scale.
the query time for this one event that it got was 100secs that is too much of course, but depending on release you have you may see this mib not supported at all or some perf issues.
xander
- Mark as Read
- Mark as New
- Bookmark
- Permalink
- Report Inappropriate Content
Good morning-
I'm looking for some advice/clarification on changes that I'm looking to make. Let me start with a little background.
Our SNMP environment has multiple platforms (a mix of IOS and IOS XR systems) - unfortunately we have little access to in regards to the configuration of the various SNMP management systems polling the network. This is putting a strain on the IOS XR platforms such that much of the needed information is not getting out (due to time outs). We have pulled 'sh snmp mib statistics' and made a list of higher level OIDs that we would like to start with in an attempt reduce this strain (see attached). Our main priority (a must have) is the IF MIB (access to IF statistics) we need this to manage the network. Our study revealed 72 different MIB families based on grouping the polled OIDs by the first 5 or 6 descriptors. We find the requested information ranges from ATM to IPV4/6 to CFM... many of which are outside of our primary objective (Interface stats).
My questions are as follows:
* Are any of the OIDs that are on my "no" list likely to be polled internally by the system? i.e. Is there a chance / risk that I may break a service on the 9k by excluding any of the OIDs in question?
* Is there a way that we can quickly determine if any of the OIDs are NOT supported in the IOS-XR Mib set?
As always, thanks in advance for any replies!
- Mark as Read
- Mark as New
- Bookmark
- Permalink
- Report Inappropriate Content
hi scott: the system itself wont poll info, only an "external" snmp get will induce access to the mib (dll's) inside.
as for the oid support, the mib list shows which mibs we are specifically testing against per release:
ftp://ftp.cisco.com/pub/mibs/supportlists/asr9000/asr9000-supportlist.html
if a mib is not supported it wont return a value.
you can also use the mib"views" to restrict access to certain mibs if you like with the snmp-view commands.
cheers
xander
- Mark as Read
- Mark as New
- Bookmark
- Permalink
- Report Inappropriate Content
Xander-
I want to thank you again for your prompt responses! That was just the type of response I was looking for. Have a great weekend.
Find answers to your questions by entering keywords or phrases in the Search bar above. New here? Use these resources to familiarize yourself with the community: