- Cisco Community
- Technology and Support
- Networking
- Switching
- Hi Mishaal,
- Subscribe to RSS Feed
- Mark Topic as New
- Mark Topic as Read
- Float this Topic for Current User
- Bookmark
- Subscribe
- Mute
- Printer Friendly Page
Ask the Expert: Troubleshooting High CPU in Catalyst Switches
 - Emeritus")
- Mark as New
- Bookmark
- Subscribe
- Mute
- Subscribe to RSS Feed
- Permalink
- Report Inappropriate Content
01-19-2016 03:04 PM - edited 03-08-2019 03:27 AM
![]() This session will provide an opportunity to learn and ask questions about how to troubleshoot CPU issues in the Cisco Catalyst Switches IOS architecture.
This session will provide an opportunity to learn and ask questions about how to troubleshoot CPU issues in the Cisco Catalyst Switches IOS architecture.
Ask questions from Monday, January 25 to Friday February 5, 2016
Featured Experts
 Naveen Venkateshaiah is a customer support engineer in High-Touch Technical Services (HTTS). He is an expert on Routing, LAN Switching and Data Center products. His areas of expertise include Cisco Catalyst 3000, 4000, 6500, and Cisco Nexus 7000,Nexus 5000, Nexus 3000, Nexus 2000, UCS, and MDS SAN Switches. He has over 8 years of industry experience working with large enterprise and Service Provider networks. Venkateshaiah holds a CCNA, CCNP, and CCDP-ARCH, AWLANFE, LCSAWLAN Certification. He is currently working to obtain a CCIE in Data Center.
 Abhishek Soni is a customer support engineer in High-Touch Technical Services (HTTS). He is an expert on Routing, LAN Switching and Data Center products. His areas of expertise include Cisco Catalyst 3000, 4000, 6500, and Cisco Nexus 7000. He has over 8 years of industry experience working with large enterprise and Service Provider networks. Soni holds a CCNA and CCNP Certification. He is currently working to obtain a CCIE in routing and switching.
Find other https://supportforums.cisco.com/expert-corner/events.
** Ratings Encourage Participation! **
Please be sure to rate the Answers to Questions
Monica Lluis
Community Manager Lead
- Labels:
-
Other Switching
- Mark as New
- Bookmark
- Subscribe
- Mute
- Subscribe to RSS Feed
- Permalink
- Report Inappropriate Content
01-28-2016 06:04 AM
Thanks Steve for the logs.
++ From the 'spanning-tree' perspective, network seems to be absolutely stable.
++ Also you are running pretty new code. So chances of hitting a Bug is very less.
++ I would also ask you to keep an eye on the logs whwnever you see the high CPU.
I would wait for your response on logs requested when the CPU is high. Thanks!
- Mark as New
- Bookmark
- Subscribe
- Mute
- Subscribe to RSS Feed
- Permalink
- Report Inappropriate Content
01-27-2016 08:16 AM
Hello Naveen and Abhishek,
thanks for this opportunity!
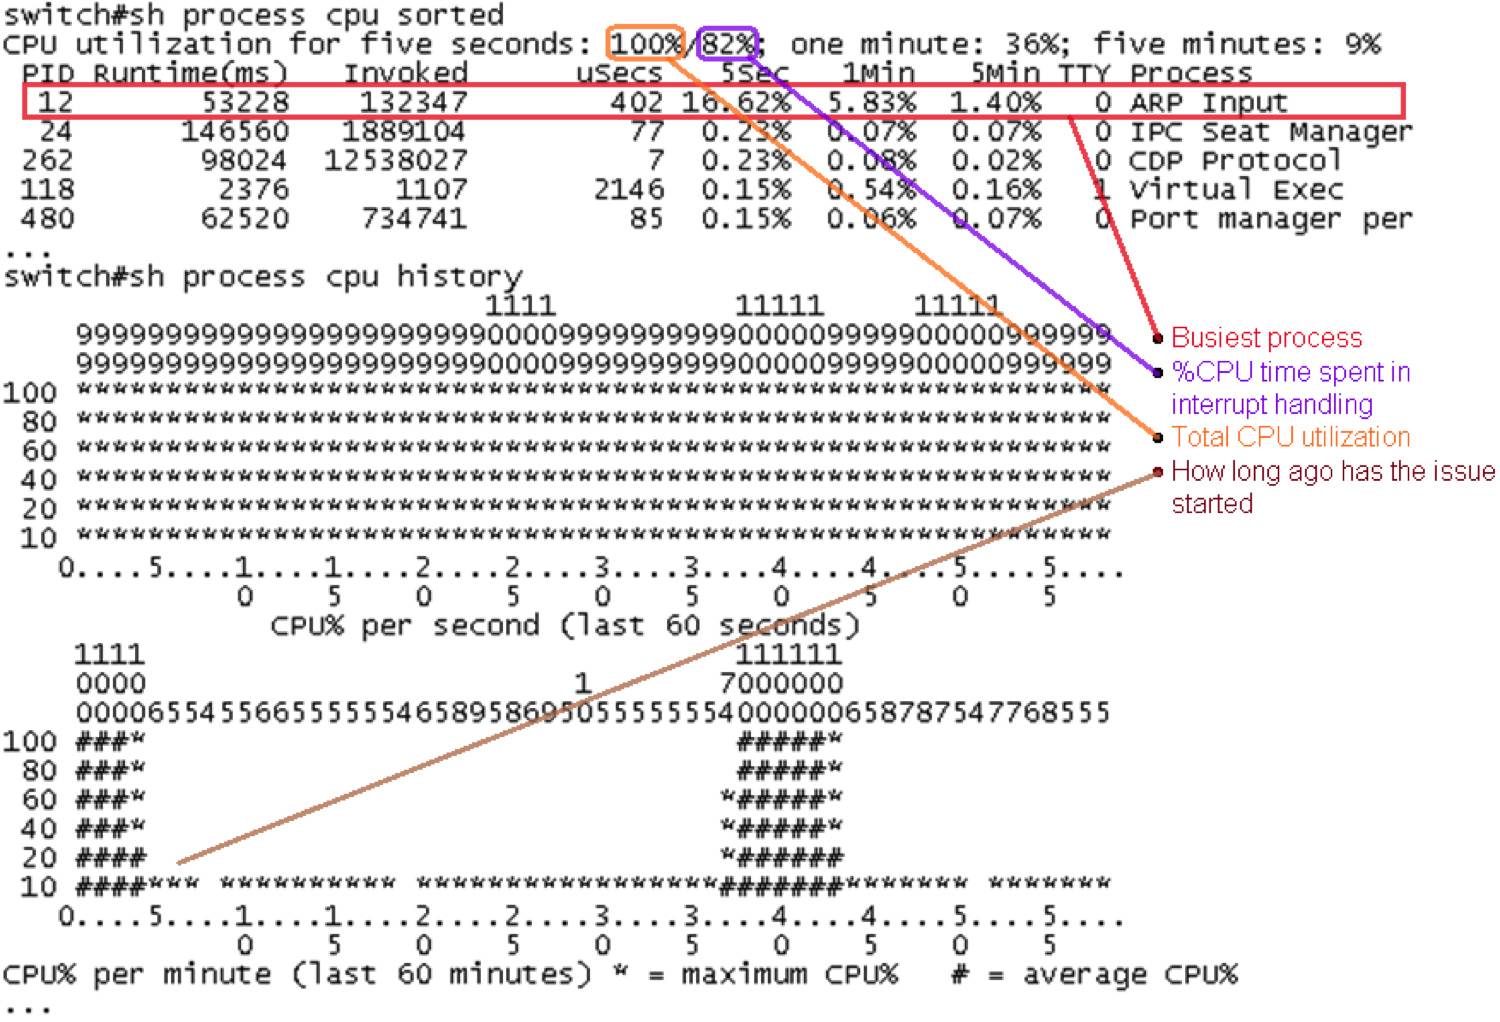
I have a c4503-E with SUP-IV which sometimes rises up to 100% CPU usage:
#show proc cpu history
    4444444446666677777999996666444444444444444444444444444444
    3333333337777700000999993333333331111199999222233333000003
100                    *****
 90                    *****
 80                    *****
 70          ***************
 60          *******************
 50          *******************          *****
 40 **********************************************************
 30 **********************************************************
 20 **********************************************************
 10 **********************************************************
   0....5....1....1....2....2....3....3....4....4....5....5....
             0    5    0    5    0    5    0    5    0    5
               CPU% per second (last 60 seconds)
    9554454555545544454445544445454455445544555555554445556656
    9389928661095388759895399990708930985788034100069980866910
100 *
 90 *
 80 *
 70 *                                                     **
 60 * *    **   *    *   *              **         *    **** *
 50 #*#****#*********#***##**************#***#*****#****######
 40 ##########################################################
 30 ##########################################################
 20 ##########################################################
 10 ##########################################################
   0....5....1....1....2....2....3....3....4....4....5....5....
             0    5    0    5    0    5    0    5    0    5
               CPU% per minute (last 60 minutes)
              * = maximum CPU%   # = average CPU%
    6999996666666666666677679999986666775666666667667679668665675666566566
    4909464613072864826358549979967001909036265271115408807678219402976950
100  * * *                  *****                      *
 90  *****                  ******                     *  *
 80  *****              **  ******    *             *  *  *
 70  ***** *   * ** * * ***********   **   * ** **  * *** ***  *     ** *
 60 **********************************************************************
 50 ****#******#********########*#*****#***********#**##*******#**********
 40 ######################################################################
 30 ######################################################################
 20 ######################################################################
 10 ######################################################################
   0....5....1....1....2....2....3....3....4....4....5....5....6....6....7.
             0    5    0    5    0    5    0    5    0    5    0    5    0
                   CPU% per hour (last 72 hours)
                  * = maximum CPU%   # = average CPU%
I followed this 4k-troubleshooting guides:
http://www.cisco.com/c/en/us/td/docs/switches/lan/catalyst4500/troubleshooting/cpu_util.html
http://www.cisco.com/c/en/us/support/docs/switches/catalyst-4000-series-switches/65591-cat4500-high-cpu.html
A show process cpu didn't show anything remarkable, pretty much what we see at normal operation as well:
#show proc cpu sorted
CPU utilization for five seconds: 49%/1%; one minute: 49%; five minutes: 46%
 PID Runtime(ms)   Invoked      uSecs   5Sec   1Min   5Min TTY Process
 119  1103379514 405836961       2718 19.11% 18.11% 18.27%   0 Spanning Tree
  58   6135078891616057269        379 13.51% 13.96% 14.00%   0 Cat4k Mgmt HiPri
  59   261420791 187399173       1394  8.23%  4.87%  5.10%   0 Cat4k Mgmt LoPri
  43     6657295    394799      16862  1.19%  0.15%  0.07%   0 Per-minute Jobs
 104     6491003  10255323        632  0.95%  0.14%  0.09%   0 CDP Protocol
 232    14051816 369732468         38  0.71%  0.75%  0.77%   0 HSRP Common
 112    35358993 344155130        102  0.47%  0.51%  0.41%   0 IP Input
A show ip traffic showed relatively high numbers of ICMP Redirects and Time Exceededs, so I disabled ip redirects and eliminated some blackholing by applying a discard route.
Now my question:
During the last CPU spike I noticed that "K2 Packet Memory Dia" consumed much more CPU than its target:
#show platform health
                     %CPU   %CPU    RunTimeMax   Priority  Average %CPU  Total
                     Target Actual Target Actual   Fg   Bg 5Sec Min Hour  CPU
K2 Packet Memory Dia   2.00  15.88     15      9  100  500    0   0    0  929:57
While I'm waiting for the next spike, could you tell me if this is something to do further troubleshooting and if so, what should be the next step then?
Thanks in advance,
Rolf
")
")
- Mark as New
- Bookmark
- Subscribe
- Mute
- Subscribe to RSS Feed
- Permalink
- Report Inappropriate Content
01-27-2016 05:59 PM
Hi Rolf,
Thank you for posting this query.
++ K2 Packet Memory Diagnostic is a background task that is checking the memory on a regular basis.
++ I would request you to look for any STP TCN's,lets start TS one by one.
Below is the command ,make sure you collect all this logs during time of HIGH CPU.
show spanning details | in executing|changes|from
sh spanning-tree detail | i ieee|occur|from
++ If there is a frequent TCN's generated,we have look for the interface or vlan and follow the path.
++ After collecting the above commands, try to collect below command out put in a separate file
terminal length 0
show process cpu sorted | ex 0.00%
show platform cpu packet statistics all
show platform cpu packet statistics
Show platform health | ex 0.00
debug platform packet all receive buffer
show platform cpu packet buffered
undebug all
Show version
show module
Note: These are not the service impactive commands.
Regards,
Naveen
- Mark as New
- Bookmark
- Subscribe
- Mute
- Subscribe to RSS Feed
- Permalink
- Report Inappropriate Content
01-28-2016 08:07 AM
Thanks Naveen.
show spanning details | in executing|changes|from
sh spanning-tree detail | i ieee|occur|from
That's funny - I've been using this RegEx for quite a while ;-)
Today no more peaks occurred, but I'll come back the next time when I could gather some additional information.
Thanks again,
Rolf
- Mark as New
- Bookmark
- Subscribe
- Mute
- Subscribe to RSS Feed
- Permalink
- Report Inappropriate Content
01-30-2016 10:55 PM
Sure Rolf,Thanks.
Regards,
Naveen
- Mark as New
- Bookmark
- Subscribe
- Mute
- Subscribe to RSS Feed
- Permalink
- Report Inappropriate Content
01-27-2016 08:57 PM
Hello Naveen and Abhishek,
We replaced a Cat6500 with Cat4500-X and now we are facing to high cpu problem.
I suspect that using of a lot of Secondary IPs under particular SVI.
Is there any chance that Secondary IPs cause high cpu situation?
- Samira
- Mark as New
- Bookmark
- Subscribe
- Mute
- Subscribe to RSS Feed
- Permalink
- Report Inappropriate Content
01-28-2016 05:56 AM
Hi Samira,
Thanks for reaching out. I would not conclude that secondary IP can cause high CPU. Unless you CPU intensive traffic is coming on.
Best way to troubleshoot, to find out what exactly is causing the HIGH CPU. If you are still seeing high CPU, Please upload following info:
- show version
- show module
- show logging
- show process cpu sort
Thanks!
- Mark as New
- Bookmark
- Subscribe
- Mute
- Subscribe to RSS Feed
- Permalink
- Report Inappropriate Content
01-27-2016 09:57 PM
Hello Naveen and Abhishek,
I have 6509 with one 'sup720 3b'on last September I faced an issue with high cup around 99% when I issues the command show Cpu process and other show commands for running process it didn't shows the process that consume the Cpu.
-Mishaal
- Mark as New
- Bookmark
- Subscribe
- Mute
- Subscribe to RSS Feed
- Permalink
- Report Inappropriate Content
01-27-2016 10:31 PM
Hi Mishaal,
Thanks for bringing in this question.
Normally when you execute "show process cpu sorted" you should be able to get which process or due to interrupt is causing the cpu to go high,I am not sure what could have been wrong when you issued the command which was unable to show you the output.
Basically this how you have to identify the high cpu ,based on this output we have to further investigate on the root cause.
Thanks,
Naveen
- Mark as New
- Bookmark
- Subscribe
- Mute
- Subscribe to RSS Feed
- Permalink
- Report Inappropriate Content
01-30-2016 12:39 AM
Hello Naveen,
sorry i think i didn't explain my issue in the right way
the below is my issue
#sho processes cpu | exclude 0.0
CPU utilization for five seconds: 88%/82%; one minute: 91%; five minutes: 90%
PID Runtime(ms) Invoked uSecs 5Sec 1Min 5Min TTY Process
107 8754172 7698170 1137 0.31% 0.42% 0.41% 0 Earl NDE Task
123 21253956 130889234 162 0.71% 0.72% 0.72% 0 IP Input
213 8934380 40347483 221 0.71% 0.46% 0.42% 0 IP SNMP
278 31199848 50957575 612 2.07% 1.79% 1.80% 0 SNMP ENGINE
high CPU with no reasons who use it.
- Mark as New
- Bookmark
- Subscribe
- Mute
- Subscribe to RSS Feed
- Permalink
- Report Inappropriate Content
02-04-2016 04:49 AM
This is repeated question,as we are discussing above on the same.
- Mark as New
- Bookmark
- Subscribe
- Mute
- Subscribe to RSS Feed
- Permalink
- Report Inappropriate Content
01-30-2016 01:16 AM
Hello Naveen,
sorry i think i didn't make my issue clear
sho processes cpu | exclude 0.0
CPU utilization for five seconds: 88%/82%; one minute: 91%; five minutes: 90%
PID Runtime(ms) Invoked uSecs 5Sec 1Min 5Min TTY Process
107 8754172 7698170 1137 0.31% 0.42% 0.41% 0 Earl NDE Task
123 21253956 130889234 162 0.71% 0.72% 0.72% 0 IP Input
213 8934380 40347483 221 0.71% 0.46% 0.42% 0 IP SNMP
278 31199848 50957575 612 2.07% 1.79% 1.80% 0 SNMP ENGINE
the problem is high cpu with no hint who use it
- Mark as New
- Bookmark
- Subscribe
- Mute
- Subscribe to RSS Feed
- Permalink
- Report Inappropriate Content
01-30-2016 11:12 PM
Hi Mishaal,
From the logs i could see the high cpu due to interrupt..
sho processes cpu | exclude 0.0
CPU utilization for five seconds: 88%/82%; one minute: 91%; five minutes: 90%
You can capture the packet which are hitting the CPU, using 'netdr' tool.
https://supportforums.cisco.com/document/59956/troubleshooting-netdr-capture-sup7206500
You can trace the source IP/MAC and try to shut that port and see if issue gets resolved
Here is the procedure to capture, Netdr.
debug netdr capture rx
terminal lengh 0
show netdr capture
Undebug netdr capture
Or
Undebug all
Regards,
Naveen Venkateshaiah.
- Mark as New
- Bookmark
- Subscribe
- Mute
- Subscribe to RSS Feed
- Permalink
- Report Inappropriate Content
02-01-2016 02:28 AM
Hello Naveen,
Kindly note when
run the command
#remote login switch
#show process cpu
it shows normal 13%/0%
with out the remote login it shows 59%/55%
I run Netdr capture and it shows the traffic actually I can't disable the port because I am running VoIP traffic and all IPs shows are legitimate for the VoIP services we provide.
is there any advice or further trouble shoot in that case.
- Mark as New
- Bookmark
- Subscribe
- Mute
- Subscribe to RSS Feed
- Permalink
- Report Inappropriate Content
02-01-2016 03:10 AM
Hi Mishal,
When you say "remote login switch" you are actually checking switch processor CPU,and it looks good,13% is normal.
I would request you to share below logs during the CPU is High
debug netdr capture rx
terminal lengh 0
show netdr capture
Undebug netdr capture
Or
Undebug all
Please share the logs in a text file and upload it ,i will analyze and update you on my findings.
Regards,
Naveen Venkateshaiah.
Discover and save your favorite ideas. Come back to expert answers, step-by-step guides, recent topics, and more.
New here? Get started with these tips. How to use Community New member guide
