- Cisco Community
- Technology and Support
- Networking
- Switching
- Re: Cisco NEXUS 3k drops multicast stream at the same time everyday one time
- Subscribe to RSS Feed
- Mark Topic as New
- Mark Topic as Read
- Float this Topic for Current User
- Bookmark
- Subscribe
- Mute
- Printer Friendly Page
Cisco NEXUS 3k drops multicast stream at the same time everyday one time
- Mark as New
- Bookmark
- Subscribe
- Mute
- Subscribe to RSS Feed
- Permalink
- Report Inappropriate Content
01-26-2021 01:30 AM
Hello experts,
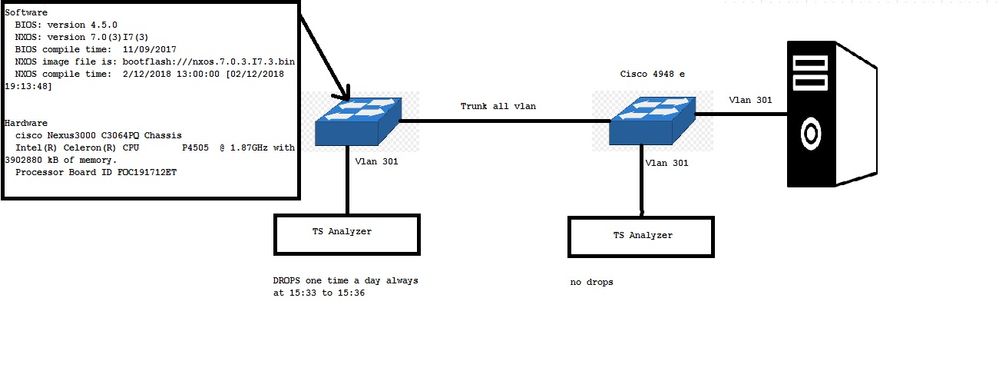
i'm experiencing the issue that on my switch nexus 3K i have a drop on the multicast steam one time per dat at the same time and the drops is always about 3 min . Seems a time out bu i don't know if it is related to igmp management or something else .
Do you have any suggestion?
Thanks in advance
Regards
- Labels:
-
LAN Switching
- Mark as New
- Bookmark
- Subscribe
- Mute
- Subscribe to RSS Feed
- Permalink
- Report Inappropriate Content
01-26-2021 02:43 AM
Need More information config and some logs at the time of issue, and your environment connected source and destination connected.
- Mark as New
- Bookmark
- Subscribe
- Mute
- Subscribe to RSS Feed
- Permalink
- Report Inappropriate Content
01-28-2021 04:08 AM
Hello BB ,
thanks for your reply , here in attached the diagram with info.
hope this help
- Mark as New
- Bookmark
- Subscribe
- Mute
- Subscribe to RSS Feed
- Permalink
- Report Inappropriate Content
01-28-2021 04:44 AM
Can you post below information :
1. nexus conencte Interface config to other device (both the side config.
2 show interface ethernet x/x (look any drops) - both the sides.
do you see any process high that time, if you doing any Monitoring ? what is the bandwidth on that time when the Loss occurs
above information may help to identify the issue.
- Mark as New
- Bookmark
- Subscribe
- Mute
- Subscribe to RSS Feed
- Permalink
- Report Inappropriate Content
01-29-2021 12:00 AM
Hi BB,
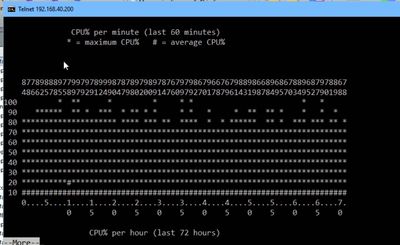
I found this situation on the process%.
Do you think that can be the reason?
Thanks in advance
- Mark as New
- Bookmark
- Subscribe
- Mute
- Subscribe to RSS Feed
- Permalink
- Report Inappropriate Content
01-26-2021 02:50 AM
Hello,
Can you please provide the topology and configuration information. It is hard to tell. What are the multicast streams? Are they just switched or routed? Where do they originate? What is the overall load on the switch?
- Mark as New
- Bookmark
- Subscribe
- Mute
- Subscribe to RSS Feed
- Permalink
- Report Inappropriate Content
01-28-2021 04:10 AM
Hello Sergey,
thanks for your reply, here in enclose the diagram with infos.
hope this help
thanks in advance
- Mark as New
- Bookmark
- Subscribe
- Mute
- Subscribe to RSS Feed
- Permalink
- Report Inappropriate Content
01-28-2021 04:43 AM
Hi Ziggy74,
So what do you see in the logs for that period of time (15:33 - 15:36)? Also, can you please show the output of "show igmp groups" from the Nexus switch. Also, can you please show the port configuration for the TS Analyzer port.
- Mark as New
- Bookmark
- Subscribe
- Mute
- Subscribe to RSS Feed
- Permalink
- Report Inappropriate Content
01-28-2021 09:56 AM
Hi Sergey,
here the port :
Ethernet1/32 is up
admin state is up, Dedicated Interface
Hardware: 100/1000/10000 Ethernet, address: a89d.21ab.90a7 (bia a89d.21ab.90a7)
MTU 1500 bytes, BW 1000000 Kbit, DLY 10 usec
reliability 255/255, txload 25/255, rxload 1/255
Encapsulation ARPA, medium is broadcast
Port mode is access
full-duplex, 1000 Mb/s, media type is 1G
Beacon is turned off
Auto-Negotiation is turned on FEC mode is Auto
Input flow-control is off, output flow-control is off
Auto-mdix is turned off
Rate mode is dedicated
Switchport monitor is off
EtherType is 0x8100
EEE (efficient-ethernet) : n/a
Last link flapped 2d07h
Last clearing of "show interface" counters never
20 interface resets
30 seconds input rate 356240 bits/sec, 0 packets/sec
30 seconds output rate 99878584 bits/sec, 9162 packets/sec
Load-Interval #2: 5 minute (300 seconds)
input rate 348.65 Kbps, 0 pps; output rate 99.92 Mbps, 9.14 Kpps
RX
959028 unicast packets 102257 multicast packets 4381 broadcast packets
1065666 input packets 13146510357 bytes
0 jumbo packets 0 storm suppression packets
0 runts 0 giants 0 CRC 0 no buffer
0 input error 0 short frame 0 overrun 0 underrun 0 ignored
0 watchdog 0 bad etype drop 0 bad proto drop 0 if down drop
0 input with dribble 0 input discard
203494434 Rx pause
TX
987886 unicast packets 24886029841 multicast packets 1034441 broadcast packets
24888052168 output packets 33023457271208 bytes
0 jumbo packets
0 output error 0 collision 0 deferred 0 late collision
0 lost carrier 0 no carrier 0 babble 226 output discard
0 Tx pause
********************************************************************************************
sh ip igmp groups give me no response (empty)
sh ip igmp groups
IGMP Connected Group Membership for VRF "default" - 0 total entries
Type: S - Static, D - Dynamic, L - Local, T - SSM Translated, H - Host Proxy
Group Address Type Interface Uptime Expires Last Reporter
Thanks
- Mark as New
- Bookmark
- Subscribe
- Mute
- Subscribe to RSS Feed
- Permalink
- Report Inappropriate Content
01-29-2021 12:02 AM
Hello Sergey,
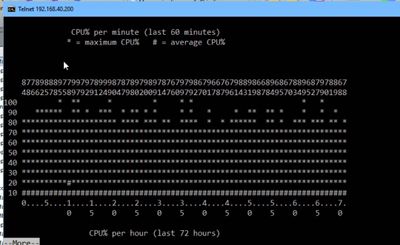
I found this situation on the process%.
Do you think that can be the reason?
Thanks in advance
- Mark as New
- Bookmark
- Subscribe
- Mute
- Subscribe to RSS Feed
- Permalink
- Report Inappropriate Content
01-29-2021 03:04 AM
Then you need to Look at the time what process hitting your CPU
show process cpu sorted | ex 0.00
Find answers to your questions by entering keywords or phrases in the Search bar above. New here? Use these resources to familiarize yourself with the community:


