- Cisco Community
- Technology and Support
- Networking
- Switching
- High CPU utilization due to IP Input
- Subscribe to RSS Feed
- Mark Topic as New
- Mark Topic as Read
- Float this Topic for Current User
- Bookmark
- Subscribe
- Mute
- Printer Friendly Page
High CPU utilization due to IP Input
- Mark as New
- Bookmark
- Subscribe
- Mute
- Subscribe to RSS Feed
- Permalink
- Report Inappropriate Content
01-23-2017 04:08 AM - edited 03-08-2019 09:01 AM
Hi guys... please help me fix this issue. I get High CPU utilization on my
C3750E Software (C3750E-IPBASEK9-M), Version 15.0(2)SE10a, RELEASE SOFTWARE (fc3)
Can any one help me with the solution. I tried to check on support forums but its still not resolved. I had the same issue on 3550 so Replaced it with 3750 but still the same.
Any help will be appreciated.
- Labels:
-
Other Switching
")
")
- Mark as New
- Bookmark
- Subscribe
- Mute
- Subscribe to RSS Feed
- Permalink
- Report Inappropriate Content
01-23-2017 05:05 AM
Hi what's connected to this switch , is it servers or just users pcs and phones ?
theres a few things to check in this doc if you have not seen it , did you capture a dhow tech when the issue was like this , run it through the cli analyser too
http://www.cisco.com/c/en/us/support/docs/routers/7500-series-routers/41160-highcpu-ip-input.html
- Mark as New
- Bookmark
- Subscribe
- Mute
- Subscribe to RSS Feed
- Permalink
- Report Inappropriate Content
01-23-2017 07:16 PM
Hi Mark,
This is my core switch for a small site. However, the design is not pretty good and I have joined here recently.. I will be changing the Infrastructure. But need to fix this untill that is done.
- Mark as New
- Bookmark
- Subscribe
- Mute
- Subscribe to RSS Feed
- Permalink
- Report Inappropriate Content
01-23-2017 08:39 PM
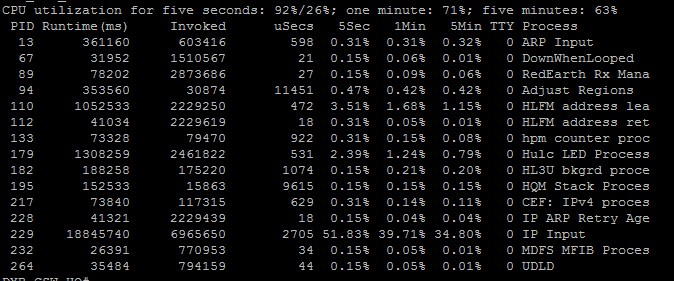
I went through the document but everything seems fine. Also the switch is behaving weird. Its 99 % for a moment and other 5 seconds its 33 %.
- Mark as New
- Bookmark
- Subscribe
- Mute
- Subscribe to RSS Feed
- Permalink
- Report Inappropriate Content
01-24-2017 12:41 AM
you could try another software release to rule that out too even though your on the latest , issue with being on the latest you may be hitting a bug and its not known , push another one into flash you could always easily roll back to the se10 , is it always ip input when it spikes to 99%
as its a core is there much server traffic , are the interfaces overloading at times ? do you monitor this switch at all with any 3rd party apps
- Mark as New
- Bookmark
- Subscribe
- Mute
- Subscribe to RSS Feed
- Permalink
- Report Inappropriate Content
01-24-2017 09:49 PM
Yes i keep monitoring this as my Solarwinds keeps poping alerts. However, I replaced this switch 2 days ago. I was using 3550 before this one and i replaced it because it had the same issue of high CPU utilization.
The performance of the network is fine but I just want to fix this issue. If IoS was the issue i wonder why my old switch has the same problem.
- Mark as New
- Bookmark
- Subscribe
- Mute
- Subscribe to RSS Feed
- Permalink
- Report Inappropriate Content
01-24-2017 11:01 PM
Yes understood with software just an option to rule out , 3750s aren't core switches really , there access/dist and have very low buffers that's why I was wondering whats connected to it and how much traffic it is pushing , it may be under spec for a core if there are servers connected
aswell if its only spiking the odd time you may not be able to fix it , some traffic can cause this as its not cef switched and is punted directly to the cpu and can cause temporary spikes in the cpu , if its sitting over 60-70% constantly then you have an issue
the fact you have 26% interrupt traffic at the same time it spikes indicates its struggling at that time to process everything
if it was a larger switch we could do a netdr capture and see exactly what is being punted to the cpu but the lower end 3 series don't support this
- Mark as New
- Bookmark
- Subscribe
- Mute
- Subscribe to RSS Feed
- Permalink
- Report Inappropriate Content
01-25-2017 06:39 AM
I have enabled CEF too but its not helping 😞 ... Let me get more details on my own research and update here... But you are a great help. Thank you for responding my query please keep an eye on this post I will update you soon...
If not i will simply get Nexus 7k 😛
- Mark as New
- Bookmark
- Subscribe
- Mute
- Subscribe to RSS Feed
- Permalink
- Report Inappropriate Content
01-25-2017 07:35 AM
haha yes stick in a 7k or 2 🙂
do you have access to the cli analyser you can run the show tech through it see if it picks something up ? if not I can run it for you but you need to capture the show tech while its high
heres a script you can run save you trying to capture real time , basically when cpu hits 70% it will run the below script collect all the commands below dump it into a text file you can then pull from flash so you have all the stats as the switch is effected
event manager applet High_CPU
event snmp oid 1.3.6.1.4.1.9.9.109.1.1.1.1.4.1 get-type exact entry-op ge entry-val "70" exit-time 10 poll-interval 5
action 0.1 syslog msg "CPU Utilization is high"
action 0.2 cli command "enable"
action 0.4 cli command "show log | append flash:CPU_Profile.txt"
action 0.5 cli command "show process cpu sorted | append flash:CPU_Profile.txt"
action 0.6 cli command "show interfaces | append flash:CPU_Profile.txt"
action 0.7 cli command " show ip cef switching stat | append flash:CPU_Profile.txt"
action 0.8 cli command " show tech | append flash:CPU_Profile.txt"
action 0.9 cli command " show int switching | append flash:CPU_Profile.txt"
action 1.0 cli command "no event manager applet High_CPU"
action 1.1 cli command "end"
Cisco tools link
http://www.cisco.com/c/en/us/support/web/tools-catalog.html
- Mark as New
- Bookmark
- Subscribe
- Mute
- Subscribe to RSS Feed
- Permalink
- Report Inappropriate Content
01-25-2017 09:51 PM
This sounds cool let me get back to you with results.
- Mark as New
- Bookmark
- Subscribe
- Mute
- Subscribe to RSS Feed
- Permalink
- Report Inappropriate Content
01-25-2017 11:46 PM
I downloaded CLI analyzer and it says no issues found when i used System Diagnostics and the same time the CPU was on 99 %
however i have also configured the EEM you requested but its not appending any output.. I keep getting the following messages:
- Mark as New
- Bookmark
- Subscribe
- Mute
- Subscribe to RSS Feed
- Permalink
- Report Inappropriate Content
01-26-2017 12:21 AM
hi
what does it show in flash , is the file there ?
dir flash:
- Mark as New
- Bookmark
- Subscribe
- Mute
- Subscribe to RSS Feed
- Permalink
- Report Inappropriate Content
01-26-2017 12:35 AM
- Mark as New
- Bookmark
- Subscribe
- Mute
- Subscribe to RSS Feed
- Permalink
- Report Inappropriate Content
01-26-2017 12:52 AM
did it all take in cli ok it sent the syslog which is action 1.0 strange the rest didn't kick in and send to flash , its in show run the whole script it took ok
you can try this one either I had saved , it was
event manager session cli username "MMALONE"
event manager applet HIGH_CPU
event snmp oid 1.3.6.1.4.1.9.9.109.1.1.1.1.3.1 get-type exact entry-op ge entry-val "70" poll-interval 30
action 0.0 syslog msg "High CPU Detected"
action 0.1 cli command "enable"
action 0.2 cli command "show clock | append flash:HIGH_CPU.txt"
action 0.3 cli command "show tech | append flash:HIGH_CPU.txt "
action 0.4 cli command "show logging | append flash:HIGH_CPU.txt "
action 0.5 cli command "show process cpu sorted | append flash:HIGH_CPU.txt "
action 0.6 cli command "show process cpu history | append flash:HIGH_CPU.txt"
action 0.7 cli command "show buffers| append flash:HIGH_CPU.txt"
action 0.8 cli command "show platform health | append flash:HIGH_CPU.txt "
action 0.9 cli command "show platform cpu packet statistics all | append flash:HIGH_CPU.txt "
action 1.0 cli command "show platform cpu packet buffered | append flash:HIGH_CPU.txt "
action 1.1 cli command "end"
!
- Mark as New
- Bookmark
- Subscribe
- Mute
- Subscribe to RSS Feed
- Permalink
- Report Inappropriate Content
01-26-2017 01:51 AM
Okay let me configure this one and hopefully come back to you with results.
Discover and save your favorite ideas. Come back to expert answers, step-by-step guides, recent topics, and more.
New here? Get started with these tips. How to use Community New member guide