- Cisco Community
- Technology and Support
- Networking
- Switching
- Can you do a "show process
- Subscribe to RSS Feed
- Mark Topic as New
- Mark Topic as Read
- Float this Topic for Current User
- Bookmark
- Subscribe
- Mute
- Printer Friendly Page
High CPU Utilization in Cisco Switch 4507
- Mark as New
- Bookmark
- Subscribe
- Mute
- Subscribe to RSS Feed
- Permalink
- Report Inappropriate Content
10-23-2014 11:18 PM - edited 03-07-2019 09:14 PM
Hi
We are facing More than 50 % CPU Utilization all the times in Cisco Switch 4507.IOSD taking almost 40 % CPU Utilization.
Kindly anyone help us to resolve this issue.
The output is as follows as
CSDC50_002# sh processes cpu sorted
Core 0: CPU utilization for five seconds: 11%; one minute: 15%; five minutes: 14%
Core 1: CPU utilization for five seconds: 51%; one minute: 53%; five minutes: 52%
PID Runtime(ms) Invoked uSecs 5Sec 1Min 5Min TTY Process
9862 1211060 42004659 0 32.72558 34.61132 33.99414 0 iosd
5459 3885714 44409169 6 0.288086 0.297852 0.291992 0 ffm
10958 4151982 78672262 38 0.041016 0.041016 0.041016 0 cpumemd
8 644749 24523998 20 0.002930 0.001953 0.001953 0 events/1
5435 970898 70708178 3 0.002930 0.002930 0.002930 0 hwcontrol
5465 1304263 70717624 40 0.002930 0.002930 0.002930 0 plogd
5608 1150185 70706550 48 0.002930 0.002930 0.002930 0 pdsd
8248 1046708 78681004 38 0.002930 0.002930 0.002930 0 ngdumper_provid
5423 1980101 79811720 1 0.001953 0.006836 0.006836 0 ha_mgr
5427 785508 62726092 60 0.001953 0.001953 0.001953 0 oscore_p
5439 793628 62725393 53 0.001953 0.001953 0.001953 0 ns_oir_proxy
5441 793583 62725341 52 0.001953 0.001953 0.001953 0 sysmgr
5445 786814 62728492 13 0.001953 0.001953 0.001953 0 profiled
5451 832762 62980573 60 0.001953 0.008789 0.001953 0 os_info_p
5455 995655 64638047 54 0.001953 0.014648 0.002930 0 eicored
5535 784834 62726210 50 0.001953 0.001953 0.001953 0 iifd
8013 798023 62737774 55 0.001953 0.001953 0.001953 0 dtmgr
8131 793434 62739728 50 0.001953 0.001953 0.001953 0 installer
8156 960864 63650927 48 0.001953 0.001953 0.001953 0 snmp_subagent
8220 814784 62809382 48 0.001953 0.048828 0.013672 0 cli_agent
9773 792924 62724620 42 0.001953 0.001953 0.001953 0 netd
9825 1213265 63012648 33 0.001953 0.001953 0.001953 0 licensed
10622 807011 62722763 61 0.001953 0.001953 0.001953 0 liin_tap
10964 817937 64339781 29 0.001953 0.001953 0.001953 0 licenseagentd
7 470596 24178853 101 0.000977 0.000977 0.000977 0 events/0
1 917 854 107388 0.000000 0.000000 0.000000 0 init
2 0 85 10894 0.000000 0.000000 0.000000 0 kthreadd
3 4883 784966 749 0.000000 0.000000 0.000000 0 migration/0
4 183 23269 7867 0.000000 0.000000 0.000000 0 ksoftirqd/0
5 3644 597433 6100 0.000000 0.000000 0.000000 0 migration/1
6 1234 129108 9560 0.000000 0.000000 0.000000 0 ksoftirqd/1
9 6 662 9521 0.000000 0.000000 0.000000 0 khelper
62 198500 49526 18815 0.000000 0.000000 0.000000 0 kblockd/0
63 43106 11060 14158 0.000000 0.000000 0.000000 0 kblockd/1
76 0 21 1619 0.000000 0.000000 0.000000 0 khubd
79 0 23 652 0.000000 0.000000 0.000000 0 kseriod
84 10 76 138250 0.000000 0.000000 0.000000 0 kmmcd
120 18471 1299134 994 0.000000 0.000000 0.000000 0 pdflush
121 28969 2020872 1583 0.000000 0.000000 0.000000 0 pdflush
122 0 29 172 0.000000 0.000000 0.000000 0 kswapd0
123 0 31 129 0.000000 0.000000 0.000000 0 aio/0
124 0 33 121 0.000000 0.000000 0.000000 0 aio/1
281 0 35 142 0.000000 0.000000 0.000000 0 kpsmoused
295 0 37 135 0.000000 0.000000 0.000000 0 edac-poller
312 0 39 128 0.000000 0.000000 0.000000 0 rpciod/0
313 0 41 121 0.000000 0.000000 0.000000 0 rpciod/1
357 75 436 174167 0.000000 0.000000 0.000000 0 udevd
507 3 369 8962 0.000000 0.000000 0.000000 0 mmcqd
728 117 3229 36351 0.000000 0.000000 0.000000 0 loop1
744 0 59 1033 0.000000 0.000000 0.000000 0 loop2
760 162 3995 40561 0.000000 0.000000 0.000000 0 loop3
2210 86 636 135371 0.000000 0.000000 0.000000 0 dbus-daemon
2546 0 438 1922 0.000000 0.000000 0.000000 0 portmap
2552 0 439 1988 0.000000 0.000000 0.000000 0 portmap
2590 2 456 6513 0.000000 0.000000 0.000000 0 xinetd
2594 1 449 3195 0.000000 0.000000 0.000000 0 xinetd
4316 0 75 80 0.000000 0.000000 0.000000 0 vsi work/0
4317 0 77 64 0.000000 0.000000 0.000000 0 vsi work/1
4478 177913 15958870 114 0.000000 0.000000 0.000000 0 watchdog
5015 22 762 30003 0.000000 0.000000 0.000000 0 app_printf.sh
5078 678 27779 24417 0.000000 0.000000 0.000000 0 slproc
5294 22 782 28776 0.000000 0.000000 0.000000 0 app_printf.sh
5431 110 772 142884 0.000000 0.000000 0.000000 0 btrace_rotate.s
7934 24 768 31963 0.000000 0.000000 0.000000 0 app_printf.sh
8040 22 793 28549 0.000000 0.000000 0.000000 0 app_printf.sh
8050 24 785 31104 0.000000 0.000000 0.000000 0 app_printf.sh
8051 22 786 28806 0.000000 0.000000 0.000000 0 app_printf.sh
8058 22 776 28493 0.000000 0.000000 0.000000 0 app_printf.sh
8059 23 793 30136 0.000000 0.000000 0.000000 0 app_printf.sh
8070 23 776 30518 0.000000 0.000000 0.000000 0 app_printf.sh
8078 24 792 30992 0.000000 0.000000 0.000000 0 app_printf.sh
8081 24 782 31456 0.000000 0.000000 0.000000 0 app_printf.sh
8087 22 773 29576 0.000000 0.000000 0.000000 0 app_printf.sh
8101 22 770 29475 0.000000 0.000000 0.000000 0 app_printf.sh
8166 22 790 28548 0.000000 0.000000 0.000000 0 app_printf.sh
8191 1 773 2526 0.000000 0.000000 0.000000 0 inotifywait
9018 51 787 65642 0.000000 0.000000 0.000000 0 rollback_timer.
9242 2 788 2958 0.000000 0.000000 0.000000 0 inotifywait
9431 22 799 28516 0.000000 0.000000 0.000000 0 app_printf.sh
9462 23 807 29406 0.000000 0.000000 0.000000 0 app_printf.sh
9468 25 805 31088 0.000000 0.000000 0.000000 0 app_printf.sh
9477 24 805 30407 0.000000 0.000000 0.000000 0 app_printf.sh
9526 23 810 28996 0.000000 0.000000 0.000000 0 app_printf.sh
10447 23 838 27727 0.000000 0.000000 0.000000 0 app_printf.sh
10517 22 836 26575 0.000000 0.000000 0.000000 0 app_printf.sh
10864 22 863 25901 0.000000 0.000000 0.000000 0 app_printf.sh
10956 743527 3166453 157 0.000000 0.000977 0.000000 0 oom_poll.sh
11393 23 853 27076 0.000000 0.000000 0.000000 0 app_printf.sh
11399 24 852 28900 0.000000 0.000000 0.000000 0 app_printf.sh
11461 23 887 26188 0.000000 0.000000 0.000000 0 app_printf.sh
11853 65 881 73913 0.000000 0.000000 0.000000 0 klogd
12184 21 882 24390 0.000000 0.000000 0.000000 0 app_printf.sh
23162 1 3166454 0 0.000000 0.000000 0.000000 0 sleep
- Labels:
-
Other Switching
- Mark as New
- Bookmark
- Subscribe
- Mute
- Subscribe to RSS Feed
- Permalink
- Report Inappropriate Content
10-27-2014 07:08 PM
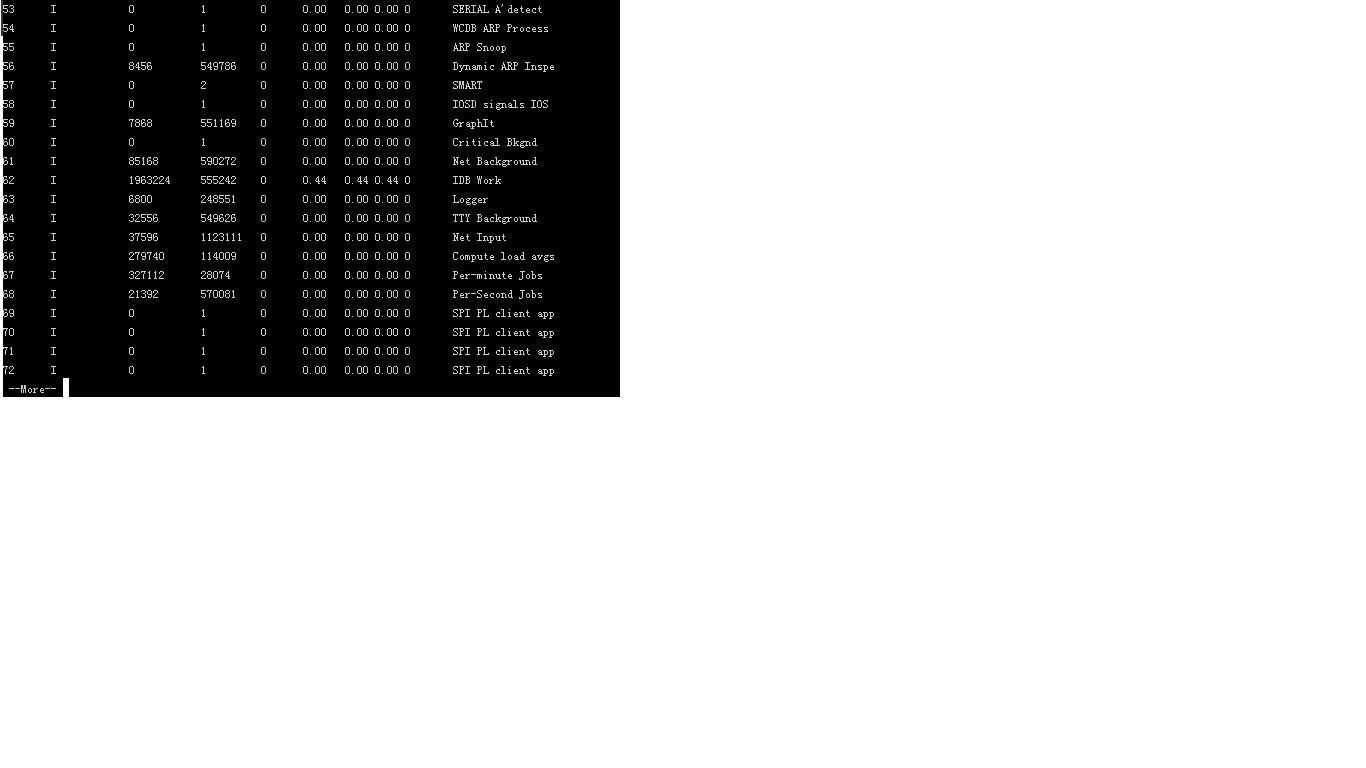
Can you do a "show process cpu detailed process iosd", please?
There are a lot of ACL packets dropped and host learning issues, but we need to check further what the top processes are or if this is user traffic.
Kind regards,
- Ed
- Mark as New
- Bookmark
- Subscribe
- Mute
- Subscribe to RSS Feed
- Permalink
- Report Inappropriate Content
02-04-2015 08:03 PM
Find answers to your questions by entering keywords or phrases in the Search bar above. New here? Use these resources to familiarize yourself with the community:
