- Cisco Community
- Technology and Support
- Networking
- Switching
- Re: HPM Main Process, High CPU
- Subscribe to RSS Feed
- Mark Topic as New
- Mark Topic as Read
- Float this Topic for Current User
- Bookmark
- Subscribe
- Mute
- Printer Friendly Page
HPM Main Process, High CPU
- Mark as New
- Bookmark
- Subscribe
- Mute
- Subscribe to RSS Feed
- Permalink
- Report Inappropriate Content
04-22-2011 10:29 AM - edited 03-06-2019 04:45 PM
Good afternoon I have a 48 port 3750E switch running ios 12.2(46)SE. The switch rebooted twice this morning for no reason that we can think of. The power is fine and the room was locked. When it re-loaded we noticed the CPU usage is quite high, around 68%. Our other LAN switches run around 7-10% on average.
The culprit seems to be the HPM MAIN PROCESS, which is running at 50%. Through my digging I've been unable to find out exactly what this process is or what it could be doing to eat up this amount of CPU%.
I'm pretty sure I haven't provided enough detail so please let me know what information would be helpful in trying to determine the root cause. I've attached the running config below. Thank you
- Labels:
-
Other Switching
- Mark as New
- Bookmark
- Subscribe
- Mute
- Subscribe to RSS Feed
- Permalink
- Report Inappropriate Content
04-22-2011 11:33 AM
Can you please post :-
1> sh controllers cpu-int
2> sh ip traffic
3> sh platform port-asic stat drop
Manish
- Mark as New
- Bookmark
- Subscribe
- Mute
- Subscribe to RSS Feed
- Permalink
- Report Inappropriate Content
04-22-2011 01:07 PM
- Mark as New
- Bookmark
- Subscribe
- Mute
- Subscribe to RSS Feed
- Permalink
- Report Inappropriate Content
04-22-2011 01:19 PM
can you copy paste the output of the sh ip traffic and run it 2-3 times , paste output of all. just to see what counter are increasing. also make your putty windows size to more than 200 lines , as you are missing the output
Manish
- Mark as New
- Bookmark
- Subscribe
- Mute
- Subscribe to RSS Feed
- Permalink
- Report Inappropriate Content
04-22-2011 01:33 PM
Thanks Manish, here is what you requested.
MJ_US_HQ_2ndfl_Cage>sh ip traffic
IP statistics:
Rcvd: 105103 total, 82507 local destination
0 format errors, 0 checksum errors, 0 bad hop count
0 unknown protocol, 22596 not a gateway
0 security failures, 0 bad options, 1706 with options
Opts: 0 end, 0 nop, 0 basic security, 0 loose source route
0 timestamp, 0 extended security, 0 record route
0 stream ID, 0 strict source route, 1706 alert, 0 cipso, 0 ump
0 other
Frags: 0 reassembled, 0 timeouts, 0 couldn't reassemble
0 fragmented, 0 couldn't fragment
Bcast: 76134 received, 0 sent
Mcast: 0 received, 0 sent
Sent: 6968 generated, 0 forwarded
Drop: 5 encapsulation failed, 0 unresolved, 0 no adjacency
0 no route, 0 unicast RPF, 0 forced drop
0 options denied, 0 source IP address zero
ICMP statistics:
Rcvd: 0 format errors, 0 checksum errors, 1 redirects, 0 unreachable
313 echo, 0 echo reply, 0 mask requests, 0 mask replies, 0 quench
0 parameter, 0 timestamp, 0 info request, 0 other
0 irdp solicitations, 0 irdp advertisements
Sent: 0 redirects, 0 unreachable, 0 echo, 313 echo reply
0 mask requests, 0 mask replies, 0 quench, 0 timestamp
0 info reply, 0 time exceeded, 0 parameter problem
0 irdp solicitations, 0 irdp advertisements
TCP statistics:
Rcvd: 6068 total, 0 checksum errors, 0 no port
Sent: 6659 total
UDP statistics:
Rcvd: 76130 total, 0 checksum errors, 73999 no port
Sent: 0 total, 0 forwarded broadcasts
PIMv2 statistics: Sent/Received
Total: 0/0, 0 checksum errors, 0 format errors
Registers: 0/0 (0 non-rp, 0 non-sm-group), Register Stops: 0/0, Hellos: 0/0
Join/Prunes: 0/0, Asserts: 0/0, grafts: 0/0
Bootstraps: 0/0, Candidate_RP_Advertisements: 0/0
State-Refresh: 0/0
IGMP statistics: Sent/Received
Total: 0/0, Format errors: 0/0, Checksum errors: 0/0
Host Queries: 0/0, Host Reports: 0/0, Host Leaves: 0/0
DVMRP: 0/0, PIM: 0/0
EIGRP-IPv4 statistics:
Rcvd: 0 total
Sent: 0 total
ARP statistics:
Rcvd: 165393 requests, 230 replies, 1528 reverse, 0 other
Sent: 10 requests, 218 replies (0 proxy), 0 reverse
Drop due to input queue full: 0
MJ_US_HQ_2ndfl_Cage>sh ip traffic
IP statistics:
Rcvd: 105258 total, 82618 local destination
0 format errors, 0 checksum errors, 0 bad hop count
0 unknown protocol, 22640 not a gateway
0 security failures, 0 bad options, 1724 with options
Opts: 0 end, 0 nop, 0 basic security, 0 loose source route
0 timestamp, 0 extended security, 0 record route
0 stream ID, 0 strict source route, 1724 alert, 0 cipso, 0 ump
0 other
Frags: 0 reassembled, 0 timeouts, 0 couldn't reassemble
0 fragmented, 0 couldn't fragment
Bcast: 76227 received, 0 sent
Mcast: 0 received, 0 sent
Sent: 6984 generated, 0 forwarded
Drop: 5 encapsulation failed, 0 unresolved, 0 no adjacency
0 no route, 0 unicast RPF, 0 forced drop
0 options denied, 0 source IP address zero
ICMP statistics:
Rcvd: 0 format errors, 0 checksum errors, 1 redirects, 0 unreachable
314 echo, 0 echo reply, 0 mask requests, 0 mask replies, 0 quench
0 parameter, 0 timestamp, 0 info request, 0 other
0 irdp solicitations, 0 irdp advertisements
Sent: 0 redirects, 0 unreachable, 0 echo, 314 echo reply
0 mask requests, 0 mask replies, 0 quench, 0 timestamp
0 info reply, 0 time exceeded, 0 parameter problem
0 irdp solicitations, 0 irdp advertisements
TCP statistics:
Rcvd: 6081 total, 0 checksum errors, 0 no port
Sent: 6673 total
UDP statistics:
Rcvd: 76222 total, 0 checksum errors, 74089 no port
Sent: 0 total, 0 forwarded broadcasts
PIMv2 statistics: Sent/Received
Total: 0/0, 0 checksum errors, 0 format errors
Registers: 0/0 (0 non-rp, 0 non-sm-group), Register Stops: 0/0, Hellos: 0/0
Join/Prunes: 0/0, Asserts: 0/0, grafts: 0/0
Bootstraps: 0/0, Candidate_RP_Advertisements: 0/0
State-Refresh: 0/0
IGMP statistics: Sent/Received
Total: 0/0, Format errors: 0/0, Checksum errors: 0/0
Host Queries: 0/0, Host Reports: 0/0, Host Leaves: 0/0
DVMRP: 0/0, PIM: 0/0
EIGRP-IPv4 statistics:
Rcvd: 0 total
Sent: 0 total
ARP statistics:
Rcvd: 165544 requests, 230 replies, 1528 reverse, 0 other
Sent: 10 requests, 218 replies (0 proxy), 0 reverse
Drop due to input queue full: 0
MJ_US_HQ_2ndfl_Cage>sh ip traffic
IP statistics:
Rcvd: 105448 total, 82771 local destination
0 format errors, 0 checksum errors, 0 bad hop count
0 unknown protocol, 22677 not a gateway
0 security failures, 0 bad options, 1724 with options
Opts: 0 end, 0 nop, 0 basic security, 0 loose source route
0 timestamp, 0 extended security, 0 record route
0 stream ID, 0 strict source route, 1724 alert, 0 cipso, 0 ump
0 other
Frags: 0 reassembled, 0 timeouts, 0 couldn't reassemble
0 fragmented, 0 couldn't fragment
Bcast: 76374 received, 0 sent
Mcast: 0 received, 0 sent
Sent: 6991 generated, 0 forwarded
Drop: 5 encapsulation failed, 0 unresolved, 0 no adjacency
0 no route, 0 unicast RPF, 0 forced drop
0 options denied, 0 source IP address zero
ICMP statistics:
Rcvd: 0 format errors, 0 checksum errors, 1 redirects, 0 unreachable
314 echo, 0 echo reply, 0 mask requests, 0 mask replies, 0 quench
0 parameter, 0 timestamp, 0 info request, 0 other
0 irdp solicitations, 0 irdp advertisements
Sent: 0 redirects, 0 unreachable, 0 echo, 314 echo reply
0 mask requests, 0 mask replies, 0 quench, 0 timestamp
0 info reply, 0 time exceeded, 0 parameter problem
0 irdp solicitations, 0 irdp advertisements
TCP statistics:
Rcvd: 6087 total, 0 checksum errors, 0 no port
Sent: 6680 total
UDP statistics:
Rcvd: 76369 total, 0 checksum errors, 74234 no port
Sent: 0 total, 0 forwarded broadcasts
PIMv2 statistics: Sent/Received
Total: 0/0, 0 checksum errors, 0 format errors
Registers: 0/0 (0 non-rp, 0 non-sm-group), Register Stops: 0/0, Hellos: 0/0
Join/Prunes: 0/0, Asserts: 0/0, grafts: 0/0
Bootstraps: 0/0, Candidate_RP_Advertisements: 0/0
State-Refresh: 0/0
IGMP statistics: Sent/Received
Total: 0/0, Format errors: 0/0, Checksum errors: 0/0
Host Queries: 0/0, Host Reports: 0/0, Host Leaves: 0/0
DVMRP: 0/0, PIM: 0/0
EIGRP-IPv4 statistics:
Rcvd: 0 total
Sent: 0 total
ARP statistics:
Rcvd: 165883 requests, 231 replies, 1528 reverse, 0 other
Sent: 10 requests, 219 replies (0 proxy), 0 reverse
Drop due to input queue full: 0
- Mark as New
- Bookmark
- Subscribe
- Mute
- Subscribe to RSS Feed
- Permalink
- Report Inappropriate Content
04-22-2011 01:39 PM
Thanks !
This is what is causing high CPU :-
UDP statistics:
Rcvd: 76130 total, 0 checksum errors, 73999 no port
Sent: 0 total, 0 forwarded broadcasts
UDP statistics:
Rcvd: 76369 total, 0 checksum errors, 74234 no port
Sent: 0 total, 0 forwarded broadcasts
the increasing no port value means "Number of times a packet was received that was directed to a port with no application listening."
I think it would be better if you can open a TAC case , as the engineer would be able to run some CPU queue debugs when he will have control of the device and can use that info to tell you which the port that is sending that UDP no port packets.
Manish
- Mark as New
- Bookmark
- Subscribe
- Mute
- Subscribe to RSS Feed
- Permalink
- Report Inappropriate Content
04-25-2011 05:19 AM
Thank you for all your assistance Manish, your explanation makes sense. I tried isolating the source of the UDP transmissions but was unable to do so. We don't have a service contract on the switch so gave it a reload and the CPU has been aroun 4% since doing so. I'm going to keep my eyes open today, hopefully it stays down! Thanks again.
- Mark as New
- Bookmark
- Subscribe
- Mute
- Subscribe to RSS Feed
- Permalink
- Report Inappropriate Content
04-26-2011 04:35 AM
We saw another day of high CPU caused by this process. Can anyone tell me this process does? There doesn't seem to be too much information about it, I'm hoping if I have an idea of what the process is I can really narrow down the cause of it spiking. Thank you.
- Mark as New
- Bookmark
- Subscribe
- Mute
- Subscribe to RSS Feed
- Permalink
- Report Inappropriate Content
04-26-2011 04:57 AM
Hi Brian,
Below is what the HPM Main process does:
The HPM main process mainly does the following checks

1. checks for the Duplex changes
2. checks whether the Port/Module is present or not and is Module inserted or not kind of
checks at regular intervals of 200 ms.

For checking for the Module existence , the HPM process keeps reading the PHY in a tight
loop and it involves some(2)Eprom2 reads. These reads can raise the CPU.
Therefore i the only issue is the occasional spikes in CPU , it could very well be a normal and expected behavior.
Hope that helps.
Regards,
Swati
- Mark as New
- Bookmark
- Subscribe
- Mute
- Subscribe to RSS Feed
- Permalink
- Report Inappropriate Content
04-26-2011 04:59 AM
Thank you that is great information. In my case I have this process consistently running, using up 50% of my CPU until I reload, and then it drops, only to re-surface again.
- Mark as New
- Bookmark
- Subscribe
- Mute
- Subscribe to RSS Feed
- Permalink
- Report Inappropriate Content
04-26-2011 05:28 AM
Hi Brian,
Can you please paste the output of " show proc cpu sorted | ex 0.00 " and " show logg " .
Regards,
Swati
- Mark as New
- Bookmark
- Subscribe
- Mute
- Subscribe to RSS Feed
- Permalink
- Report Inappropriate Content
04-26-2011 05:34 AM
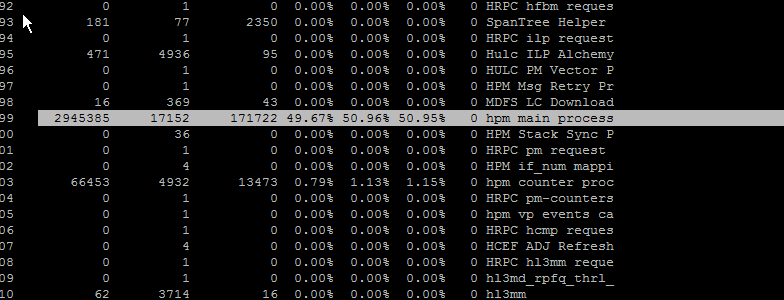
SH PROC output, please note that I reloaded the switch an hour ago, HPM MAIN PROCESS will continue to rise slowly until it hits around 50%.
PID Runtime(ms) Invoked uSecs 5Sec 1Min 5Min TTY Process
136 144962 107253 1351 6.22% 3.50% 3.40% 0 Hulc LED Process
98 84805 58013 1461 4.31% 2.13% 2.00% 0 hpm main process
102 35516 4013 8850 0.79% 0.79% 0.79% 0 hpm counter proc
198 34448 19018 1811 0.63% 0.74% 0.72% 0 Spanning Tree
144 8766 829 10574 0.31% 0.21% 0.19% 0 HQM Stack Proces
148 267 169 1579 0.15% 0.24% 0.07% 1 Virtual Exec
62 6872 102983 66 0.15% 0.10% 0.14% 0 RedEarth Tx Mana
SH LOGG --- PLEASE NOTE THE DATE IS NOT CORRECT.
Syslog logging: enabled (0 messages dropped, 0 messages rate-limited, 0 flushes, 0 overruns, xml disabled, filtering disabled)
No Active Message Discriminator.
No Inactive Message Discriminator.
Console logging: level debugging, 188 messages logged, xml disabled,
filtering disabled
Monitor logging: level debugging, 0 messages logged, xml disabled,
filtering disabled
Buffer logging: level debugging, 188 messages logged, xml disabled,
filtering disabled
Exception Logging: size (4096 bytes)
Count and timestamp logging messages: disabled
File logging: disabled
Persistent logging: disabled
Trap logging: level informational, 168 message lines logged
Log Buffer (4096 bytes):
0149: *Mar 1 00:18:25: %LINK-3-UPDOWN: Interface GigabitEthernet1/0/28, changed state to down
000150: *Mar 1 00:18:56: %LINK-3-UPDOWN: Interface GigabitEthernet1/0/9, changed state to down
000151: *Mar 1 00:19:12: %LINK-3-UPDOWN: Interface GigabitEthernet1/0/28, changed state to up
000152: *Mar 1 00:19:13: %LINEPROTO-5-UPDOWN: Line protocol on Interface GigabitEthernet1/0/28, changed state to up
000153: *Mar 1 00:21:27: %ILPOWER-5-IEEE_DISCONNECT: Interface Gi1/0/47: PD removed
000154: *Mar 1 00:21:28: %LINEPROTO-5-UPDOWN: Line protocol on Interface GigabitEthernet1/0/47, changed state to down
000155: *Mar 1 00:21:29: %LINK-3-UPDOWN: Interface GigabitEthernet1/0/47, changed state to down
000156: *Mar 1 00:21:51: %ILPOWER-7-DETECT: Interface Gi1/0/47: Power Device detected: IEEE PD
000157: *Mar 1 00:21:52: %ILPOWER-5-POWER_GRANTED: Interface Gi1/0/47: Power granted
000158: *Mar 1 00:21:55: %LINK-3-UPDOWN: Interface GigabitEthernet1/0/47, changed state to up
000159: *Mar 1 00:21:56: %LINEPROTO-5-UPDOWN: Line protocol on Interface GigabitEthernet1/0/47, changed state to up
000160: *Mar 1 00:23:48: %LINEPROTO-5-UPDOWN: Line protocol on Interface GigabitEthernet1/0/47, changed state to down
000161: *Mar 1 00:23:48: %ILPOWER-5-IEEE_DISCONNECT: Interface Gi1/0/47: PD removed
000162: *Mar 1 00:23:49: %LINK-3-UPDOWN: Interface GigabitEthernet1/0/47, changed state to down
000163: *Mar 1 00:23:56: %LINK-3-UPDOWN: Interface GigabitEthernet1/0/47, changed state to up
000164: *Mar 1 00:23:57: %LINEPROTO-5-UPDOWN: Line protocol on Interface GigabitEthernet1/0/47, changed state to up
000165: *Mar 1 00:24:19: %LINEPROTO-5-UPDOWN: Line protocol on Interface GigabitEthernet1/0/47, changed state to down
000166: *Mar 1 00:24:20: %LINK-3-UPDOWN: Interface GigabitEthernet1/0/47, changed state to down
000167: *Mar 1 00:24:23: %ILPOWER-7-DETECT: Interface Gi1/0/47: Power Device detected: IEEE PD
000168: *Mar 1 00:24:24: %ILPOWER-5-POWER_GRANTED: Interface Gi1/0/47: Power granted
000169: *Mar 1 00:24:28: %LINK-3-UPDOWN: Interface GigabitEthernet1/0/47, changed state to up
000170: *Mar 1 00:24:29: %LINEPROTO-5-UPDOWN: Line protocol on Interface GigabitEthernet1/0/47, changed state to up
000171: *Mar 1 00:26:33: %LINK-5-CHANGED: Interface GigabitEthernet1/0/9, changed state to administratively down
000172: *Mar 1 00:26:52: %LINK-3-UPDOWN: Interface GigabitEthernet1/0/9, changed state to down
000173: *Mar 1 00:50:57: %LINEPROTO-5-UPDOWN: Line protocol on Interface GigabitEthernet1/0/45, changed state to down
000174: *Mar 1 00:50:58: %LINK-3-UPDOWN: Interface GigabitEthernet1/0/45, changed state to down
000175: *Mar 1 00:51:21: %LINK-3-UPDOWN: Interface GigabitEthernet1/0/45, changed state to up
000176: *Mar 1 00:51:22: %LINEPROTO-5-UPDOWN: Line protocol on Interface GigabitEthernet1/0/45, changed state to up
000177: *Mar 1 00:51:37: %LINEPROTO-5-UPDOWN: Line protocol on Interface GigabitEthernet1/0/45, changed state to down
000178: *Mar 1 00:51:38: %LINK-3-UPDOWN: Interface GigabitEthernet1/0/45, changed state to down
000179: *Mar 1 00:51:41: %LINK-3-UPDOWN: Interface GigabitEthernet1/0/45, changed state to up
000180: *Mar 1 00:51:42: %LINEPROTO-5-UPDOWN: Line protocol on Interface GigabitEthernet1/0/45, changed state to up
000181: *Mar 1 00:59:30: %SYS-5-CONFIG_I: Configured from console by vty0 (IP HIDDEN)
000182: *Mar 1 01:04:17: %SYS-5-CONFIG_I: Configured from console by vty1 (IP HIDDEN)
000183: *Mar 1 01:05:41: %LINK-5-CHANGED: Interface GigabitEthernet1/0/45, changed state to administratively down
000184: *Mar 1 01:05:42: %LINEPROTO-5-UPDOWN: Line protocol on Interface GigabitEthernet1/0/45, changed state to down
000185: *Mar 1 01:06:07: %LINK-3-UPDOWN: Interface GigabitEthernet1/0/45, changed state to down
000186: *Mar 1 01:06:11: %LINK-3-UPDOWN: Interface GigabitEthernet1/0/45, changed state to up
000187: *Mar 1 01:06:12: %LINEPROTO-5-UPDOWN: Line protocol on Interface GigabitEthernet1/0/45, changed state to up
000188: *Mar 1 01:07:16: %SYS-5-CONFIG_I: Configured from console by vty1 (IP HIDDEN)
- Mark as New
- Bookmark
- Subscribe
- Mute
- Subscribe to RSS Feed
- Permalink
- Report Inappropriate Content
04-25-2017 06:09 AM
Hi Experts,
Got the same problem here.
CPU utilization for five seconds: 100%/0%; one minute: 79%; five minutes: 70%
PID Runtime(ms) Invoked uSecs 5Sec 1Min 5Min TTY Process
31 1596022 2635018 605 0.15% 0.06% 0.05% 0 Net Background
43 767856197 784058 979568 11.73% 31.87% 41.60% 0 SFF8472
81 1730616 66765434 25 0.15% 0.03% 0.01% 0 HLFM address lea
97 3130359 28773601 108 46.93% 26.36% 7.27% 0 hpm main process
100 41279173 2351419 17555 1.50% 1.28% 1.00% 0 hpm counter proc
133 371307079 46841834 7926 1.95% 5.55% 6.86% 0 Hulc LED Process
141 10826153 584657 18517 0.30% 0.31% 0.31% 0 HQM Stack Proces
158 2041591 1644473 1241 0.30% 0.07% 0.06% 0 CDP Protocol
182 23520725 55891419 420 0.15% 0.40% 0.44% 0 Spanning Tree
194 6435542 2353450 2734 0.30% 0.10% 0.06% 0 PI MATM Aging Pr
265 72950729 191880 380205 30.98% 5.90% 4.73% 0 OBFL VOLT obfl0
Can anyone help me on this? Thanks
- Mark as New
- Bookmark
- Subscribe
- Mute
- Subscribe to RSS Feed
- Permalink
- Report Inappropriate Content
04-26-2011 05:47 AM
Manish I looked a number of other LAN switches in my network and I see similar statistics as
"
This is what is causing high CPU :-
UDP statistics:
Rcvd: 76130 total, 0 checksum errors, 73999 no port
Sent: 0 total, 0 forwarded broadcasts
UDP statistics:
Rcvd: 76369 total, 0 checksum errors, 74234 no port
Sent: 0 total, 0 forwarded broadcasts"
Yet no other switch has a high CPU spike. I don't think this is what's causing the high CPU as if it were I would see it on my other switches.
- Mark as New
- Bookmark
- Subscribe
- Mute
- Subscribe to RSS Feed
- Permalink
- Report Inappropriate Content
04-26-2011 09:32 AM
Hi Brain,
Swati's explanation of HMI process is very useful , I was not aware of that either. The output of your logs shows that the interfaces are changing their states very often. Can you please post the switch config ( sanitized) ? and topology diagram of how things are connected.
Manish
Find answers to your questions by entering keywords or phrases in the Search bar above. New here? Use these resources to familiarize yourself with the community:
