- Cisco Community
- Technology and Support
- Collaboration
- Unified Communications Infrastructure
- Re: Real Time Monitor Tool - Charting
- Subscribe to RSS Feed
- Mark Topic as New
- Mark Topic as Read
- Float this Topic for Current User
- Bookmark
- Subscribe
- Mute
- Printer Friendly Page
- Mark as New
- Bookmark
- Subscribe
- Mute
- Subscribe to RSS Feed
- Permalink
- Report Inappropriate Content
02-25-2011 07:57 AM - edited 03-19-2019 02:28 AM
Afternoon all,
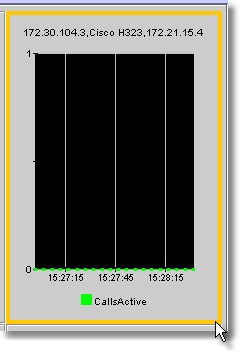
I am using RTMT 8.1 to monitor Call Activity on a specific H323 gateway within our voice network. I've produced the chart which is correctly showing me real time information over a period of a couple of minutes. However, I want to display the chart over a period of 24 hours.
Do I need to change the polling rate to 30 or 60 minutes and allow the chart to run for 24 hours before presenting it? Is there any way of producing historical data on RTMT? Any help would be apprecaited.
Regards, Jamie
Solved! Go to Solution.
- Labels:
-
UC Applications
Accepted Solutions
- Mark as New
- Bookmark
- Subscribe
- Mute
- Subscribe to RSS Feed
- Permalink
- Report Inappropriate Content
02-27-2011 04:05 AM
Hi Jamie,
Indeed in RTMT itself you should be able to achieve it by setting in counter properties "No. of data points shown on chart" to 50.
Next form Edit > Polling Rate. Set it to 30 minutes. Now it shown over 24 hours but with sample rate of 2/hour it may not really be useful.
So it would be better to have a higher sample rate and use the "Start counter logging" option to log the results to a locale csv file. So you can review the data afterwards with permformance log viewer or with Windows permance (perfmon.msc) from that locale csv file. Though you would need to leave RTMT running to log this information.
- Mark as New
- Bookmark
- Subscribe
- Mute
- Subscribe to RSS Feed
- Permalink
- Report Inappropriate Content
02-28-2011 08:10 AM
thanks! Worked perfectly. Changed the polling rate and data samples and now it looks more like a 24 hours
chart.
Jamie
Discover and save your favorite ideas. Come back to expert answers, step-by-step guides, recent topics, and more.
New here? Get started with these tips. How to use Community New member guide