- Cisco Community
- Technology and Support
- Networking
- Cisco Catalyst Center
- DNAC - Viewing syslogs
- Subscribe to RSS Feed
- Mark Topic as New
- Mark Topic as Read
- Float this Topic for Current User
- Bookmark
- Subscribe
- Mute
- Printer Friendly Page
- Mark as New
- Bookmark
- Subscribe
- Mute
- Subscribe to RSS Feed
- Permalink
- Report Inappropriate Content
03-08-2022 09:59 AM
So I'm coming from PI where the syslog viewer was super easy to use. Everything was in one place, you can sort and search all logs from all devices. Nothing else had to be done besides adding the device to inventory and having the device send over logs.
Our DNAC appliance was setup as a syslog server and all our switches are sending logs to it. How do I view these logs? I found Kibana... and apparently I have to install Filebeat... or am I way off?
Solved! Go to Solution.
- Labels:
-
Cisco DNA Center Cloud
Accepted Solutions
- Mark as New
- Bookmark
- Subscribe
- Mute
- Subscribe to RSS Feed
- Permalink
- Report Inappropriate Content
03-09-2022 02:15 PM - edited 03-09-2022 02:16 PM
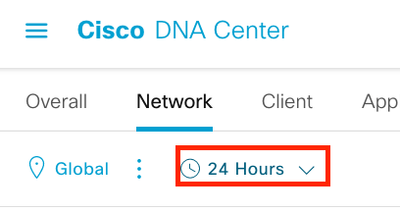
Yes, it is at the top because it filters all of the assurance data (not just event viewer data) displayed for the time period selected in the 360 dashboard for the client/device.
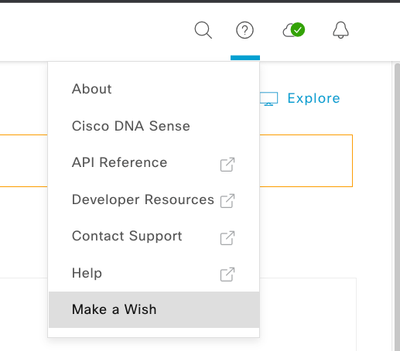
You can use the 'make a wish' feature within the DNAC GUI to make feature suggestions/enhancements directly to the DNAC product team.
You can also open a TAC case and they can open up a defect.
- Mark as New
- Bookmark
- Subscribe
- Mute
- Subscribe to RSS Feed
- Permalink
- Report Inappropriate Content
03-08-2022 06:43 PM
Yeah, I need to agree with you that Prime is easier and maybe better. But, you can find syslog on "Activity" tab. "Audit Logs"
- Mark as New
- Bookmark
- Subscribe
- Mute
- Subscribe to RSS Feed
- Permalink
- Report Inappropriate Content
03-09-2022 08:58 AM
Those audit logs look like messages from the DNAC machine itself, like me logging into the gui. These aren't logs from the switches being sent to dnac (ie, interface g1/0/1 link up).
- Mark as New
- Bookmark
- Subscribe
- Mute
- Subscribe to RSS Feed
- Permalink
- Report Inappropriate Content
03-09-2022 09:41 AM
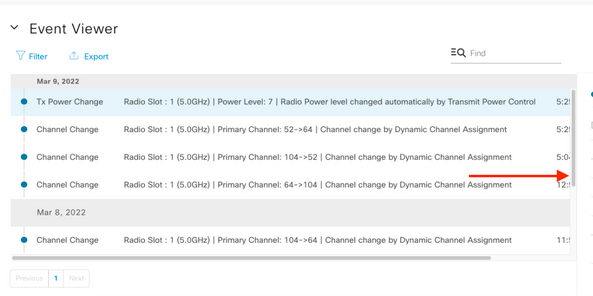
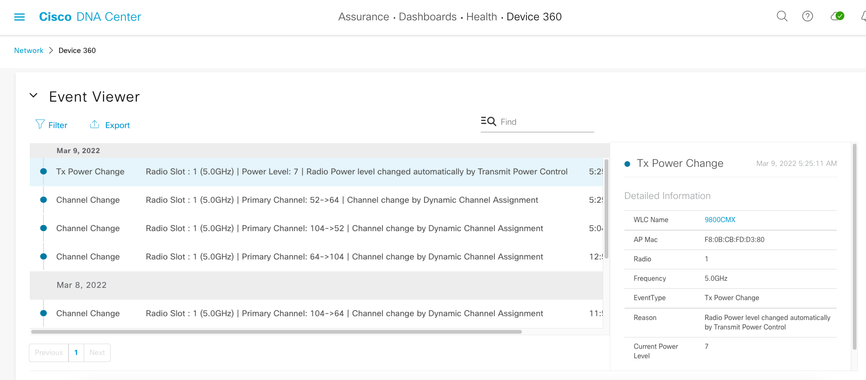
Syslog events for the network devices & even wireless/wired clients connected to those network devices can be viewed under the event viewer section of the Device/Client 360 dashboards.
- Mark as New
- Bookmark
- Subscribe
- Mute
- Subscribe to RSS Feed
- Permalink
- Report Inappropriate Content
03-09-2022 10:00 AM
Ah! I guess I just never went far down enough to the event viewer section on the 360 page. Thanks for pointing that out.
Ok, getting warmer here. Only 5 logs at a time per page? That's ... annoying but better then nothing. Filtering is pretty limited too.
- Mark as New
- Bookmark
- Subscribe
- Mute
- Subscribe to RSS Feed
- Permalink
- Report Inappropriate Content
03-09-2022 10:09 AM - edited 03-09-2022 10:12 AM
You can scroll through all the events available in event viewer for the time period you are filtered for. My screenshot only shows the latest events without scrolling further down in the events viewer section.

- Mark as New
- Bookmark
- Subscribe
- Mute
- Subscribe to RSS Feed
- Permalink
- Report Inappropriate Content
03-09-2022 11:04 AM
Yikes, ok so they put the time filter way at the top. That gave me many more pages of events to pick from. The grey bar at the top of the first event is deceiving - it has today's date (or date of the most current event?) on it. The last column only shows the time (no date) but the field at the far right has the entire date and time.
That seems like a gui bug to me. Either the grey bar needs to update with the date of events being viewed, or the date needs to be added to the info displayed by the center column that only shows the time.
- Mark as New
- Bookmark
- Subscribe
- Mute
- Subscribe to RSS Feed
- Permalink
- Report Inappropriate Content
03-09-2022 02:15 PM - edited 03-09-2022 02:16 PM
Yes, it is at the top because it filters all of the assurance data (not just event viewer data) displayed for the time period selected in the 360 dashboard for the client/device.
You can use the 'make a wish' feature within the DNAC GUI to make feature suggestions/enhancements directly to the DNAC product team.
You can also open a TAC case and they can open up a defect.
Discover and save your favorite ideas. Come back to expert answers, step-by-step guides, recent topics, and more.
New here? Get started with these tips. How to use Community New member guide


