- Cisco Community
- Technology and Support
- Networking
- Networking Knowledge Base
- Utilizing the New Packet Capture Feature
- Subscribe to RSS Feed
- Mark as New
- Mark as Read
- Bookmark
- Subscribe
- Printer Friendly Page
- Report Inappropriate Content
- Subscribe to RSS Feed
- Mark as New
- Mark as Read
- Bookmark
- Subscribe
- Printer Friendly Page
- Report Inappropriate Content
07-03-2009 02:09 AM - edited 03-01-2019 04:23 PM
When troubleshooting packet loss at a remote location where a sniffer trace isn't available, it's hard to isolate it to the LAN or WAN. In the new Cisco IOS 12.4(20)T there is a packet capture feature. The filters can be set based on interface name, direction, ACL, and even if it's to be punted to process level.
The configuration command reference is available in the Troubleshooting and Fault Management page in the Packet Capture Infrastructure section.
Update (April 8 2016): There is a tool available to Cisco Customer that simplifies the configuration, collection and extraction of the packet capture from the router. Check it out here https://cway.cisco.com/tools/CaptureGenAndAnalyse/
Contents |
Sample Problem
Let's walk through an example of how to use it to debug a packet loss problem.
Topology
The topology for the exercise is:
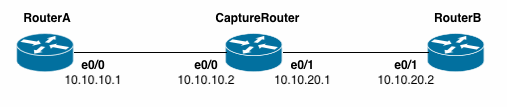
IP addresses are:
- RouterA Ethernet 0/0: 10.10.10.1/255.255.255.0
- CaptureRouter Ethernet 0/0: 10.10.10.2/255.255.255.0
- CaptureRouter Ethernet 1/0: 10.10.20.1/255.255.255.0
- RouterB Ethernet 1/0: 10.10.20.2/255.255.255.0
Problem Statement
When pinging from RouterA to RouterB with 100 byte packets there is no packet loss. However, using 1000 byte packets results in 50% packet loss.
First we try a ping with 100 byte packets:
RouterA#ping 10.10.20.2 size 100 repeat 4 timeout 1

Type escape sequence to abort.
Sending 4, 100-byte ICMP Echos to 10.10.20.2, timeout is 1 seconds:
!!!!
Success rate is 100 percent (4/4), round-trip min/avg/max = 1/4/12 ms
Then we try with 1000 byte packets:
RouterA#ping 10.10.20.2 size 1000 repeat 4 timeout 1
Type escape sequence to abort.
Sending 4, 1000-byte ICMP Echos to 10.10.20.2, timeout is 1 seconds:
!.!.
Success rate is 50 percent (2/4), round-trip min/avg/max = 1/34/68 ms
Troubleshooting
Let's make the assumption that as the network administrator you only have access to the CaptureRouter and you need to prove if the packet loss is on that device. The first step is to determine if the packets are actually coming in to the CaptureRouter. Previously one could use things such as an ingress ACL and watch hit counters or configure netflow on the ingress interface. This exercise is to show how to use the Packet Capture feature to isolate the loss.
- All of the commands are done at the EXEC prompt so configuration access isn't required unless you need to define an access-list (ACL) to make the capture more granular.
- The following steps are needed to capture the frames:
- Define a capture buffer -> This is where the frames are stored once captured
- Define a capture point -> This gives the user the ability to be more granular on what interface, switching path the frames are captured
- Associate the capture point with the capture buffer -> You can associate multiple points to the same buffer
- Start the capture
- View the capture and/or export it to a PCAP file for offline analysis
Troubleshooting Example
Let's walk through each of these steps to define a packet capture for frames with the following characteristics on the CaptureRouter:
- Packet trace is filtered for frames to match only ICMP packets between the source/destination of the ping flow
First configure the ACL to filter the trace on. It requires configuration access because currently that is the only way to define the ACL.
CaptureRouter#config t
Enter configuration commands, one per line.  End with CNTL/Z.
CaptureRouter(config)#access-list 144 permit icmp host 10.10.10.1 host 10.10.20.2
CaptureRouter(config)#access-list 144 permit icmp host 10.10.20.2 host 10.10.10.1
CaptureRouter(config)#end
This produces an access-list that will only match on ICMP packets between those two IP addresses.
Next the capture buffer needs to be created per Step 1:
CaptureRouter#monitor capture buffer holdpackets
CaptureRouter#monitor capture buffer holdpackets ?
  circular  Circular Buffer
  clear     Clear contents of capture buffer
  export    Export in Pcap format
  filter    Configure filters
  limit     Limit the packets dumped to the buffer
  linear    Linear Buffer(Default)
  max-size  Maximum size of element in the buffer (in bytes)
  size      Packet Dump buffer size (in Kbytes)
  <cr>
CaptureRouter#monitor capture buffer holdpackets filter access-list 144
Filter Association succeeded

CaptureRouter#
Next per Step 2 Configure the capture point:
CaptureRouter#monitor capture point ip cef icmptrace all both
CaptureRouter#
*Sep 11 15:51:06.395: %BUFCAP-6-CREATE: Capture Point icmptrace created.
CaptureRouter#
There are a lot more filter options under the monitor capture point command that can be used to filter even more such as interface name, direction, punt path, etc.
CaptureRouter#monitor capture point ip cef icmptrace ?
  Serial             Serial
  Tunnel             Tunnel interface
  all                All interfaces
  drop               Drop on any interface
  punt               Punt on any interface
We just set up this trace to capture in the CEF path for frames coming in and out on any interface on the router since we had applied the ACL filter to limit the frames captured to the buffer.
Step 3 is to associate the capture point to the capture buffer:
CaptureRouter#monitor capture point associate icmptrace holdpackets
Step 4 start the capture:
CaptureRouter#monitor capture point start icmptrace
Now send the 4 packets to simulate the problem.
RouterA#ping 10.10.20.2 size 1000 repeat 4 timeout 1

Type escape sequence to abort.
Sending 4, 1000-byte ICMP Echos to 10.10.20.2, timeout is 1 seconds:
!.!.
Success rate is 50 percent (2/4), round-trip min/avg/max = 1/14/28 ms

RouterA#
Looking at the CaptureRouter we see 10 packets matched in the buffer:
CaptureRouter#show monitor capture buffer holdpackets parameters
Capture buffer holdpackets (linear buffer)
Buffer Size : 262144 bytes, Max Element Size : 68 bytes, Packets : 10
Allow-nth-pak : 0, Duration : 0 (seconds), Max packets : 0, pps : 0
Associated Capture Points:
Name : icmptrace, Status : Active
Configuration:
monitor capture buffer holdpackets
monitor capture point associate icmptrace holdpackets
monitor capture buffer holdpackets filter access-list 144
How many packets would have showed up in the buffer if all 4 ping packets were successful? The answer is 16. The reason is we set up the trace on both ingress and egress. So for each packet transit the box the buffer would see the frame on ingress and on egress. Then for each ping there is the ECHO and ECHO reply so for a single ping and it's response would see 4 packets in the buffer. 4 pings were sent so that would be a total of 16 frames.
The buffer can be dumped to see the full payload via show monitor capture buffer holdpackets dump.
Looking at the buffer here are the 4 frames for the first successful ping:
CaptureRouter#show monitor capture buffer holdpackets dump
18:22:57.946 EST Sep 11 2008 : IPv4 LES CEF    : Et0/0 None
042F3400: AABBCC01 F600AABB CC01F500 08004500  *;L.v.*;L.u...E.
042F3410: 03E8006E 0000FE01 86900A0A 0A010A0A  .h.n..~.........
042F3420: 14020800 12130015 00000000 000000F6  ...............v
042F3430: 6BA4ABCD ABCDABCD ABCDABCD ABCDABCD  k$+M+M+M+M+M+M+M
042F3440: ABCDABCD 00                          +M+M.
18:22:57.946 EST Sep 11 2008 : IPv4 LES CEF    : Et0/0 Et1/0
042F3400: AABBCC01 F701AABB CC01F601 08004500  *;L.w.*;L.v...E.
042F3410: 03E8006E 0000FE01 86900A0A 0A010A0A  .h.n..~.........
042F3420: 14020800 12130015 00000000 000000F6  ...............v
042F3430: 6BA4ABCD ABCDABCD ABCDABCD ABCDABCD  k$+M+M+M+M+M+M+M
042F3440: ABCDABCD 00                          +M+M.
18:22:57.946 EST Sep 11 2008 : IPv4 LES CEF    : Et1/0 None
042F3400: AABBCC01 F601AABB CC01F701 08004500  *;L.v.*;L.w...E.
042F3410: 03E8006E 0000FE01 86900A0A 14020A0A  .h.n..~.........
042F3420: 0A010000 1A130015 00000000 000000F6  ...............v
042F3430: 6BA4ABCD ABCDABCD ABCDABCD ABCDABCD  k$+M+M+M+M+M+M+M
042F3440: ABCDABCD 00                          +M+M.
18:22:57.946 EST Sep 11 2008 : IPv4 LES CEF    : Et1/0 Et0/0
042F3400: AABBCC01 F500AABB CC01F600 08004500  *;L.u.*;L.v...E.
042F3410: 03E8006E 0000FE01 86900A0A 14020A0A  .h.n..~.........
042F3420: 0A010000 1A130015 00000000 000000F6  ...............v
042F3430: 6BA4ABCD ABCDABCD ABCDABCD ABCDABCD  k$+M+M+M+M+M+M+M
042F3440: ABCDABCD 00                          +M+M.
That makes sense as the first frame came in on E0/0, do a forwarding lookup and send it on out E1/0 for the ECHO. The ECHO reply comes back in on E1/0, do a forwarding lookup and send it back towards 10.10.10.1 out E0/0.
Looking at the next two packets in the dump we see:
18:22:57.966 EST Sep 11 2008 : IPv4 LES CEF    : Et0/0 None
042F3400: AABBCC01 F600AABB CC01F500 08004500  *;L.v.*;L.u...E.
042F3410: 03E8006F 0000FE01 868F0A0A 0A010A0A  .h.o..~.........
042F3420: 14020800 11F20015 00010000 000000F6  .....r.........v
042F3430: 6BC4ABCD ABCDABCD ABCDABCD ABCDABCD  kD+M+M+M+M+M+M+M
042F3440: ABCDABCD 00                          +M+M.
18:22:58.966 EST Sep 11 2008 : IPv4 LES CEF    : Et0/0 None
042F3400: AABBCC01 F600AABB CC01F500 08004500  *;L.v.*;L.u...E.
042F3410: 03E80070 0000FE01 868E0A0A 0A010A0A  .h.p..~.........
042F3420: 14020800 0E090015 00020000 000000F6  ...............v
042F3430: 6FACABCD ABCDABCD ABCDABCD ABCDABCD  o,+M+M+M+M+M+M+M
042F3440: ABCDABCD 00                          +M+M.
Wait, that doesn't look right because we don't see the frame forwarded out the E1/0 interface. That tells us that the frame came in and CEF saw it but for some reason the frame was not sent out the egress E1/0 interface. Therefore check the interface configuration in the path. Doing that we find the root cause for this issue.
The egress interface E1/0 has an outbound QOS policy to police traffic and with the larger frame sizes it exceeds the policer.
CaptureRouter#show run int Ethernet1/0
Building configuration

interface Ethernet1/0
 ip address 10.10.20.1 255.255.255.0
 load-interval 30
 service-policy output police
end
CaptureRouter#show policy-map interface Ethernet1/0
 Ethernet1/0

  Service-policy output: police

    Class-map: class-default (match-any)
      69 packets, 10718 bytes
      30 second offered rate 0 bps, drop rate 0 bps
      Match: any
      police:
          cir 8000 bps, bc 1500 bytes
        conformed 2 packets, 2028 bytes; actions:
          transmit
        exceeded 2 packets, 2028 bytes; actions:
          drop
        conformed 0 bps, exceed 0 bps
This example leveraged the ability to capture the packets on ingress and egress to isolate that the packet drops were indeed happening on the device. The CaptureRouter in this example saw the frames coming in on the trace but they were not sent out so the focus was then put on the device itself. Had the trace shown the packet going out of the box the focus would have moved downstream in the direction of the packet destination.
It was easier to see the inconsistency by filtering the buffer dump like this:
CaptureRouter#show monitor capture buffer holdpackets dump | include LES
17:39:38.691 EST Sep 11 2008 : IPv4 LES CEF    : Et0/0 None
17:39:38.691 EST Sep 11 2008 : IPv4 LES CEF    : Et0/0 Et1/0
17:39:38.691 EST Sep 11 2008 : IPv4 LES CEF    : Et1/0 None
17:39:38.691 EST Sep 11 2008 : IPv4 LES CEF    : Et1/0 Et0/0
17:39:38.711 EST Sep 11 2008 : IPv4 LES CEF    : Et0/0 None
17:39:39.711 EST Sep 11 2008 : IPv4 LES CEF    : Et0/0 None
17:39:39.711 EST Sep 11 2008 : IPv4 LES CEF    : Et0/0 Et1/0
17:39:39.711 EST Sep 11 2008 : IPv4 LES CEF    : Et1/0 None
17:39:39.711 EST Sep 11 2008 : IPv4 LES CEF    : Et1/0 Et0/0
17:39:39.715 EST Sep 11 2008 : IPv4 LES CEF    : Et0/0 None
That shows that the 2nd ICMP ECHO (the 5th packet down) was not forwarded through the box.
It would have been even easier to analyze if the trace buffer was exported via PCAP and analyzed in Wireshark or some other sniffer application.
This could have been done via:
CaptureRouter#monitor capture buffer holdpackets export tftp://10.10.10.1/captureut.pcap
10.10.10.1 is the ip address of the TFTP server and captureout.pcap is the file that is already created on the TFTP server and the privileges set to allow write access to it.
To make a shorter view here are the sequence of commands to have done it from start to finish:
CaptureRouter#config t
Enter configuration commands, one per line.  End with CNTL/Z.
CaptureRouter(config)#access-list 144 permit icmp host 10.10.10.1 host 10.10.20.2
CaptureRouter(config)#access-list 144 permit icmp host 10.10.20.2 host 10.10.10.1
CaptureRouter(config)#end
CaptureRouter#monitor capture buffer holdpackets
CaptureRouter#monitor capture buffer holdpackets filter access-list 144
CaptureRouter#monitor capture point ip cef icmptrace all both
CaptureRouter#monitor capture point associate icmptrace holdpackets
CaptureRouter#monitor capture point start icmptrace
To see all capture buffers:
CaptureRouter#show monitor capture buffer all parameters
Capture buffer holdpackets (linear buffer)
Buffer Size : 262144 bytes, Max Element Size : 68 bytes, Packets : 10
Allow-nth-pak : 0, Duration : 0 (seconds), Max packets : 0, pps : 0
Associated Capture Points:
Name : icmptrace, Status : Inactive
Configuration:
monitor capture buffer holdpackets
monitor capture point associate icmptrace holdpackets
To see all the capture points:
CaptureRouter#show monitor capture point all
Status Information for Capture Point icmptrace
IPv4 CEF
Switch Path: IPv4 CEF            , Capture Buffer: holdpackets
Status : Inactive

Configuration:
monitor capture point ip cef icmptrace all both
To stop a trace:
CaptureRouter#monitor capture point stop icmptrace
CaptureRouter#
*Sep 12 17:35:54.121: %BUFCAP-6-DISABLE: Capture Point icmptrace disabled.
To remove a capture point you have to issue the entire command for the point configuration:
CaptureRouter#no monitor capture point ip cef icmptrace all both
CaptureRouter#
*Sep 12 17:37:14.417: %BUFCAP-6-DELETE: Capture Point icmptrace deleted.
And to delete the capture buffer:
CaptureRouter#no monitor capture buffer holdpackets
Capture Buffer deleted
Important Notes
A couple of things to remember with this capture feature.
- It only works for IP packets to the device or that transit the device.
- It will only capture multicast packets on ingress and will not capture the replicated packets on egress.
- It will not capture MPLS encapsulated frames today.
- It is implemented at the very beginning of the switching vector on ingress and very close to the end of the switching vector on egress. Therefore, if the frame is not seen on an ingress trace it's very unlikely the frame made it to the device because the only place it could be dropped would be by the ingress interface before the frame is handed to the switching vector for processing. On egress also if the trace says the packet was forwarded it's very likely the frame did make it out on the wire towards the next hop unless it was dropped by the egress driver code.
- The capture file could only be exported off the box in the first implementation but ability to save locally on the device was added at a later state.
- When the capture point is configured on a GRE tunnel interface, the egress data traffic is captured after tunnel encapsulation is applied to the packet, whereas in the ingress direction, the data packets are captured without tunnel encapsulation.
- There is a limitation today with using EPC on an IPSec VTI (Virtual Tunnel Interface), where egress data packets are not captured if the capture buffer is associated with a filter that matches the pre-encapsulation ip flow.
- Rodney Dunn, Cisco TAC
To receive the latest information on Cisco online tools, certifications, support documentation, insights from Cisco experts and peers, and upcoming events, check out the Cisco Technical Services Newsletter today.
- Mark as Read
- Mark as New
- Bookmark
- Permalink
- Report Inappropriate Content
On which platforms does this work?
- Mark as Read
- Mark as New
- Bookmark
- Permalink
- Report Inappropriate Content
It was originally designed for all the software forwarding platforms (ie: ISR's and 7200's). It's been extended in some other formats to CAT6500's and 7600's. It's called "Mini Protocol Analyzer" on those platforms:
https://www.cisco.com/en/US/docs/routers/7600/ios/12.2SR/configuration/guide/mpa.html
ASA has it's own packet capture ability.
- Mark as Read
- Mark as New
- Bookmark
- Permalink
- Report Inappropriate Content
that doesn't work with tunnel interfaces (for vpn usage)
I tried several times and each time I have only one way trafic (eg ICMP reply but no request)
Solution is to capture on inside interface on my side to see both way trafic
- Mark as Read
- Mark as New
- Bookmark
- Permalink
- Report Inappropriate Content
What capture location did you use? ie: CEF, for-us, I ned to retest but I thought we added a specific switch to catch locally generated egress packets.
- Mark as Read
- Mark as New
- Bookmark
- Permalink
- Report Inappropriate Content
by example :
ip access-list extended nico
permit ip any host 172.31.1.241
permit ip host 172.31.1.241 any
monitor capture buffer cap size 512 max-size 1024 circular
monitor capture buffer cap filter access-list nico
monitor capture point ip cef cap tunnel0 both
monitor capture point associate cap cap
monitor capture point start cap
mon capture point stop cap
it works like I said before, only in one way
- Mark as Read
- Mark as New
- Bookmark
- Permalink
- Report Inappropriate Content
Hi,
Can you share your tunnel configuration? Is the flow you are trying to capture from-us, or transit? And what's the IOS version? If you don't use a capture buffer filter, do you see both the ingress and egress traffic in the capture? I just tested this, and it seemed to work fine for me.
Thanks,
Wen
- Mark as Read
- Mark as New
- Bookmark
- Permalink
- Report Inappropriate Content
hi,
sure :
interface Tunnel0
description Test
ip unnumbered GigabitEthernet0/1
ip mtu 1427
ip tcp adjust-mss 1387
ip ospf dead-interval 60
tunnel source GigabitEthernet0/0
tunnel destination xxxxxxxx
tunnel mode ipsec ipv4
tunnel protection ipsec profile RACINE
!
I try to catch all stream that is routed on this tunnel by exemple (in/out)
ISR 3825 hsec/k9 IOS 12.4(24)T
will try without filter but I need filter to limit what I want to look + I can get 50 Mbps in tunnel so your solution is not the better for me
Nicolas
I tried and not better (only one way stream), + now I got ESP packet whereas I listen on tunnel interface, so it catched outside interface for this special tunnel... strange
- Mark as Read
- Mark as New
- Bookmark
- Permalink
- Report Inappropriate Content
Hi,
Thanks for the config. I just realized this is a VTI tunnel, and not GRE as I had tested before. With VTI tunnels, what you observed is indeed the current behavior in IOS. There is a bug opened on this to help improve the usability of this feature in a tunnel configuration environment so that 1) you can use pre tunnel-encap ip flow filters to capture data packets going inside of the tunnel, and 2) to display the packets pre tunnel-encap such that we'd have visibility into the data packets on VTI type of interfaces. I will work with Rodney to add this caveat to the doc.
Thanks,
Wen
- Mark as Read
- Mark as New
- Bookmark
- Permalink
- Report Inappropriate Content
How can we save the captured file locally on the router ? I have checked tihs functionality is not available on 12.4(24)T1
- Mark as Read
- Mark as New
- Bookmark
- Permalink
- Report Inappropriate Content
I don't know exactly what release but I happened to have a router handy in the lab.
3900-1#monitor capture buffer test export ?
flash0: Location to dump buffer
flash1: Location to dump buffer
flash: Location to dump buffer
....
and that was on 15.0(1)M4.
- Mark as Read
- Mark as New
- Bookmark
- Permalink
- Report Inappropriate Content
Hi I also encounter some ping packet loss issues across VTI tunnel with high traffic load (but we use shaping).
If we ping between each physical interface, it's ok. Success rate is 100 percent (500/500)
If we ping across VTI tunnel, there are a few packet loss. Success rate is 98 percent (494/500)
(with no traffic load, it's fine)
Is it normal behaviour? Please suggest.
Thanks,
- Mark as Read
- Mark as New
- Bookmark
- Permalink
- Report Inappropriate Content
I would suggest starting a discussion in the support forums (http://supportforums.cisco.com) and give some more details on the configuration.
Depending on where the QOS is applied and configured it's important to take account of the tunnel overhead that gets added to the packets for the shaper.
Depending on your QOS configuration the ping over the tunnel traffic may be hitting the QOS policy where the physical to physical ping may not.
What you describe doesn't have anything to do with the actual EPC feature.
- Mark as Read
- Mark as New
- Bookmark
- Permalink
- Report Inappropriate Content
Great job on this article.
Thanks
L
- Mark as Read
- Mark as New
- Bookmark
- Permalink
- Report Inappropriate Content
Great article. I have just one question: you create an ACL every time you need to do a capture.
Can you give CLI parameters which would simply say: just capture everything from ip x (in and out) ?
I tried this:
monitor capture CAP match ipv4 10.104.18.196/32 any
but this only captures 10.104.18.196 as source (in one direction), the reply is not captured.
I have not succeeded in finding a way to do it with "monitor capture" commands only. Seems like a real ACL is needed. Why do i mind ? For an ACL, you need to go in config mode which is often restricted. To define the "monitor capture" you do not need to go in config mode. Big difference....
- Mark as Read
- Mark as New
- Bookmark
- Permalink
- Report Inappropriate Content
gnijs,
You are correct the "match" keyword doesn't do bi-directional matching for this capture and that is the reason for the ACL creation. The ASA does a capture with the "match" keyword and it works bi-directionally.
I'll search to find if there is an enhancement request to make this match bi-directional and open one if there isn't one but I wouldn't expect it to change any time soon :-D
Cheers
-Jay
Find answers to your questions by entering keywords or phrases in the Search bar above. New here? Use these resources to familiarize yourself with the community: