- Cisco Community
- Technology and Support
- Service Providers
- Service Providers Knowledge Base
- How to scale IOS-XR Telemetry with InfluxDB
- Subscribe to RSS Feed
- Mark as New
- Mark as Read
- Bookmark
- Subscribe
- Printer Friendly Page
- Report Inappropriate Content
- Subscribe to RSS Feed
- Mark as New
- Mark as Read
- Bookmark
- Subscribe
- Printer Friendly Page
- Report Inappropriate Content
07-30-2021 11:39 AM - edited 07-30-2021 11:48 AM
- Introduction
- Architecture Building Blocks
- IOS-XR Routers
- Configuration
- Performance Verification
- Optimization
- Strict timer
- Some more verification
- The Collector
- InfluxDB
- Database statistics and Health
- Closing comments
This document was written in collaboration with:
Bruno Novais - Cisco Systems - brusilva@cisco.com
Gregory Brown - Cisco Systems - gregorbr@cisco.com
Patrick Oliver - InfluxDB - patrick@influxdata.com
Sam Dillard - InfluxDB - sam@influxdata.com
Introduction
Telemetry and manageability overall have become the bread and butter of networking. Gone are the days where you setup an MRTG or similar app to monitor cpu, memory and interface statistics only. We want to have visibility on every single important metric, and there are plenty!
A plethora of customers are investigating the best ways to use it, and how to implement in their network to eventually achieve many things, including:
- Replacing SNMP. Ugh…
- Network-wide visibility.
- Fast detection and remediation of issues.
Eventually as part of the investigation process, people realize one thing:
It’s very difficult to scale.
Surely, you’ve seen a lot of articles, posts and videos of people using many different time series databases, collectors and overall architectures, but most people writing about it haven’t actually gone too fast in the process to deploy telemetry at scale in production environments.
No matter how big your network is, with current solutions, you will likely hit some scale issue with the existing tools out there, that’s the simple and ugly truth. Very few big companies managed to get telemetry to scale and have state-of-the-art architectures to support hundreds and thousands of devices to “feed” what’s needed, but you are not going to see articles about that, for sure!
The bottlenecks are commonly seen, when starting to stream off huge amounts of datapoints to a set of collectors, and those entities uploading to the databases.
The databases themselves can easily become so busy writing and indexing all this data, while simultaneously serving queries, it can become a pain to manage all this in supposedly “real-time”!
Now, you may ask, what if there were a set of tools that were integrated to make a proven scalable solution to manage your network devices? And the answer is, there is! At least one I should say – there may be others out there of course, but we will go over the learnings we’ve had with one particular architecture we’ve developed and found to be extremely scalable and easily expandable.
Let’s dive into this solution and talk about each building block, expanding onto the necessary steps to scale.
Architecture Building Blocks
What you see below is a picture representation of:
- 3 different IOS-XR platforms being used to stream telemetry data.
- A Load balancer for distribution of load between 3 collectors.
- 3 collectors in separate servers processing the raw data and preparing for upload to the databases.
- Two InfluxDB data nodes, and 3 meta nodes forming the database cluster.

The picture above abstracts the actual number of devices.
Let’s cut to the chase now – In this scenario, we have 85 routers streaming off in total, around 3 Terabytes of data per day, or 16 Gigabits/minute!
The “secret sauce” of this solution: It’s all about ensuring that each block performs at its best. Let’s look at each block in detail now.
IOS-XR Routers
Configuration
There are different ways to use Telemetry in IOS-XR devices. We will focus on the following method and characteristics:
Note: We are not saying this is the best, but it is the most widely popular method.
- Dial-out mode
- Self-describing GPB (Google Protocol Buffers)
- TCP connection
Throughout this article, I will focus on one model for academic purposes, but the same applies to any other. If more control is needed at the collector layer, then dial-in method is the option for you.
Let’s review a basic telemetry configuration for getting the CPU usage of a device:
telemetry model-driven
max-containers-per-path 1024
destination-group dial-out
address-family ipv4 1.1.1.1 port 6666
encoding self-describing-gpb
protocol tcp
!
!
sensor-group CPU
sensor-path Cisco-IOS-XR-wdsysmon-fd-oper:system-monitoring/cpu-utilization
!
subscription CPU
sensor-group-id CPU sample-interval 20000
destination-id dial-out
!
- max-containers-per-path: Need to increase this to the maximum if you are configuring a sensor-path that is very large.
- destination-group dial-out: Here we define the connection type.
- sensor-group: Contains the sensor path for the CPU usage.
- subscription: Ties a dial-out collector to a sensor with a sample-interval defined in milliseconds.
Performance Verification
What is most important about the configuration above when it comes to scale is:
Each subscription, internally, will collect the information via one of its worker threads, by requesting the data to the owner of the information itself in SysDB. Let’s find the path internally being requested when this sensor-path is requested.
RP/0/RP0/CPU0:5504#show telemetry model-driven subscription CPU internal
Subscription: CPU
-------------
State: ACTIVE
Sensor groups:
Id: CPU
Sample Interval: 20000 ms
Heartbeat Interval: NA
Sensor Path: Cisco-IOS-XR-wdsysmon-fd-oper:system-monitoring/cpu-utilization
Sensor Path State: Resolved
Destination Groups:
Group Id: dial-out
Destination IP: 10.8.136.69
Destination Port: 6666
Encoding: self-describing-gpb
Transport: tcp
State: Active
TLS : False
Total bytes sent: 2628370470
Total packets sent: 38788
Last Sent time: 2021-04-04 20:57:29.781473265 -0400
Collection Groups:
------------------
Id: 328
Sample Interval: 20000 ms
Heartbeat Interval: NA
Heartbeat always: False
Encoding: self-describing-gpb
Num of collection: 0
Collection time: Min: 0 ms Max: 0 ms
Total time: Min: 0 ms Avg: 0 ms Max: 0 ms
Total Deferred: 0
Total Send Errors: 0
Total Send Drops: 0
Total Other Errors: 0
No data Instances: 0
Sensor Path: Cisco-IOS-XR-wdsysmon-fd-oper:system-monitoring/cpu-utilization
Sysdb Path: /oper/wdsysmon_fd/gl/*
Count: 0 Method: Min: 0 ms Avg: 0 ms Max: 0 ms
Item Count: 0 Status: Active
Missed Collections:0 send bytes: 0 packets: 0 dropped bytes: 0
Missed Heartbeats:0
success errors deferred/drops
Gets 0 0
List 0 0
Datalist 0 0
Finddata 0 0
GetBulk 0 0
Encode 0 0
Send 0 0
One of the most important pieces of information is the “Collection Time”.
Simply put, you can’t set a collection, in this case, of 20 seconds, if it takes more than that to collect the data. You end up having “missed collections”, and that is very bad. So always remember that.
The other important factor is to not collect more than what you need. If 20s datapoints are good enough for you, by making your router less busy collecting this data, you also save database and collector cycles to process more important information for your business that may need more aggressive collections.
If not clear yet, please remember this, you can negatively affect your whole architecture by collecting more data than you need. Avoid that as much as possible!
“Total time” is often misunderstood but is extremely important. This metric includes the encoding time of the data being requested on the box + the time it takes to send the data. From TCP perspective, it means we are also including the time for the collector to ACK the data.
The most common causes of large “Total time” for subscriptions are:
- Network congestion
- Bandwidth delay product
- TCP buffering
- ACK delay
And this is where most people spend time debugging issues. Having an optimized configuration, as well as a great collector, will help avoid all these problems.
It’s not uncommon to see a collection time of a few milliseconds, and a collection time of several seconds!
Optimization
What is also very important is the sensor-path itself.
This model in particular is very simple. Let’s examine it:

There are two main lists. “cpu-utilization” under system-monitoring container, which contains the overall cpu usage for a “node-name” by one, five and fifteen minutes. Also, “process-cpu” which contains the same info for each “process-name” and a “process-id”.
Scaling wise, it is very important to understand the model, and how far down your sensor-path is specified.
Let’s say for example that I am not interested in the overall cpu usage. I can very well instead of specifying “Cisco-IOS-XR-wdsysmon-fd-oper:system-monitoring/cpu-utilization” as my sensor-path, go with “Cisco-IOS-XR-wdsysmon-fd-oper:system-monitoring/cpu-utilization/process-cpu”.
This will effectively save the router resources and reducing the amount of unnecessary data needed for the time-series database.
Note I am using this model just because of simplicity to explain the concept – the biggest savings come from more complex models that contain larger amounts of data, like say a BGP model with hundreds of neighbors will surely generate more data, and very considerably in each router.
In general, the recommendation is to be very specific in your sensor-paths, so the gather point of data is as effective as possible.
IOS-XR also has in 7.2.1, what we call leaf-level streaming. Imagine that you may not actually need anything but a specific datapoint. You can also choose that as your strategy to save resources. All you need is to specify the full sensor-path including the leaf you’re interested on.
Here’s an example of a sensor-path used to collect only the total-cpu-one-minute metric from the device:
“Cisco-IOS-XR-wdsysmon-fd-oper:system-monitoring/cpu-utilization/total-cpu-one-minute”.
As seen above, total-cpu-one-minute is a 32bit int value only (a leaf) of the model. Subscribing to this path will result in a massive saving of data and processing. All the per-process usage information is simply removed from the equation, and your database will thank you!
The subscription is also of extreme importance when it comes to scale, as each is effectively a client that will request the information to the process owners of the data.
If the same underlying path is being requested on multiple subscriptions, that means you’re requesting the same data multiple times. See below what a bad example looks like:
sensor-group CPU
sensor-path Cisco-IOS-XR-wdsysmon-fd-oper:system-monitoring/cpu-utilization
!
subscription CPU-for-collector-1
sensor-group-id CPU sample-interval 20000
destination-id collector-1
!
subscription CPU-for-collector-2
sensor-group-id CPU sample-interval 20000
destination-id collector-2
!
Instead, optimize it to look like so:
sensor-group CPU
sensor-path Cisco-IOS-XR-wdsysmon-fd-oper:system-monitoring/cpu-utilization
!
subscription CPU
sensor-group-id CPU sample-interval 20000
destination-id collector-1
destination-id collector-2
!
Now only one internal request is made, and a copy is sent over to each collector.
Just note, it’s not a good idea to clutter your router busy sending the data to several collectors.
Ideally, either the collector or a Kafka bus can be implemented to distribute the data to different databases if that’s what’s needed.
To finish off when it comes to configuration, keep in mind that if you want very specific data, you should use regex and keys to filter your data even more.
Let’s say I want to monitor cpu utilization for a specific process, for a specific node (in this case 0/RP0/CPU0). You would use the following sensor path:
sensor-path Cisco-IOS-XR-wdsysmon-fd-proc-oper:process-monitoring/nodes/node[node-name=0/RP0/CPU0]/process-name/proc-cpu-utilizations/proc-cpu-utilization[process-name=bgp]
As seen above, this will stream off only the bgp cpu utilization. Pretty cool!
Regex could also be used like so:
sensor-path Cisco-IOS-XR-wdsysmon-fd-proc-oper:process-monitoring/nodes/node[node-name=0/RP*]/process-name/proc-cpu-utilizations/proc-cpu-utilization[process-name=bgp]
Strict timer
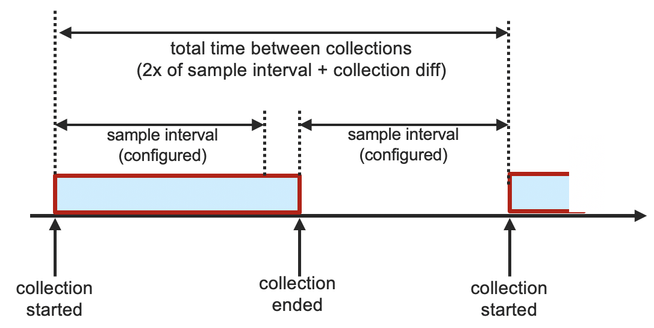
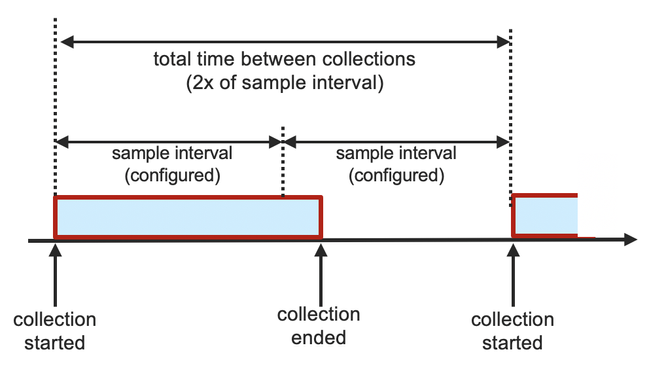
The concept of a “missed collection” is simply the idea of not being able to capture the data fast enough based on the sample-interval. You should never have missed collections. This will cause delay and loss of metrics.
Below a sample figure showing the behavior of collections without and with strict-timer configured.
--------------- Without strict timer ---------------
--------------- With strict timer ---------------
The strict timer can be configured for all subscriptions, or defined per-subscription, as follows:
telemetry model-driven
strict-timer
subscription LPTS
sensor-group-id LPTS strict-timer
Some more verification
Below you can see how the emsd process has a thread per subscription (named mdt_wkr_tp_<SubscriptionName>), and those will be the ones collecting the data via SysDB according to their respective sample intervals.
The remaining “mdt_wkr_tp_[0-7]” threads are separated for gNMI subscriptions, which will have their own pool of threads for that transport type.
RP/0/RP0/CPU0:8201# show process emsd | include mdt_wkr
1107 10053 0K 20 Sleeping mdt_wkr_tp_0 0
1107 10054 0K 20 Sleeping mdt_wkr_tp_1 0
1107 10055 0K 20 Sleeping mdt_wkr_tp_2 0
1107 10056 0K 20 Sleeping mdt_wkr_tp_3 0
1107 10057 0K 20 Sleeping mdt_wkr_tp_4 0
1107 10059 0K 20 Sleeping mdt_wkr_tp_5 0
1107 10060 0K 20 Sleeping mdt_wkr_tp_6 0
1107 10064 0K 20 Sleeping mdt_wkr_tp_7 0
1107 25826 0K 20 Sleeping mdt_wkr_LPTS 0
1107 25827 0K 20 Sleeping mdt_wkr_MEMORY 0
1107 25828 0K 20 Sleeping mdt_wkr_OPTICS 0
1107 25846 0K 20 Sleeping mdt_wkr_INVENTO 0
1107 12268 0K 20 Sleeping mdt_wkr_INTS 0
1107 12270 0K 20 Sleeping mdt_wkr_ISIS 0
1107 12271 0K 20 Sleeping mdt_wkr_LACP 0
1107 4450 0K 20 Sleeping mdt_wkr_CPU 0
1107 2928 0K 20 Sleeping mdt_wkr_AREA51- 0
1107 4592 0K 20 Sleeping mdt_wkr_CDP 0
There’s no limit of threads to be created, but one must take into consideration the previous factors mentioned to ensure maximum performance, and not end up creating unnecessary threads.
The Collector
The collector can be used by pulling the following repo: Real Time Network Monitoring.
At higher scale, you will notice that single-threaded collector systems just can’t handle the load. Creating multiple separated instances of collectors like pipeline, bring another set of issues, as each instance would be uploading separately to the database, possibly creating more overhead than necessary. It can easily grow out of hand.
As part of this exercise, we are using a multi-processing collector that has been created to overcome this known limitation.
The architecture is laid out below for the dial-in case.
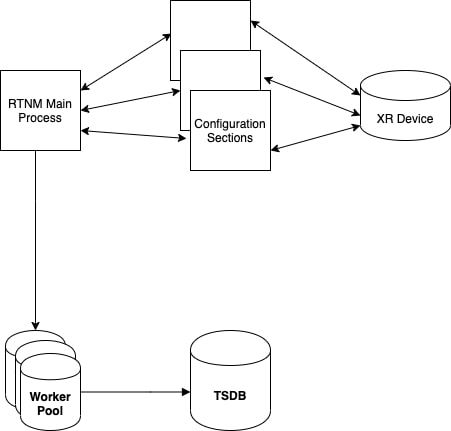
- The input section of the config will determine the mode.
- For dial-in method, each section of the config is a separate process.
- For dial-out method, a process will be created per core where the collector is running.
- A gRPC channel is created.
- When data is flowed from the device to the process, it is added to a queue in which the main process batches the data and sends it to a worker pool.
- The worker pool parses and uploads the data.
For the dial-out case, a process per core is forked to serve incoming TCP connections. Note that each subscription defined will also be a separate socket to the collector. Below an example of 9 active subscriptions towards a dial-out collector instance.
RP/0/RP0/CPU0:8201#show telemetry model-driven destination dial-out-server-3-inband-ipv4 | in "Subscription: "
Subscription: CDP
Subscription: CPU
Subscription: MEMORY
Subscription: OPTICS
Subscription: INTS
Subscription: ISIS
Subscription: LACP
Subscription: INVENTORY
Subscription: LPTS
RP/0/RP0/CPU0:8201#show telemetry model-driven destination dial-out-server-3-inband-ipv4 | in "Subscription: " | util wc -l
9
RP/0/RP0/CPU0:B-PSW-1#show tcp brief | in :6666
0x000055b67ff6e528 0x60000000 0 0 192.168.1.4:47432 10.80.137.45:6666 ESTAB
0x00007f98ac0db9b8 0x60000000 0 0 192.168.1.4:37420 10.80.137.45:6666 ESTAB
0x000055b67ff50118 0x60000000 0 0 192.168.1.4:52212 10.80.137.45:6666 ESTAB
0x00007f98a80b4008 0x60000000 0 0 192.168.1.4:29809 10.80.137.45:6666 ESTAB
0x00007f98a0093e38 0x60000000 0 0 192.168.1.4:38220 10.80.137.45:6666 ESTAB
0x00007f98a81c16d8 0x60000000 0 0 192.168.1.4:44486 10.80.137.45:6666 ESTAB
0x00007f98a003c318 0x60000000 0 0 192.168.1.4:56805 10.80.137.45:6666 ESTAB
0x000055b67ff06538 0x60000000 0 0 192.168.1.4:16063 10.80.137.45:6666 ESTAB
0x00007f98ac221278 0x60000000 0 0 192.168.1.4:26811 10.80.137.45:6666 ESTAB
RP/0/RP0/CPU0:8201#show tcp brief | in :6666 | util wc -l
9
This decoupling strategy allows RTNM to handle GBs of data a second all the while having robustness.
InfluxDB
About InfluxData
InfluxData is the creator of InfluxDB, the leading time series platform. We empower developers and organizations to build transformative IoT, analytics and monitoring applications. Our technology is purpose-built to handle the massive volumes of time-stamped data produced by sensors, applications and computer infrastructure. Easy to start and scale, InfluxDB gives developers time to focus on the features and functionalities that give their apps a competitive edge.
About InfluxDB
InfluxDB Cloud is a fully-managed, elastic time series data platform. InfluxDB is purpose built to handle all time-stamped data, from users, sensors, applications and infrastructure — seamlessly collecting, storing, visualizing, and turning insight into action. With a library of more than 250 open-source plugins, importing and monitoring data from any system is easy. InfluxDB is also available in a self-managed Enterprise version built for production workloads or as a self-hosted open source version designed for trials and proofs of concept.
Technical Configuration Changes
Below are the changes InfluxData suggested when we needed more write flexibility. `[...]` denotes TOML configuration blocks that are present in all InfluxDB (Enterprise for `[cluster]`configuration files:
[data]
cache-max-memory-size = 85899345920 # default 1GB
cache-snapshot-memory-size = 52428800 # default 25MB
[cluster]
allow-out-of-order-writes = true # default “false”
index-version = "tsi1" # default “inmem”
`cache-max-memory-size`: This field denotes the size of the write cache or "buffer". When a write (or ideally batch of writes) hits the write API, data is persisted to a write-ahead-log and simultaneously to this cache to make data immediately queryable. Large write workloads require more of a buffer (large cache) at the time of ingestion...so we increase this size.
`cache-snapshot-memory-size`: This field is a factor in when data is "snapshotted" (sync'ed from the cache to an immutable on-disk TSM file). When this value is reached, a snapshot of this size is taken.
`allow-out-of-order-writes`: This field allows for better Hinted Handoff Queue draining. It’s mostly used to ensure writes are written in the order in which they are received, which is only important when fields would be updated, hence not the case for telemetry data which would always contain new timestamps.
`index-version`: This determines what type of Indexing InfluxDB uses. There are two. The default is the in-memory which means that the entire index of all your time series is held in memory. TSI ("tsi1") is the Time Series Index and is an index that flushes series keys to disk when they are not being used.
Database statistics and Health
After setting up your scaled system, chronograph can be used to monitor stats of the overall health.
The entire dashboard can be downloaded here: InfluxDB Dashboard
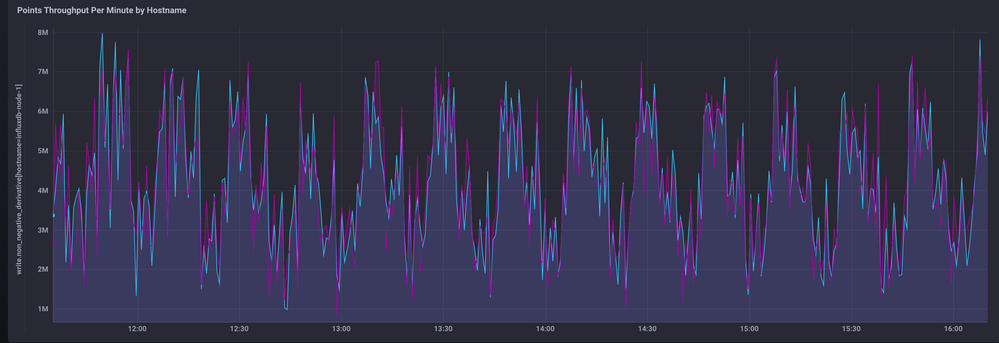
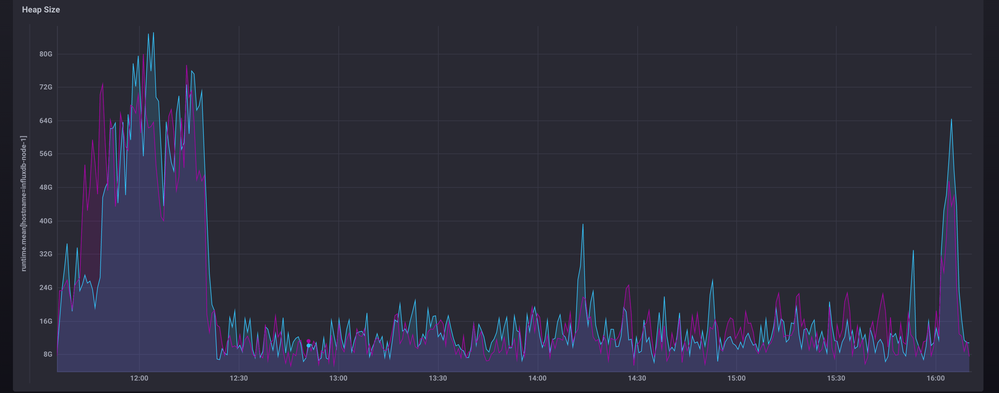
A couple of screenshots below showing the scale of the setup over a few hours running on node-1 of the cluster.
Points throughput per minute by hostname
Query: SELECT non_negative_derivative(max("pointReq"), 60s) FROM :database:../write/ WHERE time > :dashboardTime: GROUP BY time(:interval:), "hostname"
Series cardinality and measurement by database
Query: SELECT max("numSeries") AS "Series Cardinality" FROM :database:../database/ WHERE time > :dashboardTime: GROUP BY time(:interval:), "database" fill(null)
Heap size
Query: SELECT mean("HeapInUse") FROM :database:../runtime/ WHERE time > :dashboardTime: GROUP BY time(:interval:), "hostname" fill(null)
Closing comments
This document was written as a learning exercise by InfluxData and a team at Cisco that was looking at how to improve performance of telemetry data to be ingested and uploaded at highest possible speeds.
This is not meant to be a one-size-fits-all approach, but a great starting point for companies and teams looking to the main performance aspects of implementing telemetry collection at more than 1, 2 or a few dozen routers.
- Mark as Read
- Mark as New
- Bookmark
- Permalink
- Report Inappropriate Content
Hi,
Thanks for a excellent document. But since you mention some very important details to be aware about you don't mention if there is a way (Yang model) to monitor those very important pieces.
So my question is based on the fact that all performance issues that seems to be below the limits when you implement your yang models for the metric needed will change over time when there is more and more enabled interfaces (phys or virt.) and more and mor LC's in the chassis. So suddenlu the very important details is breached.
Therefor is ther a way to monitor
One of the most important pieces of information is the “Collection Time”.
“Total time” is often misunderstood but is extremely important
You should never have missed collections. This will cause delay and loss of metrics.
I'm sure this is key vmetrics to monitor and react on over the elements lifetime.
Regards,
/Owe
Find answers to your questions by entering keywords or phrases in the Search bar above. New here? Use these resources to familiarize yourself with the community:
