- Cisco Community
- Technology and Support
- Cisco Software
- Cisco ONE Discussions
- High CPU utilization IP input on cisco 2811
- Subscribe to RSS Feed
- Mark Topic as New
- Mark Topic as Read
- Float this Topic for Current User
- Bookmark
- Subscribe
- Mute
- Printer Friendly Page
High CPU utilization IP input on cisco 2811
- Mark as New
- Bookmark
- Subscribe
- Mute
- Subscribe to RSS Feed
- Permalink
- Report Inappropriate Content
07-30-2018 11:23 PM
Hi, Having a problem with high CPU on 2811: #sho processes cpu | exclude 0.00% CPU utilization for five seconds: 49%/26%; one minute: 52%; five minutes: 48% PID Runtime(ms) Invoked uSecs 5Sec 1Min 5Min TTY Process 131 1354454956 1128313855 1200 10.39% 11.21% 9.92% 0 IP Input 139 798357428 1236499248 645 6.55% 6.83% 6.05% 0 L2X Data Daemon 181 286394200 497774175 575 2.31% 2.60% 2.31% 0 PPP Compress Inp 102 29773660 1262530741 23 1.03% 1.00% 0.98% 0 Ethernet Msec Ti 5 92509796 7043817 13133 0.95% 0.29% 0.20% 0 Check heaps 305 12471612 1354674760 9 0.31% 0.28% 0.28% 0 PPP manager 127 7461428 1365071506 5 0.23% 0.19% 0.18% 0 IPAM Manager 308 6786200 1828502811 3 0.23% 0.21% 0.22% 0 COMPORT 318 468 265 1766 0.23% 0.20% 0.06% 514 Virtual Exec 233 54991900 39321494 1398 0.15% 0.09% 0.08% 0 Crypto IKMP 313 7962952 1354817564 5 0.15% 0.14% 0.15% 0 PPP Events 162 1013624 54266740 18 0.07% 0.03% 0.02% 0 CEF: IPv4 proces 101 2138240 266436733 8 0.07% 0.03% 0.02% 0 Ethernet Timer C
- Labels:
-
Cisco ONE
- Mark as New
- Bookmark
- Subscribe
- Mute
- Subscribe to RSS Feed
- Permalink
- Report Inappropriate Content
07-30-2018 11:24 PM
- Mark as New
- Bookmark
- Subscribe
- Mute
- Subscribe to RSS Feed
- Permalink
- Report Inappropriate Content
07-30-2018 11:51 PM
- Mark as New
- Bookmark
- Subscribe
- Mute
- Subscribe to RSS Feed
- Permalink
- Report Inappropriate Content
07-31-2018 09:53 PM - edited 07-31-2018 09:56 PM
CPU utilization for five seconds: 61%/40%; one minute: 65%; five minutes: 64%
PID Runtime(ms) Invoked uSecs 5Sec 1Min 5Min TTY Process
131 1358432612 1131266146 1200 9.91% 10.20% 10.30% 0 IP Input
139 800878776 1239503251 646 6.00% 6.13% 6.34% 0 L2X Data Daemon
181 287138560 499111737 575 2.39% 2.59% 2.54% 0 PPP Compress Inp
102 29835760 1272803263 23 1.11% 1.06% 1.04% 0 Ethernet Msec Ti
305 12509636 1357207666 9 0.31% 0.30% 0.30% 0 PPP manager
313 7987148 1357350734 5 0.15% 0.15% 0.15% 0 PPP Events
127 7482800 1367596152 5 0.15% 0.19% 0.18% 0 IPAM Manager
308 6816300 1832550619 3 0.15% 0.22% 0.23% 0 COMPORT
251 1481024 219601878 6 0.07% 0.02% 0.02% 0 Atheros LED Ctro
233 55088588 39401701 1398 0.07% 0.10% 0.08% 0 Crypto IKMP
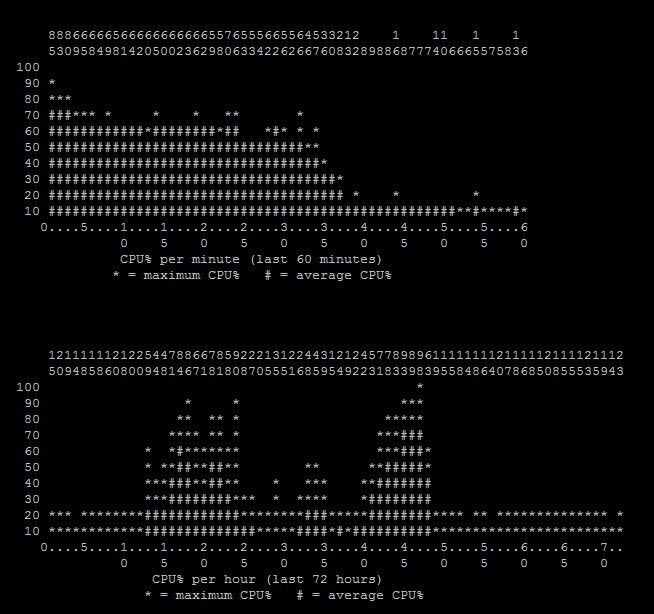
KHI-DC#sh processes cpu history
- Mark as New
- Bookmark
- Subscribe
- Mute
- Subscribe to RSS Feed
- Permalink
- Report Inappropriate Content
08-01-2018 12:03 AM
- Mark as New
- Bookmark
- Subscribe
- Mute
- Subscribe to RSS Feed
- Permalink
- Report Inappropriate Content
08-01-2018 12:27 AM
System image file is "flash:c2800nm-advsecurityk9-mz.151-3.T4.bin"
- Mark as New
- Bookmark
- Subscribe
- Mute
- Subscribe to RSS Feed
- Permalink
- Report Inappropriate Content
08-01-2018 12:46 AM
Discover and save your favorite ideas. Come back to expert answers, step-by-step guides, recent topics, and more.
New here? Get started with these tips. How to use Community New member guide