- Cisco Community
- Technology and Support
- Online Tools and Resources
- Cisco CLI Analyzer
- Cisco CLI Analyzer
- Using the Packet Capture Tool on the CLI Analyzer
- Subscribe to RSS Feed
- Mark Topic as New
- Mark Topic as Read
- Float this Topic for Current User
- Bookmark
- Subscribe
- Mute
- Printer Friendly Page
Using the Packet Capture Tool on the CLI Analyzer
- Mark as New
- Bookmark
- Subscribe
- Mute
- Subscribe to RSS Feed
- Permalink
- Report Inappropriate Content
02-27-2017 09:32 AM
[toc:faq]
Background
The introduction of version 3.2.1 of the CLI Analyzer comes with several additions granting customers more diagnostic capabilities to manage their Cisco devices more effectively. This post is to discuss the Packet capture tool, a new addition to the CLI analyzer, the value that it will bring to you, and the challenges that it addresses. We will go through sample workflows in which we hope will encourage you to utilize this tool while using the CLI analyzer.
The Packet Capture tool was designed to streamline the process involved in configuring packet capture sacross different platforms. From defining initial parameters of a capture to providing an overallsummary of packets collected, we take the nuances out of the setup process by asking the user a fewsimple questions to configure their devices with the respective feature. If you find yourself asking questions like “what packet capture features are available for my router?” or “how do I capture packetsflowing through my device to this specific subnet?” then this tool can help you get started! The PacketCapture tool currently supports IOS based routers and switches, IOS-XE based routers and switches, NX-OS based switches, and the ASA.
You can download the CLI Analyzer here!
Getting Started
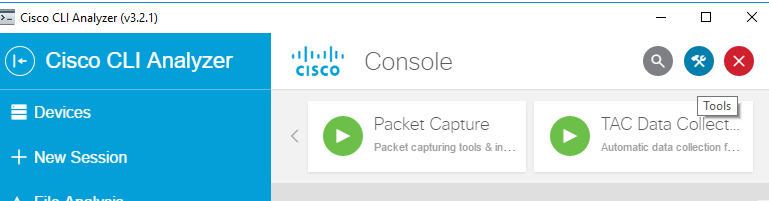
To get started with the Packet Capture tool from the CLI Analyzer client, click the Packet Capture iconfrom the tool list. This tool list can be expanded from the following icon:

As part of the initial step of the CLI analyzer, we use the device details collected to determine the available packet capturing utilities for that platform. For instance, on a Nexus5000 switch, the tool would populate the configuration form for Ethanalyzer. On the other hand, if using an ASR1000 router, the tool would populate the configuration form for Embedded Packet Capture (pictured below):

Running the Tool
We want to emphasize that this tool will never make any configuration changes without the user’s consent. The scope of any configuration change made by this tool will typically be in the context of an access-list or some type of filter that will be applied to the capture itself and should not have any service impact on the traffic flows itself.
Once the tool is ran and user inputs are gathered of what type of traffic they want to collect, a result will be populated in the Tool Results tab of the exact changes that were made. Here is an example for an IOS-XE capture being ran:

Notice that a unique access-list is pre-populated for this capture and we capture traffic for a flow in both directions. This is because it is often useful to look at not how long how a device behaves in a single direction but also how it might react to response traffic.
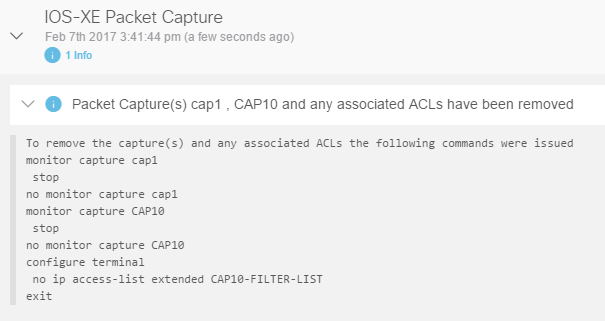
Not sure how to stop and remove the capture? Don’t worry! The user is also given the option to remove anything that might have been configured by clicking on the Packet Capture tool again and selecting the appropriate option to remove the configured captures:

The tool result will populate the CLI result we used to achieve this operation so you can always review what was done configuration wise:
Tool Results and Analysis
Providing the user with a simplified interface was not the only design focus of this tool. The post analytics and ease of exporting the captured results of a quick and easy PCAP file are some of the key features provided by this tool.
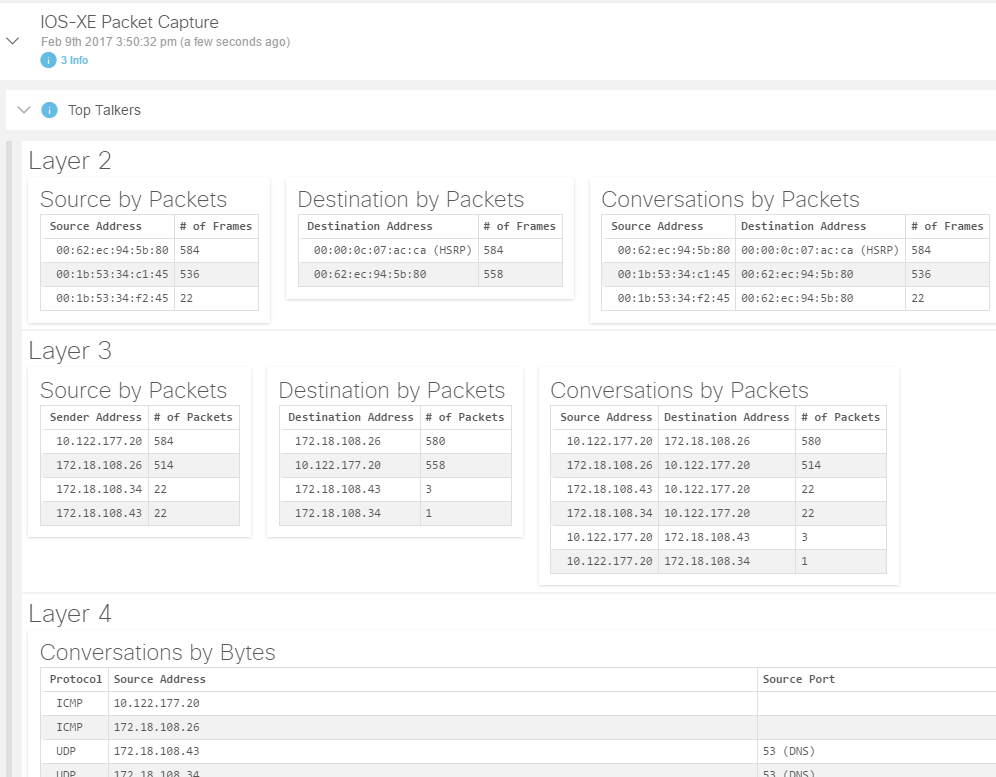
After decoding a capture, the tool will provide you a summary of the captured packets and breakdown a list of the top talkers by each layer allowing for quicker analysis of the flows captured:
Are you looking for a deeper understanding of traffic captured? Download the PCAP straight to your PC and open it up with your favorite network protocol analyzer:

Use Case Example with NetDR
In this example, we will step through the workflow options with the Packet Capture tool for a 7600 using NetDR feature. After clicking the Packet Capture Tool, the tool will guide you to the NetDr capture form prompting for a list of options based on what the user decides to do. A brief description of NetDR and link to feature documentation is provided for additional information on some of the configurable fields:
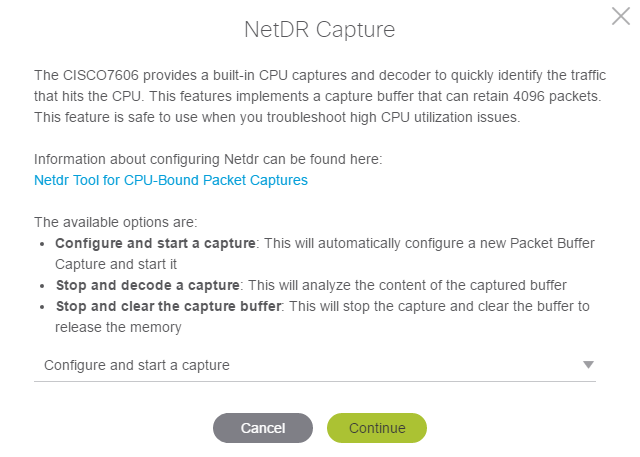
When we select the 1st option – “Configure and start a capture”, the next form prompts for basic questions about the traffic the user wishes to capture.
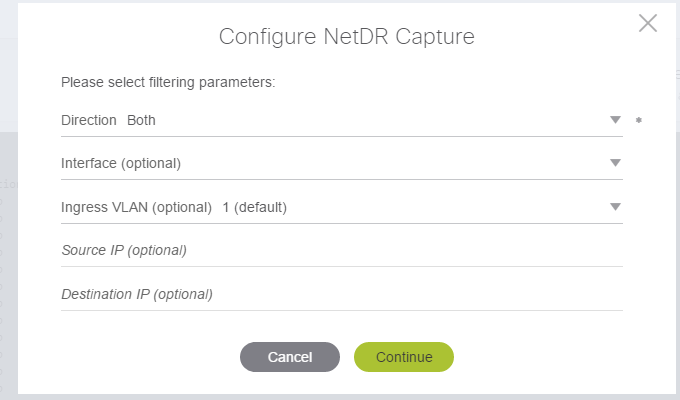
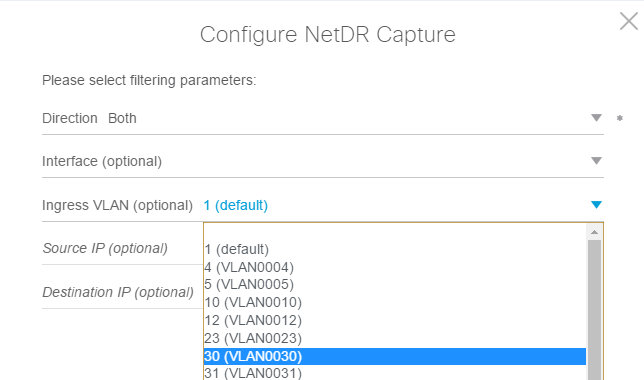
The fields with the dropdowns will be populated based on the available information that was pulled from the 7600 through ‘show’ commands collected in the background:
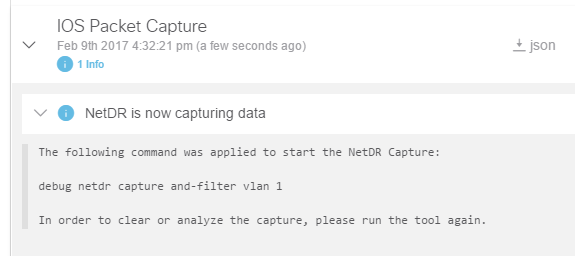
After populating the appropriate fields with input and clicking continue, we are provided with the tool results of the command was executed to start the NetDR capture:
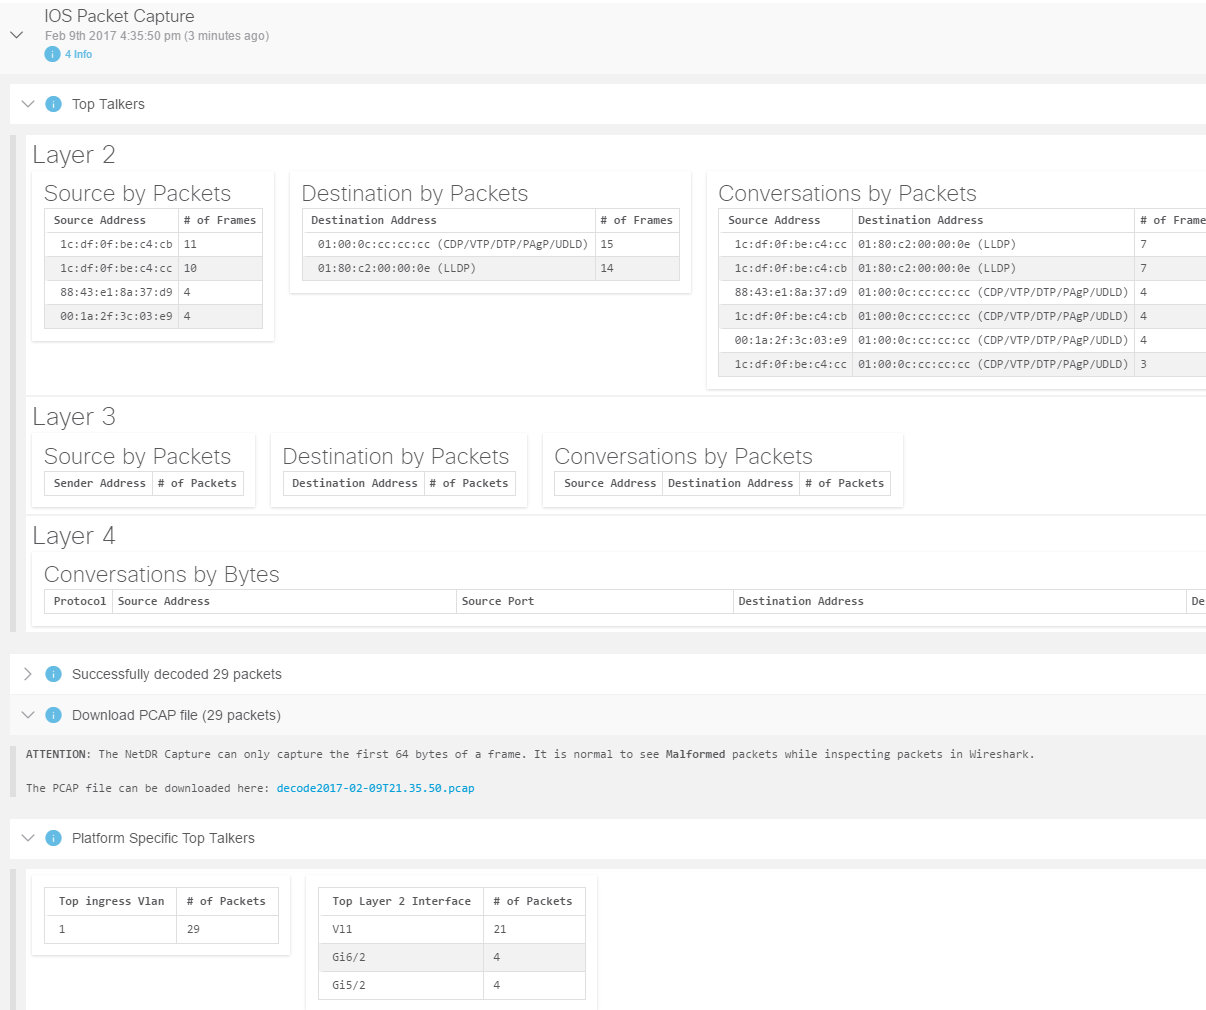
When ready to decode the contents of the packets we captured, we run the Packet Capture tool again and select the 2nd workflow option – “Stop and decode a capture”. Here we do a breakdown of all the packets captured by NetDR destined to the CPU on VLAN and provide a breakdown of the L2 information:
The 3rd and final workflow option is the “Stop and clear the capture buffer” – when you want to remove any existing NetDR captures, selecting this workflow option will execute these commands and the resulting tool list will show the following:

Use Case Example with Embedded Wireshark
This example will show the example workflows using the Packet Capture tool with a 4500/Sup7E. As before, as soon as the CLI analyzer has identified once the device details, click on the Packet Capture icon from the tool list to get started. You will notice that the presented form will ask you what kind of capture to configure. This is because the 4500 has two distinct captures available on this platform – this being CPU queue debugging and Embedded Wireshark.
Selecting CPU Capture will invoke a workflow for CPU Queue Debugging feature similar to NetDR presented in the earlier scenario. In this example, we will focus on the Interface Capture workflow that will invoke the Embedded Wireshark form.
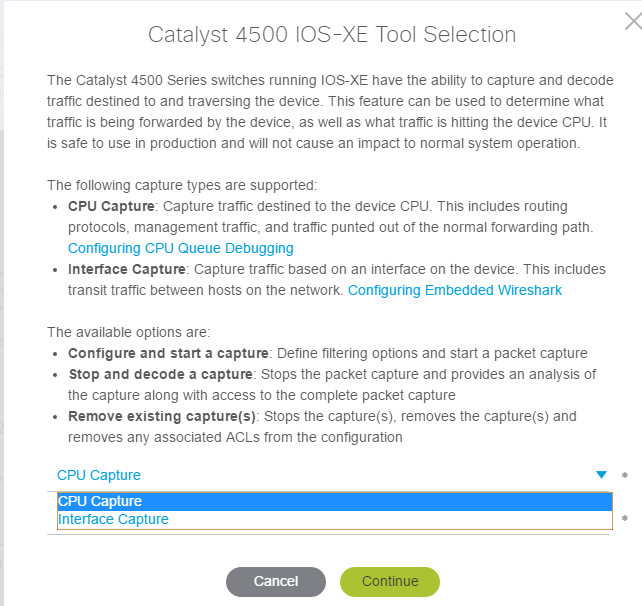
There are three workflow options available for the 4500 selector tool. By selecting “interface capture” and “configure and start a capture”, a form will be prompting the user for required inputs used by Embedded Wireshark:

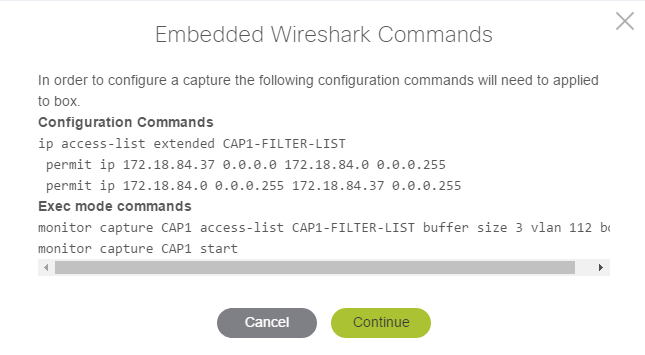
As before, the tool will prompt the user before making any configuration changes and also provide an output for what changes will be made. Notice that the CAP1-FILTER-LIST access list will populate an entry for both directions:
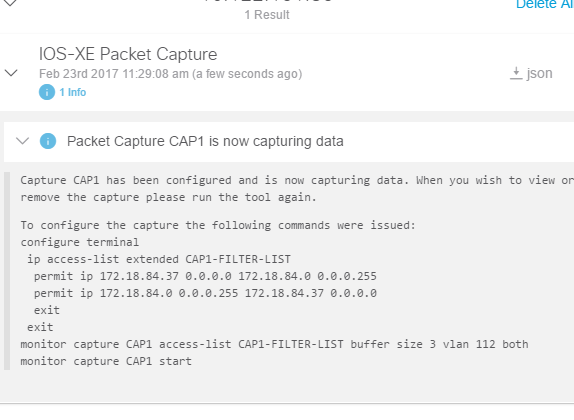
The tool results will show the list of configuration commands and should maintain a history so you can always come back and review what changes were made:
In this next picture, we show a sample flow to a device within the same subnet. By re-running the tool again, you can decode the capture by selecting the “interface capture” and “stop and decode a capture” workflow option. From the result list, the tool will populate a similar result as the NetDR example with top talker entries, an overall snapshot of the conversation of packets, and an option to download the PCAP file:

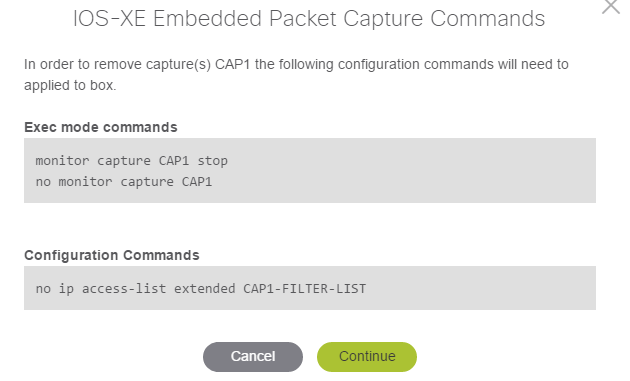
The final workflow option is to remove any configuration that was configured previously by selecting “interface capture” and “remove an existing capture”. If you have multiple captures configured, you may notice that the option exists to remove multiple captures with this tool by selecting the captures individually to for removal (not pictured). As always, the tool will prompt you on the list of commands it wants to run before making any changes so you can always review what will be done:

Closing notes
The design of the Packet Capture Tool is intended to simplify the complexities involved in running packet captures. We hope that the versatility in platform support and the simple workflow options guide you to quicker diagnosis of problems during the troubleshooting of a network problem. We are continuously improving this tool and hope to expand on more platforms and features in the future. Please feel free to post a reply if there are any questions or if there are any further clarifications needed.
A live demonstration was made of this here:https://cway.cisco.com/tools/CaptureGenAndAnalyse/
- Labels:
-
Cisco CLI Analyzer
- Mark as New
- Bookmark
- Subscribe
- Mute
- Subscribe to RSS Feed
- Permalink
- Report Inappropriate Content
10-16-2020 08:27 AM
I tried this recently on a 3650 switch running 16.6.8. Two concerns: the commands issued always capture traffic in one direction only; the captured packets aren't accurate. Wireshark flags "Bad length value nnn > IP payload length." The truth is, there is nothing wrong with the packets.
If I set up the monitor capture manually, the capture file is accurate.
- Mark as New
- Bookmark
- Subscribe
- Mute
- Subscribe to RSS Feed
- Permalink
- Report Inappropriate Content
12-07-2020 07:37 AM
We exchanged a few emails.
1) The problem with the unidirectional capture was because capturing is done on a L2 VLAN. At the time of development, embedded wireshark only allowed for capturing on the ingress direction for a capture on nova releases (pre-16.x):
- VLANs—When a VLAN is used as a Wireshark attachment point, packets are captured in the input direction only.
As of 16.1 in above, embedded wireshark was extended to allow for capturing in both directions:
VLANs—Starting with Cisco IOS Release 16.1, when a VLAN is used as a Wireshark attachment point, packet capture is supported on L2 and L3 in both input and output directions.
At this time, the packet capture module within the CLI analyzer still assumes ingress capturing is only allowed for vlans so setting a bi-directional capture on a vlan will need to be done manually.
2) We noted a decoding problem for the captures via the tool and have corrected this.
Discover and save your favorite ideas. Come back to expert answers, step-by-step guides, recent topics, and more.
New here? Get started with these tips. How to use Community New member guide