- Cisco Community
- Technology and Support
- Security
- Endpoint Security
- Cisco AMP - 100% usage of CPU
- Subscribe to RSS Feed
- Mark Topic as New
- Mark Topic as Read
- Float this Topic for Current User
- Bookmark
- Subscribe
- Mute
- Printer Friendly Page
Cisco AMP - 100% usage of CPU
- Mark as New
- Bookmark
- Subscribe
- Mute
- Subscribe to RSS Feed
- Permalink
- Report Inappropriate Content
06-21-2019 02:08 AM - edited 02-20-2020 09:09 PM
Hi,
We are seeing lot of issues coming from windows devices - 100% CPU utilization by AMP. what are the primary steps we have to take to control the CPU usage. what we doing in this cases are
- We are checking the connector versions(if it a old we are updating with new version)
- Mannual policy sync
- and checking for the exclusions
Some times it is with the same 100% usage even we did the above activities.
Please can anyone help on this. what other action / checkes we can do to reduse the CPU usage
Regards,
Chandu
- Labels:
-
Endpoint Security
- Mark as New
- Bookmark
- Subscribe
- Mute
- Subscribe to RSS Feed
- Permalink
- Report Inappropriate Content
06-22-2019 02:17 PM - edited 06-22-2019 02:18 PM
Hi Chandu,
My name is Luis from the Advance Threat Security team.
When the CPU of the endpoint is high due to AMP, I would recommend following these steps:
1) Verify if another AV is running on the machine.
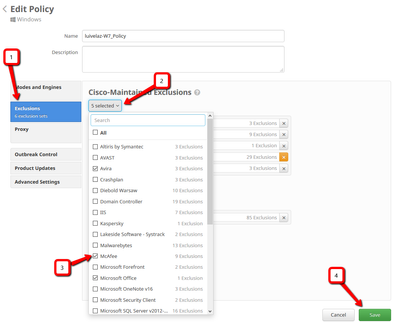
a. If there is other, the recommendation is to exclude the main process of the AV in the policy of AMP, along with the usage of the Cisco-Maintained exclusion lists that are relevant to the usage of the endpoints.
b. To see the lists and apply the Cisco maintained exclusion, you only need to go on https://console.amp.cisco.com/dashboard to "Management -> Policies -> Edit (The policy of the endpoints) -> Exclusions -> Cisco-Maintained Exclusions"
Select the ones your endpoint would need based in the software currently on the machine, and save the policy.
2) Try to identify if the high CPU state, happen when using a specific application.
a. Identifying if the issue happen with one application or a few of them, as well as if we are able to replicate the issue at will, this helps in the process of identifying potential exclusions.
3) Start the process of gathering debug bundle for analysis and tune exclusion.
a. To do so, we will need to enable debug logging for AMP.
i. If we are able to reproduce the issue and have access to the endpoint, the best procedure to capture the debug bundle is the following:
-
Open AMP GUI
-
Go to Settings.
-
Scroll to the bottom of the GUI and open "Cisco AMP Connector Settings"
-
Click on "Enable Debug Logging" (Debug Logging Status should change to “Started”)
-
Recreate the issue a couple of times and let it run for 20-30 minutes, so AMP gather the necessary logs.
-
Collect the bundle by executing the “ipsupporttool.exe” located in C:\Program Files\Cisco\AMP\6.3.1(Current version of AMP running on the system)
-
This will create a .7z in the desktop, named "CiscoAMP_Support_Tool_%date%.7z", this bundle contain the logs to identify potential exclusions.
ii. If we don't have acces to the machine or the issue is persistent (It doesn't seem to be related to a specific application) or the high CPU happens sporadicly, we will want to enable debug logging by policy.
a. To enable debug logging by policy go to "Management -> Policies -> Edit -> Advanced Settings -> Connector Log Level & Tray Log Level -> Debug "
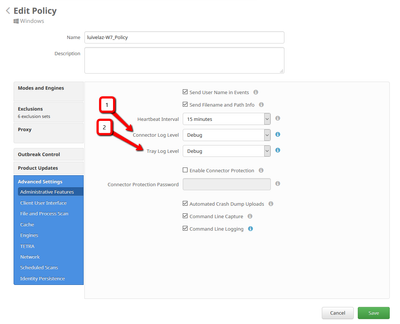
b. Once with the debug configured in the policy, to ensure the policy is applied to the endpoint we can wait the "Heartbeat Interval" or we can perform a manual sync.
c. Wait till the state of High CPU happens on the system and then gather the bundle
d. To gather the bundle, just run the "ipsupporttool.exe" located on the Path "C:\Program Files\Cisco\AMP\6.3.1(Current Version of AMP running on the system)" this will create a .7z file on the system named "CiscoAMP_Support_Tool_%date%.7z",
4) Submit the Bundle for analysis
a. Once the bundle is collected, you can open a TAC case with us and we will help you with the process of analysing the logs and suggest potential exclusions, upload the bundle to the case and please be sure to also include the information of the steps 1) and 2).
4.1) Make the analysis
a. Also, if you want to do it yourself, the script on this other Community post can help you, Review Scanned Files from AMP, the name of the script for windows is "amphandlecount.txt" and it's on the bottom of the page.
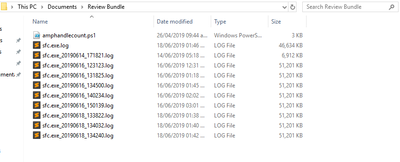
a) To run the script in Windows, rename it to "amphandlecount.ps1"
b) Copy the .ps1 to a folder of his own, for convenience.
c) Unzip the "CiscoAMP_Support_Tool_%date%.7z" file and identify the "sfc.log"'s files on the path CiscoAMP_Support_Tool_2019_06_13_18_26_37\Program Files\Cisco\AMP\6.3.1(Current version of AMP installed)
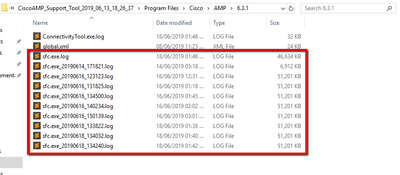
e) Run the .ps1 with PowerShell, a PowerShell window will open and depending on the execution policy on the endpoint it will prompt you for permission to run.
f) Allow the powershell to finish (It might take some time, depending on how many sfc.log are in the folder) after the powershell is finish, you will have something like this:
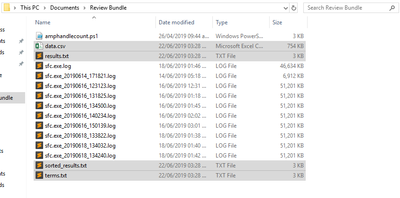
a. "Sorted_results.txt" will contain the list of processes that are being scanned by AMP, but only by name.
b. "data.csv" contain the full path of the files scanned and the father process which created/modified/moved the file.
c. By filtering the process name with a high count from the "Sorted_results.txt" in the "data.csv" we can identify the parent process, the full path, and then proceed with adding an exclusion to the policy in a custom list.
NOTE: Depending the type of exclusions, here you can find more information related to exclusions. Best practices for AMP for Endpoints
d. It will look like this:
1) Process to look
2) Cntrl + F on "data.csv" and search
3) Path of the file scanned by AMP
4) Path of the parent process that copy/moved/modified the file
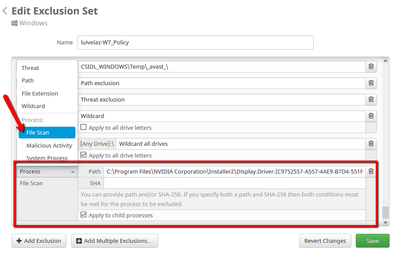
Note: Usually the exclusion we are pursuing will be of the type "Process: File Scan" with "Child Processes include" for the parent process that is getting the scans:
Now, just add the exclusions to the policy and do a manual sync on the endpoint to apply the policy or wait till the Heartbeat interval passes and test the behavior again.
This process in some cases would need to be performed several times in order to get the best results.
Please let me know if you have any question about the post, and I'll get back to you as soon possible.
Regards,
Luis
- Mark as New
- Bookmark
- Subscribe
- Mute
- Subscribe to RSS Feed
- Permalink
- Report Inappropriate Content
12-18-2019 06:22 AM
The above solution may prove to work for some. However, I'd like to provide a solution to a similar situation that occurred for us. One of our engineers reported that his CPU usage was bottle necking due to AMP running scans in the background. I ran a file analysis in the AMP admin console and discovered that AMP was attempting to fetch a file that no longer existed. For whatever reason, this file fetch was running on a loop within AMP and caused the spike in CPU usage. Running a new scan on that PC seemed to clear up any contentions with that missing file.
I hope this provides a possible path for a solution for some of you.
Best,
Mike
- Mark as New
- Bookmark
- Subscribe
- Mute
- Subscribe to RSS Feed
- Permalink
- Report Inappropriate Content
06-24-2019 01:39 AM
Hello @chandrasekharpulicharla1451,
there is also a script on GitHub available to process your Diagnostic files.
https://community.cisco.com/t5/security-documents/troubleshooting-amp-for-endpoints-summary/ta-p/3863477#toc-hId--573319595
Direct Link to GitHub: https://github.com/CiscoSecurity/amp-05-windows-tune
Hope this helps, and it would be interesting what the outcome of your investigation is.
Greetings,
Thorsten
Discover and save your favorite ideas. Come back to expert answers, step-by-step guides, recent topics, and more.
New here? Get started with these tips. How to use Community New member guide

