- Cisco Community
- Technology and Support
- DevNet
- DevNet Networking
- Network Platform API
- how do I get top 10 WAN interface utilization through a API
- Subscribe to RSS Feed
- Mark Topic as New
- Mark Topic as Read
- Float this Topic for Current User
- Bookmark
- Subscribe
- Mute
- Printer Friendly Page

- Mark as New
- Bookmark
- Subscribe
- Mute
- Subscribe to RSS Feed
- Permalink
- Report Inappropriate Content
04-19-2017 06:06 PM - edited 03-01-2019 03:42 AM
how do I get top 10 WAN interface utilization through a API
Solved! Go to Solution.
- Labels:
-
Meraki
Accepted Solutions


- Mark as New
- Bookmark
- Subscribe
- Mute
- Subscribe to RSS Feed
- Permalink
- Report Inappropriate Content
06-21-2017 04:33 PM
Jon,
Great point - I was wrong in my prior response - the WAN status doesn't get you closer to the top 10 WAN links.
The best way to calculate network usage via API is to do a sum of all the clients on the MX. Request the clients data from the API endpoint for /devices/[serial]/clients?timespan=XXX.
API Docs:
https://dashboard.meraki.com/api_docs#list-the-clients-of-a-device-up-to-a-maximum-of-a-month-ago
This statement requires the clients data from an MX100:
curl -X GET \
'https://dashboard.meraki.com/api/v0/devices/Q2JN-RD78-XJNM/clients?timespan=100000' \
-H 'cache-control: no-cache' \
-H 'content-type: application/json' \
-H 'postman-token: 156f0307-e4a3-fa76-4aff-654737a2ca9a' \
-H 'x-cisco-meraki-api-key: fa1d2daa7bb8b71d5d87e1ee19ae55dacda0435d' \
-d '{
"enabled": false
}'
This returns the client usage sent and received:
[
{
"usage": {
"sent": 10143.885104300918,
"recv": 0
},
"id": "k945d80",
"description": "sf-mv-1-9-e0553d830582",
"mdnsName": null,
"dhcpHostname": "sf-mv-1-9-e0553d830582",
"mac": "e0:55:3d:83:05:82",
"ip": "172.16.1.16",
"vlan": 1
},
Now just sum all the clients on the MX and you have the site's total usage. Do this for every site and you have your top 10.
Regards,
Colin
- Mark as New
- Bookmark
- Subscribe
- Mute
- Subscribe to RSS Feed
- Permalink
- Report Inappropriate Content
04-20-2017 11:52 AM

- Mark as New
- Bookmark
- Subscribe
- Mute
- Subscribe to RSS Feed
- Permalink
- Report Inappropriate Content
06-19-2017 01:00 PM
I tried this in Postman and I just got empty array [] in the return. I tried this on the sandbox environment. Is this normal? Also, is there any documentation on the return JSON object? Thanks
- Mark as New
- Bookmark
- Subscribe
- Mute
- Subscribe to RSS Feed
- Permalink
- Report Inappropriate Content
06-19-2017 06:37 PM
I think there's an issue with my Sandbox because the Dashboard doesn't show any data either.
- Mark as New
- Bookmark
- Subscribe
- Mute
- Subscribe to RSS Feed
- Permalink
- Report Inappropriate Content
06-21-2017 04:22 PM
There is no issue with the sandbox it just doesn't have much traffic as it's not a production network with users on it. Try this on your own network, or try this API key with the "Meraki Live Demo" organization, so take it for a test drive:
fa1d2daa7bb8b71d5d87e1ee19ae55dacda0435d
For example, this statement:
curl -X GET \
'https://dashboard.meraki.com/api/v0/networks/L_646829496481087790/traffic?timespan=10000' \
-H 'cache-control: no-cache' \
-H 'content-type: application/json' \
-H 'postman-token: d320422f-7a43-da8a-0dfe-1b690ae93712' \
-H 'x-cisco-meraki-api-key: fa1d2daa7bb8b71d5d87e1ee19ae55dacda0435d' \
-d '{
"enabled": false
}'
Returns several applications starting with pings:
[
{
"application": "ICMP",
"destination": "8.8.8.8",
"protocol": "ICMP",
"port": "-",
"recv": 3771,
"sent": 3772,
"flows": 0,
"activeTime": 45960,
"numClients": 5
},
- Mark as New
- Bookmark
- Subscribe
- Mute
- Subscribe to RSS Feed
- Permalink
- Report Inappropriate Content
06-21-2017 09:05 AM
Hi Colin, How does the uplink API provides information on network utilization? I dont' see any traffic related information in the return JSON. Thanks
- Mark as New
- Bookmark
- Subscribe
- Mute
- Subscribe to RSS Feed
- Permalink
- Report Inappropriate Content
06-21-2017 04:33 PM
Jon,
Great point - I was wrong in my prior response - the WAN status doesn't get you closer to the top 10 WAN links.
The best way to calculate network usage via API is to do a sum of all the clients on the MX. Request the clients data from the API endpoint for /devices/[serial]/clients?timespan=XXX.
API Docs:
https://dashboard.meraki.com/api_docs#list-the-clients-of-a-device-up-to-a-maximum-of-a-month-ago
This statement requires the clients data from an MX100:
curl -X GET \
'https://dashboard.meraki.com/api/v0/devices/Q2JN-RD78-XJNM/clients?timespan=100000' \
-H 'cache-control: no-cache' \
-H 'content-type: application/json' \
-H 'postman-token: 156f0307-e4a3-fa76-4aff-654737a2ca9a' \
-H 'x-cisco-meraki-api-key: fa1d2daa7bb8b71d5d87e1ee19ae55dacda0435d' \
-d '{
"enabled": false
}'
This returns the client usage sent and received:
[
{
"usage": {
"sent": 10143.885104300918,
"recv": 0
},
"id": "k945d80",
"description": "sf-mv-1-9-e0553d830582",
"mdnsName": null,
"dhcpHostname": "sf-mv-1-9-e0553d830582",
"mac": "e0:55:3d:83:05:82",
"ip": "172.16.1.16",
"vlan": 1
},
Now just sum all the clients on the MX and you have the site's total usage. Do this for every site and you have your top 10.
Regards,
Colin

- Mark as New
- Bookmark
- Subscribe
- Mute
- Subscribe to RSS Feed
- Permalink
- Report Inappropriate Content
09-15-2017 01:14 PM
Colin,
I'm trying to do something similar however I would need to separate usage on the interface level when there are multiple
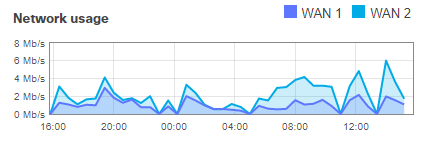
interfaces on the appliance. Looks like the data is there as it shown on the Appliance Status --> Summary page and I would like to retrieve it with the API.
Thanks,
Imre

Discover and save your favorite ideas. Come back to expert answers, step-by-step guides, recent topics, and more.
New here? Get started with these tips. How to use Community New member guide