- Cisco Community
- Technology and Support
- Networking
- Networking Knowledge Base
- Troubleshooting high CPU in SNMP Engine process in IOS
- Subscribe to RSS Feed
- Mark as New
- Mark as Read
- Bookmark
- Subscribe
- Printer Friendly Page
- Report Inappropriate Content
- Subscribe to RSS Feed
- Mark as New
- Mark as Read
- Bookmark
- Subscribe
- Printer Friendly Page
- Report Inappropriate Content
04-04-2011 05:32 AM - edited 08-24-2017 12:25 AM
- Introduction:
- Identifying the issue:
- Method 1: using “show snmp stats oid”
- Method 2: “debug snmp packets"
- Method 3: Observe the SNMP client
- Method 4: Sniffer trace
- Method 5: With Cisco TAC support: Use CPU profiling
- Method 6: UBR10k: use “show snmp cpu-stats”
- Appendix A: Use an EEM script to capture a CPU profiling during high CPU
- Appendix B: How to create an SNMP view
Introduction:
Finding the root cause of high CPU in SNMP Engine process will be difficult until we find the OIDs causing the issue. Once we know the OIDs causing the problem, we'll be able to troubleshoot the guilty feature deeper, and eventually resolve the problem or apply a workaround .
Most of the time we will find that we are polling big tables that will request a lot of CPU cycles to have them computed, sorted and sent back to the client. Sometimes we may find that some MIB are just responding slowly due to other issues or even because of a bug, or that the client is polling the server in a too aggressive way.
This document will provide some guidance to start troubleshooting high CPU in IOS of SNMP Engine process in order to identify the OIDs causing the issue. Once we have find the problematic OIDs, further troubleshooting will depend on the feature causing the issue.
Identifying the issue:
The router will suffer high CPU at the time it is being polled by a client, and this can be checked using the show process cpu <sorted> command at the time of the high cpu. We'll find SNMP Engine process taking all the CPU resources:
nmsvictim#show processes cpu sorted
CPU utilization for five seconds: 99%/0%; one minute: 22%; five minutes: 18%
PID Runtime(ms) Invoked uSecs 5Sec 1Min 5Min TTY Process
189 1535478456 697105815 2202 88.15% 13.40% 8.74% 0 SNMP ENGINE
................
The problematic OID causing the high CPU will typically be slower than the others, that could also cause some timeout when the client request this OID. Most of the method below will attempt to find the OID that provide slower answer as they will most likely be the ones causing the high CPU.
Method 1: using “show snmp stats oid”
show snmp stats oid will display the last OID that have been polled, it has been introduced in 12.4(20)T and 12.0(22)S releases. It will display the timestamp and is ordered, the goal will be to identify the OID that did respond slowly. This command will also be helpful if we want to find what MIB are being polled more often by the client.
nmsvictim#show snmp stats oid
time-stamp #of times requested OID
14:34:38 CET Oct 15 2009 24 atEntry.2
14:34:29 CET Oct 15 2009 40 atEntry.1
14:34:11 CET Oct 15 2009 11 ifOutErrors
14:34:07 CET Oct 15 2009 10 ifOutDiscards
14:34:06 CET Oct 15 2009 10 ifOutUcastPkts
14:34:06 CET Oct 15 2009 10 ifOutOctets
14:34:05 CET Oct 15 2009 10 ifInUnknownProtos
14:34:04 CET Oct 15 2009 10 ifInErrors
14:34:03 CET Oct 15 2009 10 ifInDiscards
14:34:02 CET Oct 15 2009 10 ifInUcastPkts
14:34:01 CET Oct 15 2009 10 ifInOctets
14:34:00 CET Oct 15 2009 10 ifLastChange
...........
14:33:53 CET Oct 15 2009 108 sysOREntry.4
14:33:43 CET Oct 15 2009 108 sysOREntry.3
14:33:34 CET Oct 15 2009 108 sysOREntry.2
...........
The above example was taken during an snmpwalk on the full router MIB. We can see that the atEntry.1 took 18 seconds for being computed, which suggest that the CPU may have been busy to compute those data.
Method 2: “debug snmp packets"
Debugs must be used with caution on production router, those debugs may be very chatty and can lead to an unresponsive router if precaution were not taken.
Using debug snmp packets will allow us to see at what time a query from the client enters the router, and at what time the router generated the reply and sent it over:
*Oct 21 09:22:33.715: SNMP: Packet received via UDP from 192.168.0.2 on Ethernet0/0
*Oct 21 09:22:33.731: SNMP: Get-next request, reqid 106061205, errstat 0, erridx 0
atEntry.2.1.1.192.168.0.2 = NULL TYPE/VALUE
*Oct 21 09:22:36.303: SNMP: Response, reqid 106061205, errstat 0, erridx 0
atEntry.3.1.1.192.168.0.1 = 192.168.0.1
*Oct 21 09:22:36.371: SNMP: Packet sent via UDP to 192.168.0.2
We see in this example that it took 3 seconds to respond to a GET-NEXT atEntry.2.1.1.192.168.0.2, so to compute atEntry.3.1.1.192.168.0.1 If we are able to compare with other OID, we may find what OID took most of the time for being answered.
Method 3: Observe the SNMP client
This is pretty obvious but it's worth to mention that simply doing an smpwalk to a router from a CLI client, and observe what OIDs seems to be answered slower than the others (or even just timing out) and/or correlate this with the start of the high cpu on the router is an easy way to find the guilty ones.
Method 4: Sniffer trace
Another way to find the packets that were answered more slowly by a router would be to use a sniffer capture. SNMP client usually runs on windows/unix devices, it should be easy to get a sniffer capture and filter it based on source/destination address in wireshark. In the below exampled, I used a simple filter in wireshark to find all SNMP packets from my router at 192.168.0.1: "ip.src==192.168.0.1 and snmp"
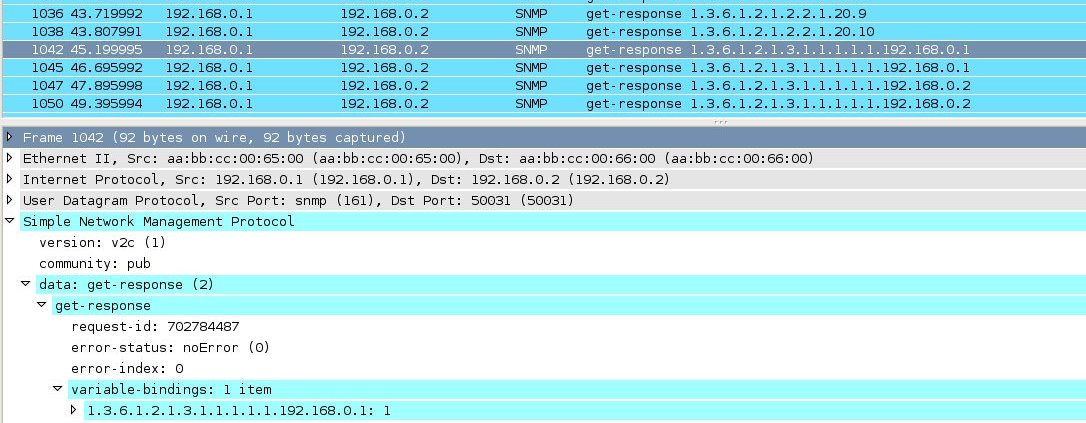
We can graph the packet rate for this filter and we'll have a very visual way to find where the flow started to become slower. After that, we can simply check what was the GET request for those slower packets and we'll find the OID in the SNMP request in the payload. In the below graph we see the flow rate going down starting the 44th second.
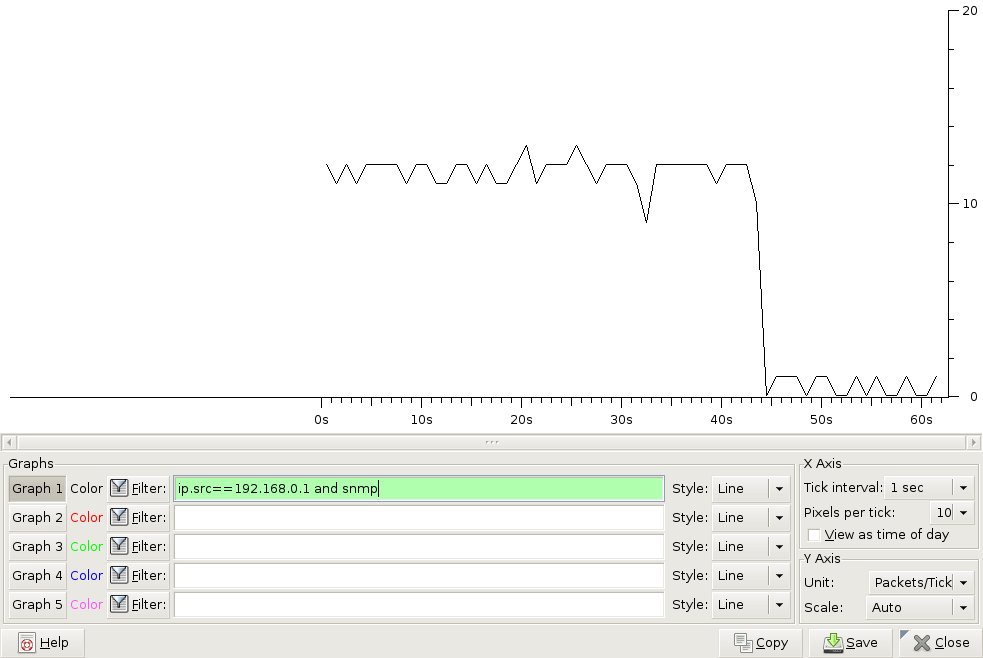
You can click on the graph and the packet in wireshark will look like:
Method 5: With Cisco TAC support: Use CPU profiling
You will need help from Cisco TAC to decode it, but using CPU profiling is probably the best way to understand what the CPU is doing. However, this has to be taken only during the high cpu, see Appendix A below if your image supports EEM scripting.
CPU profiling is explained in the following documentation, you will need to replace profile task interrupt which will be used to profile interrupt only, by profile task <PID> where PID is the process ID of the SNMP engine process as seen in show process cpu, it's 189 in the second paragraph example.
http://www.cisco.com/en/US/products/hw/routers/ps359/products_tech_note09186a00801c2af0.shtml#cd
The result of show profile terse will have to be analyzed by a Cisco TAC engineer, a show version is also needed to decode it.
Method 6: UBR10k: use “show snmp cpu-stats”
This command is meant to troubleshoot high cpu in SNMP Engine process. Unfortunately it's only available since 12.3(23)BC10 12.2(33)SCC trains, for UBR10k routers.
Appendix A: Use an EEM script to capture a CPU profiling during high CPU
It's easy to detect when the CPU is going high to start an EEM script take some commands, and start the profiling, but the profiling needs to be stopped at some point. Stopping when the CPU goes down is probably the best. An easy way to do this is to create two scripts that will use the syslog messages from CPU threshold notification when the CPU goes high to start the profiling, and a second script that willl run when the CPU goes back down to stop the profiling. An example:
process cpu threshold type total rising 60 interval 5 falling 30 interval 5
!
event manager applet profile_snmp_start
event syslog pattern "SYS-1-CPURISINGTHRESHOLD"
action 0 cli command "enable"
action 1 cli command "clear profile"
action 2 cli command "profile task <PID>"
action 3 cli command "profile <starting address> <ending address> <granularity value>"
action 4 syslog msg "Profiling Start"
!
event manager applet profile_snmp_stop
event syslog pattern "SYS-1-CPUFALLINGTHRESHOLD"
action 0 cli command "enable"
action 1 cli command "profile stop"
action 2 syslog msg "Profiling Stop"
After the script has run, simply connect to your device and take a show profile terse
Appendix B: How to create an SNMP view
To verify that we identified the correct OIDs, or to workaround the high CPU once the problematic OIDs has been found, and the root cause of the issue can't be fixed directly, we can exclude the MIB containing them from the SNMP server using an SNMP view. Here a very minimalist example to exclude the atEntry MIB, we change:
snmp-server community pub RW
To:
snmp-server view pubview iso included
snmp-server view pubview atEntry excluded
snmp-server community pub view pubview RO
- Mark as Read
- Mark as New
- Bookmark
- Permalink
- Report Inappropriate Content
A question When detecting the OID that is generating the high consumption of the CPU, what action can I take to suppress it?

Find answers to your questions by entering keywords or phrases in the Search bar above. New here? Use these resources to familiarize yourself with the community: