- Cisco Community
- Technology and Support
- Security
- Security Analytics
- Re: Stealthwatch setup and functionalities
- Subscribe to RSS Feed
- Mark Topic as New
- Mark Topic as Read
- Float this Topic for Current User
- Bookmark
- Subscribe
- Mute
- Printer Friendly Page
- Mark as New
- Bookmark
- Subscribe
- Mute
- Subscribe to RSS Feed
- Permalink
- Report Inappropriate Content
08-07-2018
12:25 AM
- last edited on
08-20-2019
10:29 AM
by
dhuckaby
![]()
Hi;
I'm working on Stealthwatch and to practice it's futures I downloaded the "Trial" virtual components (version 6.10.2) and installed/configured in this order:
- I installed Flow Collector virtual.
- I installed Management Console virtual.
- I created management channel between Flow Collector and Management Console.
- There was no Netflow capable device that I could use, so I had to install Flow Sensor virtual.
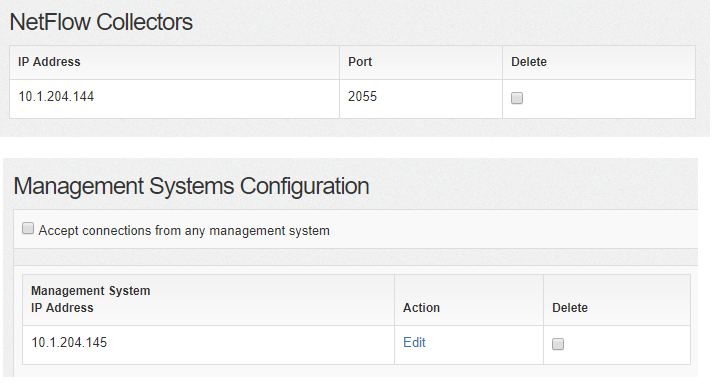
- On Flow Sensor I added flow collector & management console IP addresses.
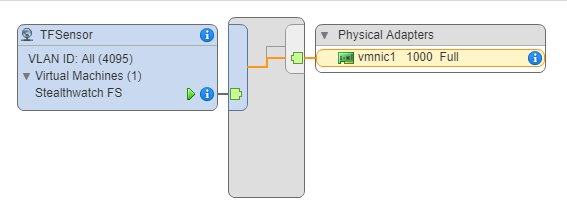
6. Flow Sensor virtual had 2 interfaces, which I connect the first one to my management network and the 2nd interface to another standard vSwitch on my vSphere client. I Assigned a physical interface to that vSwitch and attached it to a SPAN port on the physical switch.
7. I changed the Promiscuous mode on the above port group (TFSensor) to "Accept".
8. The home page on the Flow Collector shows that I'm receiving flows.
9. But I don't see any information on Management Console. I shows only 3 devices as this but nothing else.
Also I didn't managed to find "any" documents or user guides for the stealthwatch except ones currently are on the Cisco website which use SMC java client for version 6.9. But I only can see webUI which doesn't have to do anything to the menu structures of the SMC java client. So besides the issue that I mentioned up to this point,
- Do I need to use that client for version 6.10.2?
- Where can I find SMC user guides for WebUI?
- Does Flow Sensor communicate with Flow Collector through UDP:2055 ?
- What is the limitations of the Trial version?
Solved! Go to Solution.
- Labels:
-
Stealthwatch Enterprise
Accepted Solutions
- Mark as New
- Bookmark
- Subscribe
- Mute
- Subscribe to RSS Feed
- Permalink
- Report Inappropriate Content
08-08-2018 05:44 AM
Hello,
the fact that you don't see the full traffic from the main dashboard is normal: that is designed to show only active alarms.
In order to use the java client, please click on Desktop Client (top right corner on the screenshot).
From the webUI you can run Analyze->Flow Search and run a query to see every flow recevied by the flow collector.
The contextual guide available in the help menu is the best guide I can suggest for the WebUI.
I'll reply per points now:
- It depends on what you'll need to do. If your role is security analyst probably not. If you need to manage any of the advanced features, than yes.
- Contextual menu
- UDP:2055 and TCP:443 if you point the flow sensor to the SMC (Management System configuration option). 2055 is the default port number. You can change it.
- 60 days as per https://www.cisco.com/c/dam/en/us/td/docs/security/stealthwatch/release_notes/SW_6_10_2_Release_Notes_DV_1_2.pdf.
Hope this helps.
Dario
Discover and save your favorite ideas. Come back to expert answers, step-by-step guides, recent topics, and more.
New here? Get started with these tips. How to use Community New member guide


