- Cisco Community
- Technology and Support
- Security
- Security Knowledge Base
- ISE Profiling Design Guide
- Subscribe to RSS Feed
- Mark as New
- Mark as Read
- Bookmark
- Subscribe
- Printer Friendly Page
- Report Inappropriate Content
- Subscribe to RSS Feed
- Mark as New
- Mark as Read
- Bookmark
- Subscribe
- Printer Friendly Page
- Report Inappropriate Content
11-05-2018 05:56 PM - edited 07-22-2025 08:03 AM
Author: Craig Hyps
| For an offline or printed copy of this document, simply choose ⋮ Options > Printer Friendly Page. You may then Print, Print to PDF or copy and paste to any other document format you like. |
Table of Contents
- Introduction
- About Cisco Identity Services Engine (ISE)
- About this guide
- Cisco ISE Profiling Services
- Solution Overview
- Policy Architecture and Components
- Scenario Overview
- Network Topology
- Guide Components
- Profiling Service Requirements
- Licensing
- Appliance Requirements
- Network Requirements
- Profiling Services Global Configuration
- ISE Profiling Global Configuration
- Procedure 1 Configure Global Profiling Settings from the Policy Administration Node
- Enable ISE Profiling Services
- Procedure 2 Enable Profiling Services on the Policy Service Node
- Procedure 3 Access and View the Profiling Configuration Page
- Configuring Probes
- Probe Overview
- Probe Configuration
- Profiling Using the RADIUS Probe
- Configuring the RADIUS Probe
- Procedure 4 Enable the RADIUS Probe in ISE
- Procedure 5 Verify Access Device Is Configured in ISE
- Procedure 6 Verify That Access Devices Are Configured to Send RADIUS to ISE PSN
- Procedure 7 Verify RADIUS Probe Data
- Profiling Using the SNMP Trap Probe
- Configuring the SNMP Trap Probe
- Procedure 8 Enable the SNMP Trap Probe in ISE
- Procedure 9 Add the Network Access Device to ISE
- Procedure 10 Configure Access Devices to Send SNMP Traps to ISE Policy Service Node
- Procedure 11 Verify SNMP Trap Probe Data
- Profiling Using the SNMP Query Probe
- Configuring the SNMP Query Probe
- Procedure 12 Enable the SNMP Query Probe in ISE
- Procedure 13 Configure the Network Device in ISE (Network Resources)
- Procedure 14 Configure Wired Access Devices to Accept SNMP Queries from the ISE PSN
- Procedure 15 Configure Wireless Access Devices to Accept SNMP Queries from the ISE PSN
- Procedure 16 Configure Access Devices to support CDP and LLDP
- Procedure 17 Verify SNMP Query Probe Data
- Profiling Using the DHCP and DHCP SPAN Probes
- Configuring the DHCP and DHCP SPAN Probes
- Procedure 18 Enable DHCP Probes in ISE
- Procedure 19 Add the Network Device to ISE (Network Resources)
- Procedure 20 Configure ISE Policy Service Node Interface to Receive DHCP Relay Packets (DHCP Probe Only)
- Procedure 21 Configure ISE Policy Service Node Interface to Receive SPAN Traffic(DHCP SPAN Probe Only)
- Procedure 22 Configure Wired Access Devices to Relay DHCP Packets to the ISE PSN (DHCP Probe Only)
- Procedure 23 Configure Wireless Access Devices to Relay DHCP Packets to the ISE PSN (DHCP Probe Only)
- Procedure 24 Configure Network Devices to Send Copies of DHCP Traffic to the PSN (DHCP SPAN Probe only)
- Procedure 25 Verify DHCP Probe Data
- Profiling Using the HTTP Probe
- Configuring the HTTP Probe
- Procedure 26 Enable HTTP Probe in ISE
- Procedure 27 Add the Network Device to ISE (Network Resources)
- Procedure 28 Configure ISE Policy Service Node Interface to Receive Redirected HTTP Traffic
- Procedure 29 Configure ISE Policy Service Node Interface to Receive HTTP SPAN Traffic
- Procedure 30 Configure Wired Access Devices to Redirect HTTP Packets to the ISE PSN
- Procedure 31 Configure Wireless Access Devices to Redirect HTTP Packets to the ISE PSN
- Procedure 32 Configure ISE to Perform URL Redirection as a RADIUS Authorization
- Procedure 33 Configure Network Devices to Send Copies of HTTP Traffic to the ISE PSN
- Procedure 34 Verify HTTP User-Agent Data Using URL Redirection (CWA Example)
- Procedure 35 Verify HTTP User-Agent Data Using URL Redirection (Client Provisioning Example)
- Procedure 36 Verify HTTP Probe Data using SPAN
- Profiling Using the DNS Probe
- Configuring the DNS Probe
- Procedure 37 Enable DNS Probe in ISE
- Procedure 38 Configure Probes to Obtain the Endpoint IP Address
- Procedure 39 Configure ISE with DNS Servers for Reverse Address Lookups
- Procedure 40 Verify DNS Probe Data
- Profiling Using the NetFlow Probe
- Configuring the NetFlow Probe
- Procedure 41 Enable NetFlow Probe in ISE
- Procedure 42 Add the Network Device to ISE (Network Resources)
- Procedure 43 Configure ISE Policy Service Node Interface to Receive NetFlow Traffic
- Procedure 44 Configure NetFlow-Capable Switch/Router to Export NetFlow to the ISE PSN
- Procedure 45 Verify NetFlow Probe Data
- Profiling Using the Network Scan (NMAP) Probe
- Configuring the NMAP Probe
- Procedure 46 Verify Global Profiler Settings for NMAP Scanning
- Procedure 47 Configure the NMAP Probe for Endpoint Scanning
- Procedure 48 Review NMAP Scan Actions (Preparation for Manual Network Scan)
- Procedure 49 Run a Network Scan
- Procedure 50 Review NMAP Actions (Preparation for Triggered Endpoint Scan)
- Procedure 51 Review the Configuration to Assign an NMAP Action to a Profiling Policy Condition
- Procedure 52 Verify NMAP Probe Data Based on a Triggered Endpoint Scan Action
- Profiling Using the Active Directory (AD) Probe
- Configuring the AD Probe
- Procedure 53 Enable AD Probe in ISE
- Procedure 54 Configure Probes to Obtain the Endpoint Hostname/FQDN
- Procedure 55 Verify ISE is Joined to Active Directory
- Procedure 56 Verify AD Probe Data
- Profiling Using the pxGrid Probe
- Configuring the pxGrid Probe
- Procedure 57 Verify pxGrid Services in the ISE Deployment
- Procedure 58 Verify pxGrid Publisher is Registered and Authorized
- Procedure 59 Enable Global Profiler Settings for Custom Attributes
- Procedure 60 Create Custom Attributes as Required by Publisher
- Procedure 61 Enable pxGrid Probe on Select PSN(s)
- Procedure 62 Verify pxGrid Probe Data
- Endpoint Custom Attributes
- Configuring Endpoint Custom Attributes for Profiling
- Procedure 63 Enable Global Profiler Settings for Custom Attributes
- Procedure 64 Define Endpoint Custom Attributes
- Procedure 65 Populating Endpoint Custom Attributes for a Single Endpoint
- Procedure 66 Populating Endpoint Custom Attributes using File Import
- Procedure 67 Populating Endpoint Custom Attributes using ERS API
- Procedure 68 Populating Endpoint Custom Attributes using pxGrid
- Procedure 69 Verify Profile Changes Using Endpoint Custom Attributes
- Device Sensor
- Device Sensor Overview
- Device Sensor Details
- Device Sensor Requirements
- Configuring Device Sensor for ISE Profiling
- Procedure 70 Enable RADIUS Probe in ISE
- Procedure 71 Enable Profiling Protocols on Cisco Wired Switches
- Procedure 72 Configure Device Sensor on Cisco Wired Switches
- Procedure 73 Configure Device Sensor on Cisco Wireless Controllers
- Procedure 74 Verify Profiling using Device Sensor
- Configuring Profiling Policies
- Profiling Policy Configuration Overview
- Profiling Conditions
- Dictionary Attributes
- Configuring Profiling Conditions
- Procedure 75 Configure a Custom (User-Defined) Profiler Condition
- Procedure 76 Verify Configuration of a Custom Profiler Condition
- Profiling Policies and Rules
- Profiling Policy Rule Actions
- Procedure 77 Configure a Custom (User-Defined) Profiler Policy
- Procedure 78 Configure a Custom (User-Defined) Profiler Policy – Child Profile
- Procedure 79 Verify Custom Profiler Policies
- Logical Profiles
- Procedure 80 Configure a Logical Profile
- Procedure 81 Verify Endpoints Match a Logical Profile
- Profiles and Matching Endpoint Identity Groups
- Static Versus Dynamic Endpoint Identity Groups
- Static Profiles Versus Dynamic Endpoint Profiles
- Profiling and Authorization Policy
- Profile Transitions and Change of Authorization
- Change of Authorization (CoA)
- Procedure 82 Configure a Custom (User-Defined) Exception Action
- Procedure 83 Configure the Network Devices for CoA
- Profiling Reports and Tools
- Global Search
- Context Visibility
- Operational Reports
- Endpoint Profile Changes
- Profiled Endpoints Summary
- Debug Logging
- Procedure 84 Configure Profiler Debug Log Collection
- Procedure 85 Retrieve Profiler Debug Logs for Analysis
- Procedure 86 Debug Logging for a Single Endpoint
- CLI – Get All Endpoints
- Procedure 87 Get All Endpoints
- Profile Updates
- Cisco Profiler Feed Service
- OUI Updates
- Cisco Community Profiles
- EAT Public Profiles
- Export/Import of Custom Profiles
- ISE Profiler Feed Version
- Procedure 91 Update ISE Profiles Using the Online Feed Service
- Procedure 92 Update ISE Profiles Using Offline Manual Update
- Procedure 93 Accessing Cisco Community Profiles
- Procedure 94 Importing ISE Profiles
- Procedure 95 Exporting and Importing ISE Profiles
- Profiling Design and Best Practices
- Profiling Design Considerations
- Profiling Known Device Types
- Profiling Unknown Device Types
- Access Policy and Device Configuration Impact on Profiling
- Probe Selection Best Practices
- Probe Attributes
- The Unofficial Guide to Probe Selection
- Profiling Plan
- Profiling Scale and High Availability
- Load Balancing Profiler Services
- Anycast and Profiler Services
- Optimizing Data Replication
- Summary of Profiling Best Practices and Recommendations
- Appendix A: ISE Menu Navigation Maps
- Appendix B: Probe Frequencies
- Appendix C: SNMPv3 Configuration Example
- Questions or Comments?
Introduction
About Cisco Identity Services Engine (ISE)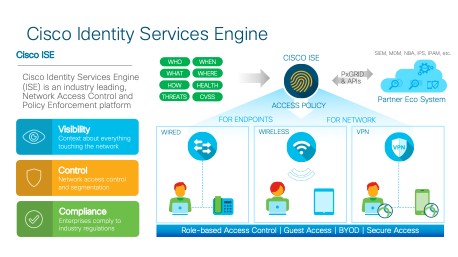
Cisco Identity Services Engine (ISE) is a market leading, identity-based network access control and policy enforcement system. It’s a common policy engine for controlling, endpoint access and network device administration for your enterprise. ISE allows an administrator to centrally control access policies for wired wireless and VPN endpoints in the network.
ISE builds context about the endpoints that include users and groups (Who), device-type (What), access-time (When), access-location (Where), access-type (Wired/Wireless/VPN) (how), threats and vulnerabilities. Through the sharing of vital contextual data with technology partner integrations and the implementation of Cisco Scalable Group Policy for software-defined segmentation, Cisco ISE transforms the network from simply a conduit for data into a security enforcer that accelerates the time to detection and time to resolution of network threats.
About this guide
This guide is intended to provide technical guidance to design, configure and operate the Profiling feature in the Cisco Identity Services Engine (ISE). The document provides best practice configurations for a typical environment.
Cisco ISE Profiling Services
Solution Overview
Cisco ISE Profiling Services provides dynamic detection and classification of endpoints connected to the network. Using MAC addresses as the unique identifier, ISE collects various attributes for each network endpoint to build an internal endpoint database. The classification process matches the collected attributes to prebuilt or user-defined conditions, which are then correlated to an extensive library of profiles. These profiles include a wide range of device types, including mobile clients (iPads, Android tablets, Chromebooks, and so on), desktop operating systems (for example, Windows, Mac OS X, Linux, and others), and numerous non-user systems such as printers, phones, cameras, and game consoles. Cisco ISE Profiling also covers the Internet of Things (IoT) by classifying building automation including devices used to control heating, ventilation, and air conditioning (HVAC), power and lighting systems, as well as vertical-specific endpoints such as healthcare patient monitors and imaging devices, as well as manufacturing controllers and sensors.
Once classified, endpoints can be authorized to the network and granted access based on their profile. For example, endpoints that match the IP phone profile can be placed into a voice VLAN using MAC Authentication Bypass (MAB) as the authentication method. Another example is to provide differentiated network access to users based on the device used. For example, employees can get full access when accessing the network from their corporate workstation but be granted limited network access when accessing the network from their personal iPhone.
Policy Architecture and Components
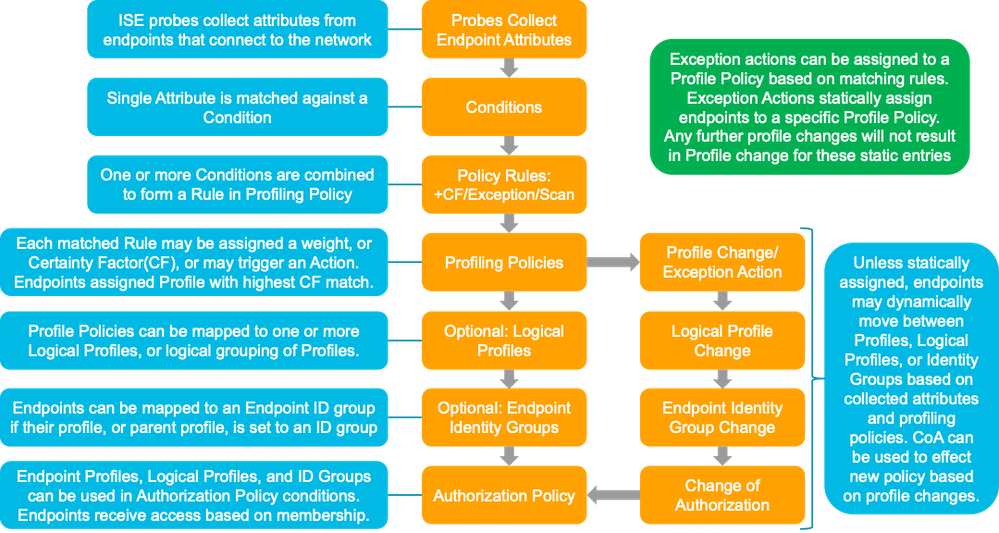
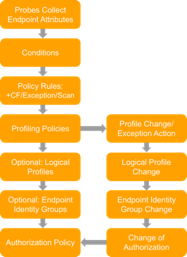
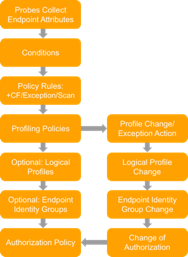
Figure 2 highlights the general policy architecture and key components for Cisco ISE Profiling Services. The configuration process begins with the enablement of specific probes on an ISE appliance running the Policy Service persona. There are different probes that are responsible for collecting different types of endpoint attributes. These attributes are matched to conditions which can then match rules across a library of device types, or profiles. Based on a generic weighting scale, each matching condition can be assigned a different weight, or certainty factor (CF) that expresses the relative value that the condition contributes to classification of the device to a specific profile. Although conditions may match in multiple profiles, the profile for which the endpoint has the highest cumulative CF, or Total Certainty Factor (TCF) is the one assigned to the endpoint. This policy is referred to as the MatchedPolicy, or the Endpoint Profile Policy.
Figure 2: ISE Profiling Policy Architecture and Components
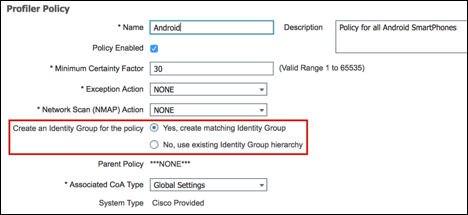
Once profiled, the endpoint policy can be directly referenced in Authorization Policy Rule conditions. Unlike earlier ISE v1.x releases, it is no longer necessary for ISE administrators to create matching Identity Groups under the Endpoint Profile Policy. In fact, this method is discouraged since the Identity Group attribute is limited to a single value and may be required for other purposes. When possible, it is preferred to leverage the Endpoint Policy attribute or Logical Profile attribute.
A Logical Profile is an ad-hoc assignment of specific profile polices to a logical group to simplify policy rules and visibility filters. An Endpoint Profile Policy can be a member of multiple Logical Profiles. For example, an IP Camera may belong to a Logical Profile for Video Devices as well as another for Security Devices. ISE comes preconfigured with a number of Endpoint Profiles and Logical Profiles in its library for immediate use. Both types of profiles can be created, modified, or deleted to suit the particular deployment.
Like Endpoint Profiles, Logical Profiles can be directly referenced in Authorization Policy Rule conditions and can drastically reduce the number of individual rule conditions needed to match many different device types with a common purpose or business function. For example, “If Logical_Profile = IP-Phones, then SGT = Voice and assign Voice-ACL permissions”. In this example, it was not necessary to match each and every type of vendor phone and model, but simply assign the individual profiles to the logical group and apply policy to the group.
An endpoint’s profile can change as new attributes are learned or previously learned attributes are overwritten. Changes can also occur as a result of updates to the Profiling Policy. In some cases, the transition may be automatic—for example, from a generic HP-Device to a more specific profile such as an HP-Color-LaserJet-4500. In other cases, an administrator may want to make a deliberate action to bypass the default policy in the form of an Exception Action. Exception Actions allow static assignment of an endpoint to a specific Profiling Policy such that further attributes collection or correlation has no impact on the profile and optional Identity Group assigned.
In each case above—profile transition and Exception Action—it may be desirable to allow ISE to enforce a new access policy for the endpoint based on the new profile assignment. RADIUS Change of Authorization (CoA) is the facility to accomplish this task in ISE. By sending CoA requests to the access device to which the endpoint is connected, ISE can require that the host be reevaluated against the Authentication and Authorization Policy.
| ⓘ | Note: ISE Profiler does not clear or remove previously learned attributes. The current logic is to add or overwrite, but not delete attributes it has not collected. As an example, if a client sends DHCP attributes 1 and 2 and later sends attributes 2 (different value) and 3, ISE will merge the attributes to include attribute 1 (original value) + 2 (updated value) + 3 (initial value); attribute 1 is retained, attribute 2 overwritten, and attribute 3 added. |
It is not typical for endpoints to have different attributes for the same probe, but there are cases in normal operation where it can occur, such as personality changes after initial boot (PXE Boot, for example), different message types (DHCP Discover versus Inform), or MAC address spoofing. It is therefore important to understand ISE profiling logic to avoid unexpected results.
Scenario Overview
Network Topology
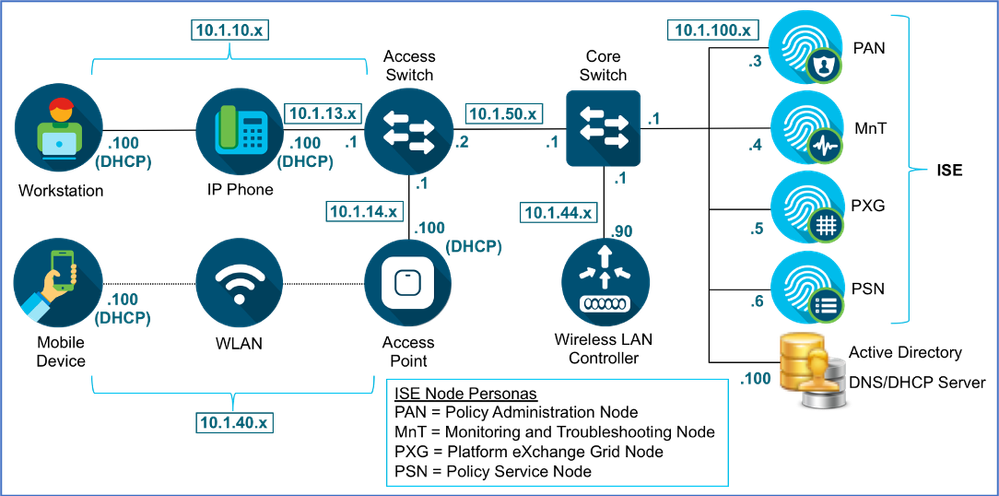
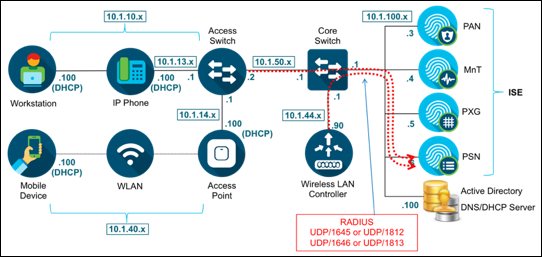
Figure 3 depicts the high-level network topology used in this guide. This document will focus on the wired and wireless scenarios for profiling. ISE Profiling Services are also supported for VPN clients when deployed with the Cisco AnyConnect Secure Mobility Client and Cisco Adaptive Security Appliance (ASA) for remote access VPN services.
Figure 3: ISE Profiling Topology
Guide Components
ISE version 2.4 was used to generate the majority of configuration examples, sample output and screen captures used in this guide. Some ISE Profiling features are version dependent but the core principles apply to all ISE versions.
Table 1: Cisco ISE Profiling Services Design Guide Components
| Component | Hardware | Features Tested | Software Release |
| Cisco Identity Services Engine (ISE) | Virtual Appliance based on SNS-3515 | Integrated AAA, policy server, and profiling services | Cisco ISE Software Version 2.4 (Base and Plus and Apex Feature Licenses) |
| Cisco Catalyst 3000 Series Switches
(Access Switch) |
Cisco Catalyst 3750-X Series | Basic Identity features including MAB, CWA, 802.1X authentication, and RADIUS CoA.
Profiling support services including Simple Network Management Protocol (SNMP), RADIUS, Dynamic Host Configuration Protocol DHCP Relay, URL Redirection and Device Sensor. |
Cisco IOS Software Release 15.2(4) E2 (IP Base) |
| Cisco Catalyst 6000 Series Switches
(Core Switch) |
Cisco Catalyst 6500 Series Supervisor Engine 720 Policy Feature Card 3A (PFC3A) |
Profiling support services including Cisco NetFlow Version 5 and Version 9 export, DHCP Relay, and Switched Port Analyzer/Remote Switched Port Analyzer (SPAN/RSPAN). |
Cisco IOS Software Release 12.2(33)SXJ2 (Advanced IP Services) |
| Cisco Wireless LAN Controller (WLC) | Cisco 5508 Wireless LAN Controller | Basic Identity features including MAB, LWA, CWA, 802.1X authentication, and CoA.
Profiling support services including SNMP, RADIUS, DHCP Relay, and URL Redirection. |
Cisco Unified Wireless Network Software Release 8.5.110.0 |
| Cisco Wireless Access Point | Cisco Aironet Lightweight Access Point 1602 | Endpoint authenticated using MAB and authorization policy based on profile attributes | Cisco Lightweight Access Point Software Release 15.3(3)JF4 |
Profiling Service Requirements
Licensing
The full ISE Profiling feature set requires the installation of a Plus license on the Policy Administration node (PAN). Some basic profiling capabilities are enabled by default as part of the Base license to support core functions.
One Plus feature license is required for each endpoint that is actively authenticated to the network and where profiling data is used to make an Authorization Policy decision. Not considering other services, such as Scalable Group Policy and Bring Your Own Device (BYOD) that may require a Plus feature license, endpoints that are statically assigned to a profile do not consume a Plus license. It is possible to profile multiple endpoints and have visibility into connected devices and their classification without requiring a Plus feature license for each if the profile information is not used to authorize the endpoint. The minimum number of Plus feature licenses is 100.
Appliance Requirements
ISE Profiling Services can only run on an ISE appliance configured for the Policy Service node (PSN) persona. ISE scale and performance tables posted to Cisco.com typically list the maximum concurrent sessions supported per PSN and per deployment. However, these values are specific to simultaneous authenticated endpoints, not the total that can be profiled. The total number of endpoints that can be profiled and persisted in the ISE database is much higher.
ISE Profiling Services can be scaled by distributing the service across multiple Policy Service nodes. Other common methods to optimize profile data collection include Device Sensor, load balancing, Anycast, or configurations that manually distribute load to different PSNs. These topics will be covered later in this guide.
Network Requirements
ISE Profiling Services uses various collectors, or probes, to collect attributes about connected endpoints. Some of these probes require specific support by the network infrastructure, access devices, or possibly the endpoints. These requirements will be called out in greater detail in the sections that cover specific probes, but it is important to understand that some probes may not be usable if the appropriate data is not made available from the network or the endpoints.
Cisco documentation provides compatibility lists that show specific network devices and versions along with feature support. The devices listed in the documentation are based on internal quality assurance (QA) testing by Cisco, but it is important to understand that the list is not all inclusive of all devices that can be used with ISE Profiling.
ISE Profiling Services leverage standard protocols including Simple Network Management Protocol (SNMP), RADIUS, Dynamic Host Configuration Protocol (DHCP), HTTP, NetFlow, NMAP, and others. Therefore, virtually ANY network device can support basic profiling. Some profiling enhancements such as Device Sensor may entail special feature support, but are not mandatory to perform profiling with legacy Cisco equipment or third-party network devices lacking such optimizations.
Beyond classification, the ability for ISE to dynamically trigger policy change based on profile transitions does require support for Change of Authorization (CoA). ISE offers both RADIUS and SNMP CoA to allow most network access devices to support dynamic policy updates based on current policy and endpoint context. Even without CoA support, endpoints can be classified for visibility and policies based on profile can be applied upon endpoint reconnect or at the session reauthentication interval.
Profiling Services Global Configuration
This guide will also use the convention of LHS as shorthand for “Left-Hand Side” and RHS for “Right-Hand Side” when referring to left and right panels in the ISE administrative interface, respectively.
| ⓘ | Note: There a multiple navigation paths to configure ISE Profiling services from the ISE Administration interface. This guide will focus on the use of the Profiler Work Center where applicable. Work Centers help streamline access to various configuration and monitoring pages for a given feature by consolidating all related functions under a single menu structure. |
ISE Profiling Global Configuration
This section reviews the process for globally enabling ISE Profiling Services on a Policy Service node and configuring global profiling parameters.
Global Profiler Settings include configurations that impact the entire deployment so are covered first. These settings will be referenced throughout the guide as they relate to a particular feature or function. It is useful to be aware of these settings to understand why some ISE Profiler functions behave (or misbehave) in a certain way.
Procedure 1 Configure Global Profiling Settings from the Policy Administration Node
Step 1 Access the ISE administrative interface of the primary Policy Administration node (PAN) using a supported web browser and your admin credentials: https://<ISE_PAN_FQDN_or_IP>
Step 2 Navigate to Work Centers > Profiler > Settings and select Profiler Settings from the left-hand-side (LHS) pane.
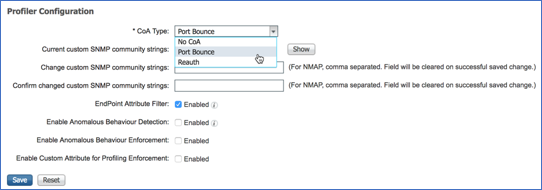
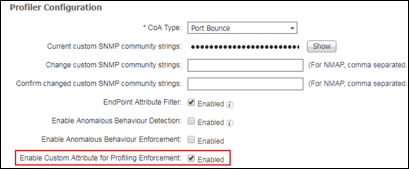
Step 3 From the right-hand side (RHS) pane, choose the CoA Type to be used for profiling transitions and Exception Actions (Figure 4). It is possible to override CoA response for a specific Profile Policy or Exception Action, but the global configuration dictates the default behavior in absence of more specific settings.
Figure 4: Global Profiler Configuration
If the goal is visibility only, leave the default value of No CoA. Furthermore, a setting of No CoA overrides all per-profile settings and disables CoA for all profiler operations and Exception Actions. If the goal is to immediately update access policy based on profile changes, select Port Bounce. This will help ensure that even clientless endpoints will go through complete reauthorization process, including an IP address refresh, if needed. The Reauth option may be sufficient for cases where no VLAN or address change is expected following reauthorization of the current session.
If multiple endpoints are detected on a wired switchport, ISE will automatically revert to using the Reauth option to avoid service disruption of other connected devices. A common example is a workstation connected to an IP phone where a port bounce would interrupt communications for both workstation and phone.
| ⓘ | Note: Ultimately, the behavior of a Network Access Device (NAD) to a CoA directive will depend on the ISE NAD Profile template assigned to the access device and the CoA methods it supports. For example, a Wireless Controller does not have the concept of “port bounce” and may simply reauthorize the port without forcing IP address renewal by the client. |
Step 4 ISE Profiler supports the ability to scan endpoints and trigger an SNMP query against the endpoint if determined to be SNMP-enabled. The default SNMP community string used for these queries is public. To use a different community string or sequence of strings, enter the new string values under Change custom SNMP community strings and enter again to confirm correct spelling.
Values are hidden from passive viewers, but can be exposed by clicking the Show button once saved. This setting will be covered in more detail under the NMAP probe section.
Step 5 Change the default setting for Endpoint Attribute Filter to Enabled. The filter (also referred to as the “Whitelist Filter”) limits endpoint data collection to whitelisted attributes. Whitelisted attributes include the endpoint data required for profiling and maintenance. Other attributes are deemed extraneous and will be dropped (not saved or replicated to the endpoint database). This can significantly improve the efficiency of profiling operations as less data needs to be maintained and replicated.
Cisco Best Practice: Best practice is to enable the Endpoint Attribute Filter in production deployments. To add an attribute to the whitelist that is currently not present, the administrator simply needs to create a new Profiler Condition and Policy that uses the attribute. The attribute will automatically be added to the whitelist of stored and replicated attributes.
For lab deployments or a production deployment in a discovery phase or visibility-only mode, the Endpoint Attribute Filter can be left Disabled (not Enabled) to allow collection of all potential endpoint attributes. This can be useful in determining which attributes may be normally dropped but desirable for visibility or new profile creation.
Step 6 Keep the default settings of Disabled for “Custom Attribute for Profiling Enforcement”. More details on the use of this feature are provided later in this guide.
Enable ISE Profiling Services
Procedure 2 Enable Profiling Services on the Policy Service Node
Step 1 Go to Work Centers > Profiler > Node Config > Deployment and select the Policy Service node to perform profiling from list of deployed nodes on the RHS pane.
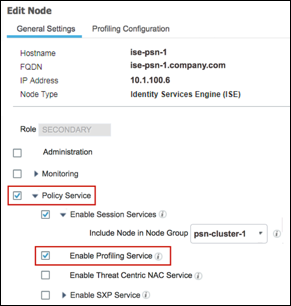
Step 2 Under the General Settings tab, verify that the node persona called Policy Service is selected and that Enable Profiling Service is also selected (Figure 5).
Figure 5: Enabling Profiling Services on the Policy Service Node
Procedure 3 Access and View the Profiling Configuration Page
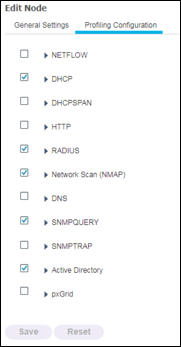
Click the Profiling Configuration tab. View the various probes that can be enabled and configured simply by checking the appropriate box and selecting optional probe parameters (Figure 6).
Not all probes are enabled by default, and some are partially enabled even without an explicit check mark displayed in the box.
The RADIUS probe is running by default, even for systems not configured for Profiling Service to ensure ISE can track endpoint authentication and authorization details for use in Context Visibility Services. The RADIUS probe and Profiling Services are also used to track the creation and update times for registered endpoints for purposes of purge operations. When the Profiling Service is enabled and probe enabled, then new attributes learned from RADIUS will also trigger profiling. Otherwise, attributes are collected but profiling is not triggered based on RADIUS-learned data, including Device Sensor.
Another example of default profiling without an explicit probe enabled is HTTP. Multiple ISE services such as CWA, Hotspot, BYOD, MDM, and Posture rely on URL-redirection of the client’s web browser. The redirected traffic includes the RADIUS session ID of the connected endpoint. When a PSN terminates these URL-redirected flows, it has visibility into the decrypted HTTPS data. Even when the HTTP probe is disabled on the PSN, the node will parse the browser user agent string from the web traffic and correlate the data to the endpoint based on its associated session ID. When browser strings are collected through this method, the source of the data is listed as Guest Portal or CP (Client Provisioning) rather than HTTP Probe. More details on the HTTP Probe are provided later in this guide.
Be sure to review the details of each probe in this guide for guidance on which probes to enable and for what purpose. In general, it is not recommended to configure all probes, especially in a production deployment, as this may result in excessive data collection than is required to achieve the desired goal.
The Profiling Configuration is currently unique to each PSN. In most deployments, each PSN should be configured with identical Profiler Configuration settings. A couple exceptions to this general rule include
- The pxGrid Probe should be enabled on only a subset of PSNs, typically no more than two nodes. More details can be found under the pxGrid Probe section
- Specific probes may be applicable to PSNs servicing particular locations or sections of the network. For example, if PSNs serving a group of network devices support Device Sensor, then it may not be necessary to enable other probes that collect the same set of attributes. Another example would be to perform discovery only using the SNMP probes prior to the enablement of RADIUS at a new location. This would allow an administrator to gain visibility into the network prior to any network authentication being configured. Similarly, it may be desirable to dedicate a node for data center visibility even though RADIUS-based authentication is not planned for server farms.
Whenever you make changes to the profiling configuration, be sure to click Save at the bottom of page to commit the changes.
Configuring Probes
Probe Overview
An ISE probe is the component of ISE Profiling Services that collects endpoint attributes. Each probe uses different collection methods and can gather unique information about endpoints. Consequently, some probes are better suited than others to classify certain device types or may be preferred based on the particular environment.
ISE Profiler supports the following probes:
- RADIUS
- AnyConnect Identity Extensions (ACIDex)
- Device Sensor
- SNMP Trap
- SNMP Query
- DHCP
- DHCP SPAN
- DNS
- HTTP
- NetFlow
- Network Scan (NMAP)
- Active Directory (AD)
- pxGrid
As suggested by their names, some probes such as DHCP and DHCP SPAN, for example, are capable of collecting specific attributes; in this example, DHCP attributes and associated option fields in DHCP packets. The choice between DHCP and DHCP SPAN will depend on whether the particular network environment supports the relay of DHCP traffic to the ISE Policy Service node, or if use of a SPAN method is better suited to network topology and capabilities of the infrastructure. Furthermore, some features like Device Sensor or the pxGrid probe are capable of collecting DHCP data. It is important to understand the attribute data collected by various probes so that care is taken to enable optimal probes without duplicating the data collected. This guide includes detailed guidance on probe selection under the individual sections for each probe.
Each probe type varies in how simple or difficult it is to configure services essential for data collection. Each probe type also has varying levels of impact to the network or endpoints based on the protocols used and how they are deployed. Finally, each probe varies in the value of the data it produces and its applicability to classifying the specific endpoints of interest in the network. This guide reviews how each probe is configured and deployed and also aims to provide an overall understanding of each probe’s deployment difficulty, network impact, and relative profiling value based on type of deployment.
As highlighted in Figure 7, the configuration of probes that collect endpoint attributes is the start of the profiling process.
Figure 7: Configuration Flow: Probes and Attribute Collection
Probe Configuration
ISE probes are enabled on ISE Policy Service nodes configured for Profiling Services. This section reviews the steps to enable the various ISE probes to collect different endpoint attributes. Working configuration examples of supporting network infrastructure will also be provided along with the expected output from both the infrastructure and ISE administrative interface.
Profiling Using the RADIUS Probe
The RADIUS probe collects RADIUS attributes sent by RADIUS clients (including wired access switches and wireless controllers) to the RADIUS server (the ISE Policy Service node running Session Services). Standard RADIUS ports include UDP/1645 or UDP/1812 for authentication and authorization, and ports UDP/1646 and UDP/1813 for RADIUS accounting.
| ⓘ | Note: The RADIUS probe does not listen directly to RADIUS traffic, but instead listens and parses RADIUS attributes forwarded in syslog to UDP port 30514. |
Figure 8 shows the topology of our RADIUS probe example.
Table 2 shows common attributes collected using the RADIUS probe.
| User-Name | Calling-Station-Id | Called-Station-Id | Framed-IP-Address |
| NAS-IP-Address | NAS-Port-Type | NAS-Port-Id | NAS-Identifier |
| Device Type (NAD) | Location (NAD) | Authentication Policy | Authorization Policy |
Although dependent on the access device configuration, Calling-Station-Id is commonly the MAC address of the connecting endpoint. This attribute provides immediate benefit in quickly identifying a unique endpoint based on MAC address as it connects to the network and authenticates. It also provides information on the vendor network adapter based on the Organizationally Unique Identifier (OUI) taken from the first three bytes of the MAC address.
The Framed-IP-Address present in RADIUS accounting packets provides the IP address of the connecting endpoint. This attribute combined with Calling-Station-ID gives ISE the critical IP-to-MAC binding required to support other probes that rely on IP address such as DNS, HTTP, Cisco NetFlow, and NMAP. The pxGrid Probe may also send information containing IP address only. In these cases, it is required to have the IP-to-MAC binding else the collected attributes will be dropped as there is no endpoint to associate the profile data.
| ⓘ | Note: In a deployment which utilizes dynamic IP address assignment, there is a chance that attributes learned from one endpoint could be incorrectly correlated to another endpoint assigned the same address at a later point in time. To help prevent this situation, the IP address collected from RADIUS Accounting Start and Update messages is cleared from the endpoint record upon reception of a RADIUS Accounting Stop for that endpoint’s session. |
Device Type and Location provide information on Network Device Groups (NDGs) associated with the endpoint connection and can be directly referenced in Profiling Policy rules as well as Authorization, Posture, and Client Provisioning policy rules. Other attributes such as NAS-Port-Type, NAS-IP-Address, Called-Station-Id, NAS-Port-Id, and NAS-Identifier can also provide valuable information on connection type and specific location of the endpoint connection.
AnyConnect Identity Extensions (ACIDex)
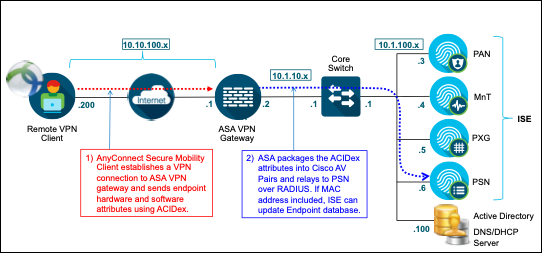
Remote Access Virtual Private Network (VPN) clients represent a special use case for the ISE Profiler. ISE needs to first learn an endpoint’s MAC address before it can create a new endpoint record. An IP address is only useful if a binding exists to a known MAC address. This binding cannot be learned for remote VPN clients since its Local Area Network (LAN) connection is to a remote network, unmanaged and unknown to ISE. The VPN client’s connection to the managed network device (a VPN gateway) occurs over a Layer 3 network. The client only reveals its Internet IP address to the gateway, not its local MAC address. Without a valid MAC address ISE is unable to add or update the endpoint record.
AnyConnect Identity Extensions (ACIDex) is a feature of the Cisco AnyConnect Secure Mobility Client which helps to solve this issue. ACIDex, also referred to as Mobile Posture, allows the AnyConnect VPN client to communicate endpoint attributes to the Cisco Adaptive Security Appliance (ASA) over a remote access VPN connection. The ASA can consume these attributes locally to make policy decisions, but can also relay the attributes in RADIUS to ISE PSNs as Cisco attribute-value (AV) pairs. When ISE receives ACIDex attributes that includes client MAC address(es), the PSN can update the corresponding endpoint in the Profiler database (Figure 9).
Table 3 provides a list of ACIDex Attributes along with sample values.
| Attribute | Description |
| mdm-tlv=ac-user-agent | AnyConnect Darwin_i386 4.4.02034 |
| mdm-tlv=device-platform | mac-intel |
| mdm-tlv=device-platform-version | 10.13.6 |
| mdm-tlv=device-type | MacBookPro11,1 |
| mdm-tlv=device-mac | 16-d0-98-01-23-45 |
| mdm-tlv=device-public-mac | 16-d0-98-01-23-45 |
| mdm-tlv=device-uid | CF1DA510777DC410F2809E5794A829AF74D841BB864E24FFB38C2A1154BBD4E4 |
The minimum releases required to support ISE integration are AnyConnect 3.1MR5 and ASA 9.2.1. AnyConnect 4.1 and ASA 9.3.2 add support for sending the UDID, MEID, or IMEI. These additional unique identifiers allow ISE to perform lookups to external Mobile Device Managers (MDMs) in the absence of MAC address.
When accessible to AnyConnect, the device-mac attribute is populated with the local MAC address. If multiple MAC addresses are detected, then multiple AV pairs for device-mac will be sent to ISE over RADIUS. AnyConnect uses the device-public-mac attribute to signal ISE which MAC address is used to establish the VPN connection. If device-public mac is not supported by the AnyConnect version, then ISE uses the first value for device-mac to set the active MAC for the VPN connection.
As mentioned, ACIDex attributes are sent as RADIUS Cisco AV pairs. The following is an example RADIUS attribute for ACIDex:
cisco-av-pair=mdm-tlv=device-platform=android
The RADIUS attributes listed in Table 2 are directly accessible for matching ISE Authorization Policy conditions. However, for the purpose of device classification, only three are populated in the ACIDEX dictionary and exposed for matching ISE Profiling Policy conditions:
- device-platform
- device-platform-version
- device-type
Device Sensor
The RADIUS probe also collects attributes sent in RADIUS accounting packets by the Device Sensor feature. This feature is covered in detail later in this guide under the Device Sensor section. You may also refer to Device Sensor - Catalyst Supported Platforms.
Configuring the RADIUS Probe
The RADIUS probe is one of the simplest probes to enable and deploy since the network access devices are typically configured to send RADIUS packets to the ISE Policy Service node running Session Services for network authentication, authorization, and accounting.
Procedure 4 Enable the RADIUS Probe in ISE
Step 1 Go to Work Centers > Profiler > Node Config > Deployment. From list of deployed nodes on the RHS pane, select the Policy Service node to perform profiling.
Step 2 Select the Profiling Configuration tab and check the box to enable the RADIUS probe. The probe is enabled by default on the interfaces configured for RADIUS services (Figure 10):
Step 3 Click Save to commit the change.
Step 4 Repeat the steps in this procedure for all other Policy Service nodes configured for RADIUS and Profiling Services.
Procedure 5 Verify Access Device Is Configured in ISE
This guide assumes that the network access devices (NAD) have already been configured in ISE under Work Centers > Profiler > Network Devices for standard RADIUS communications. If additional network devices need to be configured to support Device Sensor, complete the following steps:
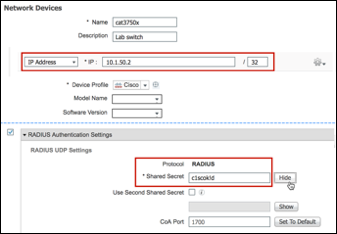
Step 1 Go to Work Centers > Profiler > Network Devices. If the switch or controller that will be used for AAA or Device Sensor functions is not in the list, click Add from the menu in RHS and complete the form (Figure 11):
a.Enter the Name of the network device. The name is often the same as the NAD’s hostname or name entered in DNS. It is administratively useful if the name indicates platform, location, and/or function.
Figure 11: Adding Network Access Devices
b.Enter the NAD IP Address that will be seen by ISE in RADIUS requests. It is possible to enter a range using the IP Address drop-down box, or to add multiple IP address entries using the gear icon to the right of the IP field. Multiple entries can address the case where RADIUS requests may be sourced from different interfaces. IP Ranges allow a single NAD entry to include multiple NADs.
c.Select (enable) the RADIUS Authentication Settings checkbox and enter the RADIUS Shared Secret key to be used between the NAS and ISE. This value must match the value configured on the NAD! To view the key entered, click the Show button to the right of the key (Figure 11).
d.For advanced configurations, RADIUS DTLS and KeyWrap may also be configured.
e.Click Submit when finished.
| ⓘ | Note: For initial deployments where primary goal is discovery, it is also possible to configure the Default Device under Administration > Network Resources > Network Devices. This option can be used to allow RADIUS from many devices that share the same RADIUS key using a single NAD entry. Network Device entries that specify IP ranges can also be used for this purpose. |
Procedure 6 Verify That Access Devices Are Configured to Send RADIUS to ISE PSN
This guide assumes that the network access devices have already been configured for RADIUS authentication, authorization, and accounting to the ISE Policy Service node (PSN). Here is a sample RADIUS configuration for a wired switch:
aaa authentication dot1x default group radius
aaa authorization network default group radius
aaa accounting dot1x default start-stop group radius
aaa accounting update newinfo periodic 2880
ip radius source-interface <Interface>
radius-server attribute 6 on-for-login-auth
radius-server attribute 8 include-in-access-req
radius-server attribute 25 access-request include
radius-server host <ISE_PSN_Address> auth-port 1812 acct-port 1813 key xxx
radius-server vsa send accounting
radius-server vsa send authentication
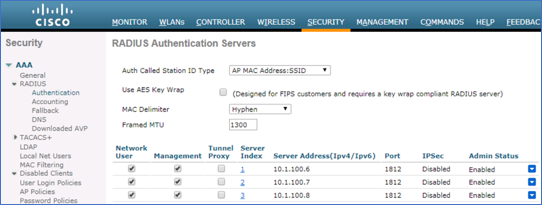
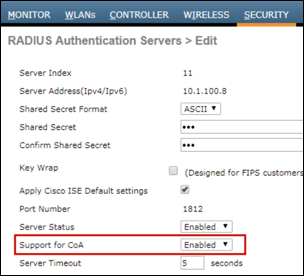
Step 1 Figure 12 shows a sample RADIUS Authentication server configuration for a Cisco Wireless LAN Controller. To access this configuration page, go to Security > AAA > RADIUS > Authentication in the WLC web administrative interface.
Figure 12: Global RADIUS Authentication Server Configuration for Wireless Controller Example
Step 2 Go to Security > AAA > RADIUS > Accounting. Similar entries should be present under the RADIUS Accounting server configuration for the wireless controller (Figure 13).
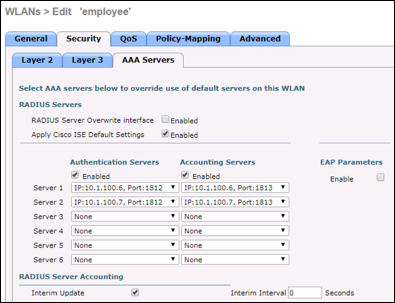
Step 3 Go to WLANs > (WLAN) > Security > AAA Servers. Each WLAN should be configured to designate the appropriate ISE Policy Service node(s) (Figure 14).
Cisco Best Practice: As shown in Figure 14, current software versions of the WLC include an option to Apply Cisco ISE Default Settings to automatically configure default best practice to help simplify and optimize integration with ISE.
Procedure 7 Verify RADIUS Probe Data
Step 1 Authenticate a new endpoint to the network.
Step 2 Go to the ISE Policy Administration node and navigate to Work Centers > Profiler > Endpoint Classification.
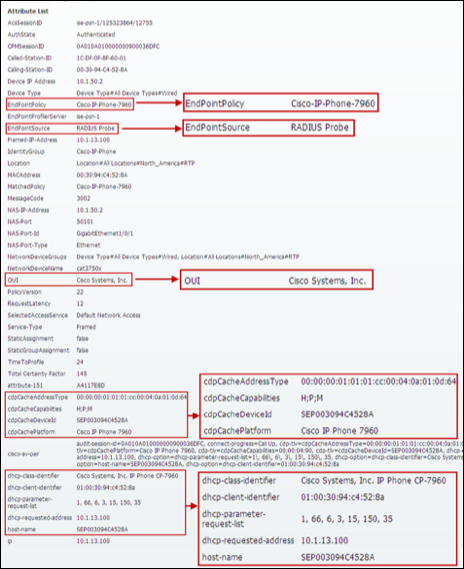
Step 3 Find and select the MAC address of the newly connected endpoint to display the attributes captured by the RADIUS probe.
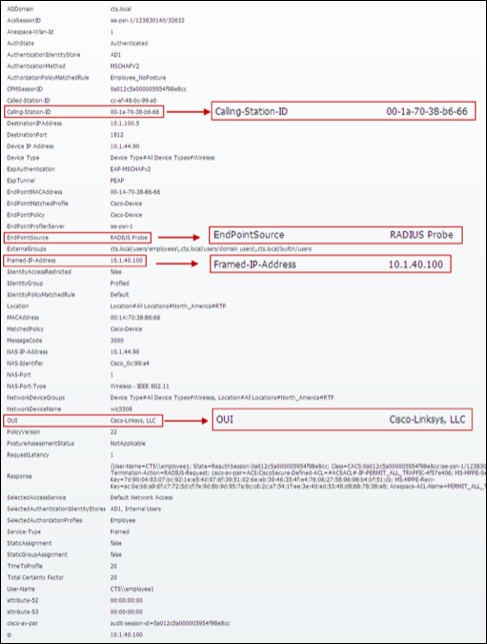
Step 4 Numerous attributes can be captured. The sample output in Figure 15 highlights just four: Calling-Station-ID, EndPointSource, Framed-IP-Address, and OUI.
Figure 15: RADIUS Probe Attributes Example
The Calling-Station-ID populates the MACaddress attribute. Additionally, the vendor OUI of the network adapter is determined to be Cisco-Linksys. In this example, the network adapter is a Linksys Wireless USB adapter. Conditions that match OUI are common entries in Profiling Policy rules. In some cases, such as a Nintendo or Sony game console, it may be all that is required to classify the endpoint.
The Framed-IP-Address value populates the ip attribute. We now have an IP-to-MAC address binding for this endpoint.
The EndPointSource attribute specifies the source of the last profile attribute update. In this case, it is the RADIUS probe that provided the last update to this endpoint record.
Additional RADIUS attributes can be used for profiling but since most of these are available directly to the Authorization Policy for creating policy conditions and rules, the focus is on the ones noted above.
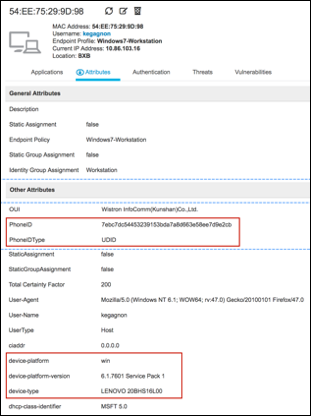
Figure 16 provides sample attributes collected for a remote access VPN client using ACIDex and the RADIUS probe.
The attributes highlighted in red correspond to the following Cisco AV pairs:
| PhoneID and PhoneIDType | mdm-tlv=device-uid |
| device-platform | mdm-tlv=device-platform |
| device-platform-version | mdm-tlv=device-platform-version |
| device-type | mdm-tlv=device-type |
The last three attributes (device-platform, device-platform-version, and device-type) can be used in ISE Profiling conditions.
Profiling Using the SNMP Trap Probe
The SNMP Trap probe is used to alert ISE Profiling Services to the presence (connection or disconnection) of a network endpoint and to trigger an SNMP Query probe.
To use the SNMP Trap probe, the access devices to which endpoints connect must be configured to send SNMP Traps to the ISE Policy Service node configured for Profiling Services. Figure 17 shows the topology for our example SNMP Trap probe.
If the RADIUS probe is already enabled, the SNMP Trap probe is likely not needed since RADIUS Accounting Start messages can also trigger the SNMP Query probe. The primary use case for this probe would be for a pre-deployment discovery phase whereby RADIUS has yet to be configured for network authentication, or cases where visibility alone is the end goal.
Configuring the SNMP Trap Probe
To use the SNMP Trap probe, it must first be enabled in ISE. As previously noted, the access devices to which endpoints connect must be configured to send SNMP Traps to the ISE Policy Service node configured for Profiling Services. ISE must also be configured to accept and process traps from these network access devices.
Procedure 8 Enable the SNMP Trap Probe in ISE
Step 1 Go to Work Centers > Profiler > Node Config > Deployment and select the Policy Service node to perform profiling from list of deployed nodes on the RHS pane.
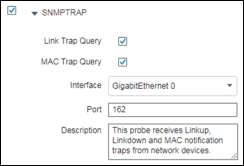
Step 2 Select the Profiling Configuration tab and check the SNMPTRAP box to enable the SNMP Trap probe (Figure 18):
Step 3 Check the boxes labeled Link Trap Query and MAC Trap Query to enable the probe to respond to each trap type.
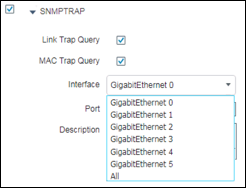
Step 4 Verify the ISE PSN interface used to receive traps. In most cases this will be the default GigabitEthernet 0 interface although it is possible to process traps received on other interfaces or to select All interfaces (Figure 19).
If you decide to process traps on other interfaces, make sure those interfaces are enabled and have an IP address assigned. These addresses must be configured in the access devices to point to the SNMP host trap target.
Step 5 Click Save to commit the change.
Step 6 Repeat the steps in this procedure for all other Policy Service nodes configured with Profiling Services where RADIUS Accounting is not being used.
Procedure 9 Add the Network Access Device to ISE
Typically, all network access devices that authenticate endpoints via RADIUS will be configured in ISE, but use of the SNMP Trap probe often implies that access devices are not yet configured for RADIUS. If these access devices are not yet configured for RADIUS in ISE, you must add the access devices that will be sending SNMP traps to ISE.
Step 1 Go to Work Centers > Profiler > Network Devices and click Add in the RHS pane.
Step 2 Enter the device Name and IP Address information (Figure 20). The IP address should include the IP address that will source SNMP traps. In simple configurations, there may be only one management IP address on the switch. In other cases, there can be multiple IP addresses and by default SNMP will typically use the IP address of the egress interface. If necessary, enter all possible IP addresses that access devices may use to source SNMP packets
Cisco Best Practice: If supported by the access device, use loopback interfaces for management traffic. Be sure to take advantage of options such as source-interface to set the specific interface and IP address that will source management traffic. This will provide a uniform address for all management traffic and also prevent connectivity failures if a specific interface is down.
Step 3 Check the SNMP Settings box if not already enabled.
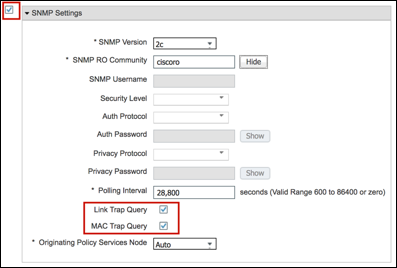
Step 4 Specify SNMP Version used by the access device and enter the SNMP RO Community string for SNMP versions 1 and 2c, or else enter the SNMPv3 credentials and configuration, as appropriate to the access device (Figure 21).
Step 5 Verify that the boxes for Link Trap Query and MAC Trap Query are selected. These settings allow ISE to accept or ignore SNMP traps received from specific access devices, or to accept only a specific type of trap.
| ⓘ | Note: Link Trap Query must also be enabled to trigger the SNMP Query probe for an interface based on RADIUS Accounting Start messages. |
Step 6 Save the changes once complete.
Step 7 Repeat the steps above for each access device that will send SNMP traps to the ISE Policy Service nodes for the purpose of triggering an interface query using the SNMP Query probe.
Procedure 10 Configure Access Devices to Send SNMP Traps to ISE Policy Service Node
Step 1 Go to the management console of the access device and verify that it is configured to send SNMP traps to the ISE Policy Service node running Profiling Services and enabled with the SNMP Trap probe.
Here is an example configuration from a Catalyst switch running Cisco IOS to send SNMP LinkUp/LinkDown traps as well as MAC Notification traps:
interface <Endpoint_Interface>
snmp trap mac-notification added
snmp trap mac-notification removed
!
mac address-table notification change
mac address-table notification mac-move
!
snmp-server trap-source <Interface>
snmp-server enable traps snmp linkdown linkup
snmp-server enable traps mac-notification change move
snmp-server host <ISE_PSN_IP_address> version 2c ciscoro
| ⓘ | Note: Cisco ISE does not currently support SNMP traps from the Wireless LAN Controller. |
Procedure 11 Verify SNMP Trap Probe Data
The SNMP Trap probe cannot populate endpoint attributes based on LinkUp or LinkDown traps alone as there is no associated MAC address in these traps. They primarily signal the interface on which link has been established or lost. However, MAC Notification traps do include the MAC address of the endpoint and can therefore provide updates to the ISE Internal Endpoints database.
Step 1 Go to the ISE Policy Administration node and navigate to Work Centers > Profiler > Endpoint Classification.
Step 2 Note the MAC address of target endpoint for testing and delete the endpoint.
Step 3 Disconnect and then reconnect the wired endpoint from the access switch configured for SNMP traps.
Step 4 Under Work Centers > Profiler > Endpoint Classification, find and select the MAC address of the newly connected endpoint and then select the Attributes sub-menu to display the attributes captured by the SNMP Trap probe (Figure 22).
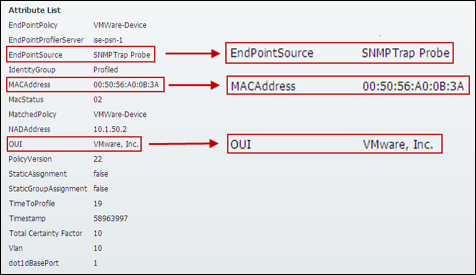
Key attributes highlighted include EndPointSource, MACAddress, and OUI.
EndPointSource confirms that the SNMP Trap probe is the source of the information.
| ⓘ | Note: In the example shown in Figure 22, all other probes were disabled and endpoint deleted from ISE database prior to running the test. |
MACAddress was learned from the MAC Notification trap information and the vendor OUI was determined by correlating against ISE’s OUI database. In this example, we can see that the client is running VMware, which uses a virtual network adapter.
As an optional verification that SNMP traps are being sent by the access switch, debug logging can be enabled to view the SNMP Link and MAC Notification traps as they are sent. The output below is from a Catalyst switch with the following debug enabled:
debug snmp packets
debug mac-notification
In the following example, upon enabling the switchport connected to a Cisco IP phone and Windows 7 PC connected to that phone, SNMP LinkUp traps are sent for both the phone and PC to the ISE PSN followed by MAC Notification traps for both. Only the traps related to the PC with MAC address 00:50:56:A0:0B:3A are highlighted.
Apr 26 16:53:06.735: %LINEPROTO-5-UPDOWN: Line protocol on Interface Vlan10, changed state to up
Apr 26 16:53:06.743: %LINEPROTO-5-UPDOWN: Line protocol on Interface Vlan13, changed state to up
Apr 26 16:53:06.743: SNMP: Queuing packet to 10.1.100.6
Apr 26 16:53:06.743: SNMP: V2 Trap, reqid 296, errstat 0, erridx 0
sysUpTime.0 = 58970958
snmpTrapOID.0 = snmpTraps.4
ifIndex.10 = 10
ifDescr.10 = Vlan10
ifType.10 = 53
lifEntry.20.10 = up
Apr 26 16:53:06.861: SNMP: Queuing packet to 10.1.100.6
Apr 26 16:53:06.861: SNMP: V2 Trap, reqid 299, errstat 0, erridx 0
sysUpTime.0 = 58970970
snmpTrapOID.0 = snmpTraps.4
ifIndex.13 = 13
ifDescr.13 = Vlan13
ifType.13 = 53
lifEntry.20.13 = up
Apr 26 16:53:06.995: SNMP: Packet sent via UDP to 10.1.100.6
Apr 26 16:53:07.246: SNMP: Packet sent via UDP to 10.1.100.6
Apr 26 16:53:08.706: %LINK-3-UPDOWN: Interface GigabitEthernet1/0/1, changed state to up
Apr 26 16:53:09.713: %LINEPROTO-5-UPDOWN: Line protocol on Interface GigabitEthernet1/0/1, changed state to up
Apr 26 16:53:09.713: SNMP: Queuing packet to 10.1.100.6
Apr 26 16:53:09.713: SNMP: V2 Trap, reqid 302, errstat 0, erridx 0
sysUpTime.0 = 58971255
snmpTrapOID.0 = snmpTraps.4
ifIndex.10101 = 10101
ifDescr.10101 = GigabitEthernet1/0/1
ifType.10101 = 6
lifEntry.20.10101 = up
Apr 26 16:53:09.964: SNMP: Packet sent via UDP to 10.1.100.6
Apr 26 16:53:12.280: MN: Enqueue MAC 0050.56a0.0b3a on port 1 vlan 10
MN: New Shadow entry..
Apr 26 16:53:12.280: MN : MAC Notify event for 0050.56a0.0b3a on port 1 vlan 10
Apr 26 16:53:12.456: MN: Enqueue MAC 0030.94c4.528a on port 1 vlan 10
MN: Got the last shadow entry..Index 11
Apr 26 16:53:12.456: MN : MAC Notify event for 0030.94c4.528a on port 1 vlan 10
MN: Shadow entry for Despatch..
Despatching trap for Index 2 Time: 58971575
MN: Wrapping history queue..
Apr 26 16:53:12.925: SNMP: Queuing packet to 10.1.100.6
Apr 26 16:53:12.925: SNMP: V2 Trap, reqid 305, errstat 0, erridx 0
sysUpTime.0 = 58971577
snmpTrapOID.0 = cmnMacChangedNotification
cmnHistMacChangedMsg.1 =
01 00 0A 00 50 56 A0 0B 3A 00 01 01 00 0A 00 30
94 C4 52 8A 00 01 00
cmnHistTimestamp.1 = 58971575
Apr 26 16:53:13.177: SNMP: Packet sent via UDP to 10.1.100.6
Apr 26 16:53:23.587: MN: Enqueue MAC 0030.94c4.528a on port 1 vlan 13
MN: New Shadow entry..
Apr 26 16:53:23.604: MN : MAC Notify event for 0030.94c4.528a on port 1 vlan 13
MN: Shadow entry for Despatch..
Despatching trap for Index 2 Time: 58972696
MN: Wrapping history queue..
Apr 26 16:53:24.132: SNMP: Queuing packet to 10.1.100.6
Apr 26 16:53:24.132: SNMP: V2 Trap, reqid 308, errstat 0, erridx 0
sysUpTime.0 = 58972697
snmpTrapOID.0 = cmnMacChangedNotification
cmnHistMacChangedMsg.1 =
01 00 0D 00 30 94 C4 52 8A 00 01 00
cmnHistTimestamp.1 = 58972696
Apr 26 16:53:24.384: SNMP: Packet sent via UDP to 10.1.100.6
For reference, in addition to the debug logging available on the access devices, ISE also supports its own debug logging. Debugging is beyond the scope of this guide, although an alternative method to validate the information received by ISE is to use the built-in TCP Dump utility found under Work Centers > Profiler > Troubleshoot > TCP Dump. This tool will allow ISE to capture SNMP traffic from the access device to the specified ISE Policy Service node interface (the one enabled with the SNMP Trap probe). This information can then be downloaded and displayed in human-readable format, or else in a standard packet capture format for import into a common packet analyzer such as Wireshark.
Profiling Using the SNMP Query Probe
The SNMP Query probe is used to send queries (or SNMP Get requests) to access devices and optionally to other infrastructure devices to collect relevant endpoint data stored in their SNMP MIBs. There are two general types of SNMP queries that the ISE Policy Service node performs:
- System Query (Polled)
- Interface Query (Triggered)
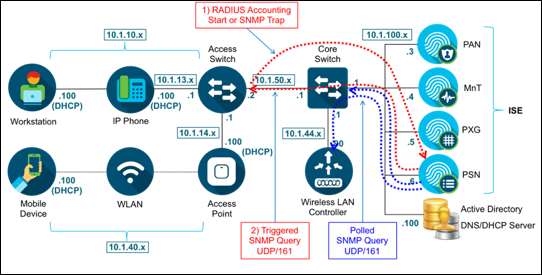
Figure 23 shows an example topology using the System Query probe.
System Query (Polled)
The System Query is performed periodically based on the Polling Interval set in NAD configuration of ISE. The default setting of 28,800 seconds (8 hours) is the recommended minimum interval to avoid excessive polling.
The polling process can be an invaluable method to learn about endpoints that stay connected but never or rarely authenticate. SNMP polling serves as a “catch-all” for these devices and once discovered, can trigger additional probes such as DNS and NMAP scanning.
The SNMP MIBs polled include the following:
- IF-MIB
- SNMPv2-MIB
- IP-MIB
- CISCO-CDP-MIB
- CISCO-VTP-MIB
- CISCO-STACK-MIB
- BRIDGE-MIB
- OLD-CISCO-INTERFACE-MIB
- CISCO-LWAPP-AP-MIB
- CISCO-LWAPP-DOT11-CLIENT-MIB
- CISCO-AUTH-FRAMEWORK-MIB
- EEE8021-PAE-MIB: RFC IEEE 802.1X
- HOST-RESOURCES-MIB
- LLDP-MIB
The key attributes collected include the following entries:
- Bridge, IP (ARP)
- cdpCacheEntry (Wired only)
- lldpLocalSystemData (Wired only)
- lldpRemoteSystemsData (Wired only)
- cLApEntry (WLC only)
- cldcClientEntry (WLC only)
If multiple Policy Service nodes have SNMP Query enabled, SNMP polling of network devices is distributed amongst all available PSNs unless specific PSNs are configured to poll a given network device. Under the configuration of each network access device is a setting (Originating Policy Service Node) which determines which PSN performs the periodic polling for that NAD. By default, the assigned PSN is set to “Auto” which means that the system will automatically assign the PSN to perform the polling. Once set, the automatically assigned value does not change unless the PSN is deregistered, the NAD is recreated, or the admin sets a specific PSN to perform the polling.
Cisco Best Practice: If the entire ISE deployment resides in a single campus, the default “Auto” setting is suitable. In distributed deployments, the arbitrary assignment can lead to inefficient polling where a NAD is polled by a remote PSN, potentially in another geography, rather than a PSN in closer network proximity. Therefore, it is recommended that the Originating Policy Service Node be set to a deliberate value to ensure optimal polling with minimal latency and WAN congestion.
The ISE admin interface is appropriate to make changes to a small number of NADs. To update the network device parameters for a large number of NADs it is recommended to use the file Import option under Work Centers > Profiler > Network Devices or else leverage the ERS API to programmatically make mass changes.
Address Resolution Protocol (ARP) table information is also collected during this polled query to build the IP-MAC ARP Cache table in ISE. In environments where endpoints are connected to Layer 2-only switchports, it may be desirable to configure upstream Layer 3 devices (for example, branch routers or Layer 3 distribution switches) as ISE network access devices if they contain the ARP table information for the endpoints. This may be required to provide IP-to-MAC binding information in deployments that do not have RADIUS configured on the access devices or in which DHCP probes are not able to collect this data. In the example topology (Figure 23), the Core or Distribution Switch may be polled to acquire ARP information for the wireless clients or for a downstream Layer 2 switch (not displayed).
Interface Query
Interface queries are triggered by either a RADIUS Accounting Start packet (requires RADIUS probe) or an SNMP LinkUp/MAC Notification trap (requires SNMP Trap probe).
Cisco Best Practice: To simplify the deployment and to reduce traffic overhead due to SNMP traps, when possible, use the RADIUS probe to trigger SNMP Query based on RADIUS Accounting Start messages. To further reduce traffic overhead, Device Sensor may be deployed; SNMP Interface Query is not required with Device Sensor since relevant attributes can be sent automatically as part of the Sensor’s RADIUS Accounting update.
Whereas System Queries read the access device MIBs, Interface Queries request the MIBs or portions of MIBs that concern only a particular interface for which the alert is received. These triggered queries retrieve the following data from the access device:
- Interface data (ifIndex, ifDesc, etc)
- Port and VLAN data
- Session Data (if interface type is Ethernet)
- CDP data (Cisco devices)
- LLDP data
Some of the key profiling attributes collected during the triggered Interface Query include the Cisco Discovery Protocol (CDP) and Link Layer Discovery Protocol (LLDP) tables. CDP and LLDP are link protocols that allow the switch to dynamically learn attributes of the connected endpoint. Many devices, including IP video equipment, network infrastructure, and Cisco appliances, support these protocols, and a growing number of Internet of Things (IoT) devices are leveraging LLDP to communicate endpoint details to the network. There are numerous CDP/LLDP agents available on a broad range of client operating systems at minimal or no charge. Most major IP phone and camera manufactures support CDP or LLDP. Consequently, many endpoints can be classified based on this information alone.
| ⓘ | Note: After an initial interface query, the Policy Service node will not attempt another SNMP query for the same endpoint within the same 24-hour period. This is to limit the load on the network and ISE where excessive reauthentications for the same endpoint could generate extreme volumes of SNMP traffic and processing. The SNMP Interface Query interval is not configurable. |
The following output shows a sample of the type of information you can collect using SNMP Query to collect CDP data for connected endpoints.
cat3750x#sh cdp neighbor detail
-------------------------
Device ID: ap1602
Entry address(es):
IP address: 10.1.10.100
IPv6 address: FE80::6E20:56FF:FE13:E9FC (link-local)
Platform: cisco AIR-CAP1602I-A-K9, Capabilities: Trans-Bridge Source-Route-Brid
ge IGMP
Interface: GigabitEthernet1/0/13, Port ID (outgoing port): GigabitEthernet0
Holdtime : 131 sec
Version :
Cisco IOS Software, C1600 Software (AP1G2-K9W8-M), Version 15.3(3)JF4, RELEASE S
OFTWARE (fc1)
Technical Support: http://www.cisco.com/techsupport
Copyright (c) 1986-2017 by Cisco Systems, Inc.
Compiled Sat 09-Dec-17 17:54 by prod_rel_team
advertisement version: 2
Duplex: full
Power drawn: 15.400 Watts
Power request id: 23811, Power management id: 2
Power request levels are:15400 13000 0 0 0
Management address(es):
IP address: 10.1.10.100
-------------------------
Device ID: SEP001F6C7EE6A2
Entry address(es):
IP address: 10.1.13.101
Platform: Cisco IP Phone 7971, Capabilities: Host Phone Two-port Mac Relay
Interface: GigabitEthernet1/0/9, Port ID (outgoing port): Port 1
Holdtime : 139 sec
Second Port Status: Down
Version :
SCCP70.8-4-4S
advertisement version: 2
Duplex: full
Power drawn: 14.900 Watts
Power request id: 59042, Power management id: 2
Power request levels are:14900 0 0 0 0

-------------------------
| ⓘ |
Note: The SNMP Query probe queries NADs, not endpoints. To query the actual endpoints connected to network devices, the NMAP probe must be used. The NMAP probe can trigger an endpoint query based on the detection of open SNMP ports on the endpoint. Endpoint query using SNMP is configurable in the NMAP probe configuration. Additional details on the NMAP probe are covered in a later section of this guide. Ensure that IP Device Tracking is working for the endpoint! |
Configuring the SNMP Query Probe
To use the SNMP Query probe, the network device must be configured to accept SNMP requests from the ISE Policy Service node using a Read-Only (RO) community. ISE must also have the SNMP device configured as a network device along with appropriate SNMP community strings. For a triggered query to occur, either the RADIUS probe or SNMP Trap probe must be enabled and associated components must be configured correctly. Finally, to retrieve CDP or LLDP information, the endpoint must support CDP or LLDP and either or both of these protocols must be enabled on the access switch.
Procedure 12 Enable the SNMP Query Probe in ISE
Step 1 Go to Work Centers > Profiler > Node Config > Deployment and select the Policy Service node to perform profiling from list of deployed nodes on the RHS pane.
Step 2 Select the Profiling Configuration tab and check the box to enable the SNMP Query probe (Figure 24).
| ⓘ | Note: No specific PSN interface needs to be configured for the SNMP Query probe. SNMP queries will be sent to access devices based on the ISE appliance routing table. |
Step 3 Leave the default values for Retries, Timeout, and Event Timeout:
- Timeout (in milliseconds) specifies the amount of time to wait for an SNMP response.
- Retries specifies the number of times the Policy Service node will attempt to establish an SNMP session after an initial failed attempt.
- EventTimeout (in seconds) specifies the time to wait after a RADIUS Accounting Start or SNMP Trap trigger before sending a batched query to the access device.
| ⓘ | Note: In general, the default values require no modification. In some environments with longer delays across a Wide Area Network (WAN) between PSN and NAD, or cases where a large NAD may require additional time to process queries, the timeout can be increased from the default value of 1000 to a value of 2000 or higher. If SNMP timeouts are frequent, then attempt to resolve the source of delay (for example, applying Quality of Service to SNMP traffic or increasing WAN bandwidth) rather than continuously increasing the SNMP timeout value in ISE. |
Step 4 For triggered interface queries, verify that RADIUS probe is enabled. If RADIUS is not configured on the network access devices, verify that the SNMP Trap probe is enabled.
Step 5 Click Save to commit the change.
Step 6 Repeat the steps in this procedure for all other Policy Service nodes configured with Profiling Services.
Procedure 13 Configure the Network Device in ISE (Network Resources)
Typically, all network access devices that authenticate endpoints via RADIUS will be configured in ISE, so all that must be done is to verify the SNMP settings for each. If configuring SNMP Query probe for a network that does not have RADIUS authentication deployed, you must add each access device - and optionally select Layer 3 devices (for ARP information) - to the list of ISE network devices.
Step 1 Go to Work Centers > Profiler > Network Devices. If the device to be queried using SNMP is already present, simply select the device from the list, or else click Add from the RHS pane.
Step 2 For new devices, enter the device Name and IP Address information.
Step 3 Check the SNMP Settings box if not already enabled.
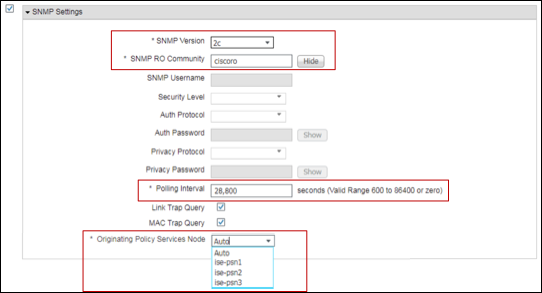
Step 4 In the SNMP Settings box, specify the SNMP Version used by the access device and enter the SNMP RO Community string for SNMP versions 1 and 2c, or else enter the SNMPv3 credentials and configuration as appropriate to the access device (Figure 25).
| ⓘ | Note: SNMP write privileges are typically not required for most ISE operations. An exception is SNMP-based CoA for network access devices that lack RADIUS-based CoA functionality. |
Step 5 For System (polled) Queries, set the Polling Interval and Originating Policy Services Node:
- Polling Interval: In general, a longer polling interval is recommended in networks that have RADIUS or DHCP probes deployed because the reliance on ARP information is reduced. A polling interval of 0 disables SNMP Polling while still allowing other SNMP services to be used with the network device.
- Originating Policy Services Node: Each PSN with the SNMP Query probe enabled will appear in the list. Select the optimal Policy Service node to perform periodic polling of the network device. This will usually be the PSN closest to the network device in terms of network bandwidth.
Step 6 For Interface (triggered) Queries that rely on SNMP traps, be sure one or both of the Trap Query options are set.
| ⓘ | Note: The Originating Policy Services Node setting does not apply to Interface queries as those are always sent by the PSN that received the trigger, such as RADIUS Accounting Start or SNMP Trap message. |
Step 7 Click Save to commit the changes once complete.
Step 8 Repeat the steps above for each access device that must be queried using SNMP by the ISE Policy Service nodes.
Cisco Best Practice: The ISE admin interface is appropriate to make changes to a small number of NADs. To update the network device parameters for a large number of NADs it is recommended to use the file Import option under Work Centers > Profiler > Network Devices or else leverage the ERS API to programmatically make mass changes.
Procedure 14 Configure Wired Access Devices to Accept SNMP Queries from the ISE PSN
Go to the management console of the wired access device and verify that it is configured to support SNMP Read-Only requests from the ISE Policy Service nodes with the SNMP Query probe enabled.
Here is an example configuration from a Cisco Catalyst switch running IOS to support SNMPv2c queries from ISE PSN using the read-only community string ciscoro:
snmp-server community ciscoro RO
snmp-server community ciscorw RW
| ⓘ | Note: Appendix C provides a sample SNMPv3 configuration to support triggered interface queries by the SNMP probe. |
Procedure 15 Configure Wireless Access Devices to Accept SNMP Queries from the ISE PSN
Step 1 Go to the web admin interface of the Wireless LAN Controller and verify that it is configured to support SNMP Read-Only requests from the ISE Policy Service nodes with the SNMP Query probe enabled.
Step 2 Go to Management > SNMP > Communities > SNMP v1 / v2c Community and configure one or more read-only community strings used by the ISE Policy Service nodes that may query this device.
Figure 26 shows an example configuration from a WLC configured to support SNMPv2c queries from ISE PSN using the read-only community string ciscoro.
If SNMPv3 is deployed, be sure to configure the appropriate settings under Management > SNMP > Communities > SNMP V3 Users.
Procedure 16 Configure Access Devices to support CDP and LLDP
To retrieve CDP and LLDP information from connected hosts, make sure the access device is configured to receive these protocols on the switchports. Although CDP is typically enabled by default on Cisco devices, LLDP is not. Therefore, be sure to enable LLDP globally if wish to collect this information using the SNMP Query probe or Device Sensor. The port must minimally receive LLDP to gather information about the connected host. The port only needs to transmit LLDP if connected to other switches and networked devices that utilize LLDP neighbor information.
cdp run
interface <Endpoint_Interface>
cdp enable
!
lldp run
interface <Endpoint_Interface>
lldp receive
lldp transmit
| ⓘ | Note: The Wireless LAN Controller does not support CDP/LLDP for wireless clients. |
Procedure 17 Verify SNMP Query Probe Data
Step 1 Go to the ISE Policy Administration node and navigate to Work Centers > Profiler > Endpoint Classification.
Step 2 Note the MAC address of target endpoint for testing and delete the endpoint.
Step 3 Disconnect and then reconnect the wired endpoint from the access switch configured for SNMP access by ISE.
Step 4 Under Work Centers > Profiler > Endpoint Classification, find and select the MAC address of the newly connected endpoint and then select the Attributes sub-menu to display the attributes captured by the SNMP Query probe.
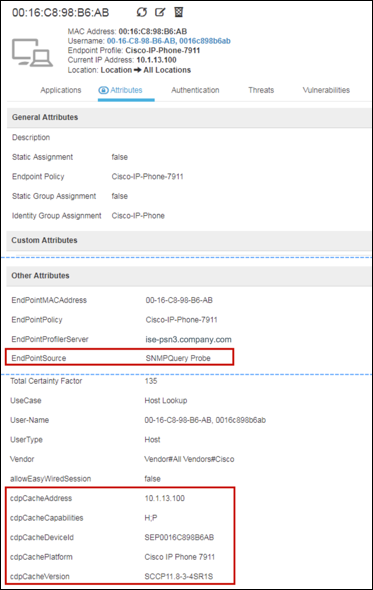
The example shown in Figure 27 is taken using only the SNMP Trap and SNMP Query probes to highlight the attributes collected using SNMP Query. The key attributes highlighted include the EndPointSource, the cdpCacheAddress, and cdpCachePlatform:
- EndPointSource informs us that the last profiling update came from the SNMP Query probe.
- The cdpCacheAddress provides the IP address and allows binding between the IP and MAC address.
- The cdpCachePlatform attribute provides a detailed description of the connected endpoint - in this example, a Cisco IP Phone 7911.
The dashed lines indicate sections where the output has been truncated for display purposes:
Step 5 To verify the expected attribute data, you can use the following commands from the access switch console:
show cdp neighbor detail
show lldp neighbor detail
Profiling Using the DHCP and DHCP SPAN Probes
As the name implies, the DHCP probes collect attributes from DHCP packets. DHCP attributes can be collected using one or both of the following:
- DHCP Probe
- DHCP SPAN Probe
DHCP Probe
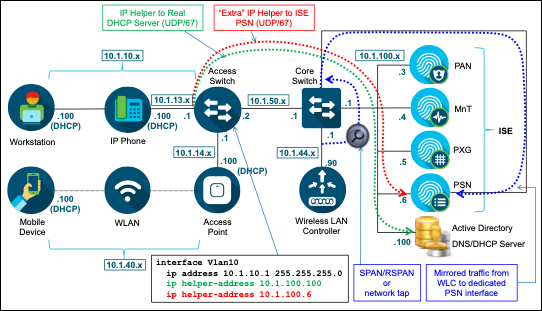
The DHCP Probe is intended for use with methods where the DHCP request is sent directly to the ISE Policy Service node, for example, as the result of DHCP Relay functions in the network. A common DHCP Relay in Cisco networks is the ip helper-address command applied to Layer 3 interfaces that are the gateway for local DHCP clients. Figure 28 shows an example topology using the DHCP probe.
In the diagram, the access switch has both an Employee Data VLAN 10 and a Voice VLAN 13. Under the interface configuration for each Switched Virtual Interface (SVI) is an ip helper-address command to forward local DHCP broadcast packets to the actual DHCP server at 10.1.100.100 (highlighted in green in Figure 28). This is the server that will respond to DHCP requests. Under the same interfaces, another ip helper-address command is configured to point to the ISE PSN interface enabled with the DHCP probe (highlighted in red). The ISE Policy Service node will not reply to these packets, but the goal is simply to send a copy of the requests to ISE for parsing of DHCP attributes.
It is possible to configure multiple IP Helper targets on Cisco devices to allow multiple ISE Policy Service nodes to receive copies of the DHCP requests.
Cisco Best Practice: To reduce the load on PSNs due to profiling and replication, it is recommended to minimize the number of PSN targets for DHCP relay. To achieve this while still providing redundancy, one of the following options may be deployed:
—Load Balancers: IP helper target is the virtual IP (VIP) of a PSN cluster.
—Anycast: Multiple PSNs or load balancer VIPs are represented by a single IP address and routing determines optimal target.
—Device Sensor: DHCP is locally filtered and forwarded over single RADIUS channel by the network access device.
| ⓘ | Note: ISE DHCP probes can parse traffic from both a DHCP Relay and a DHCP Proxy. A key difference between these methods is that DHCP Relay via ip helper-address command is capable of sending traffic to multiple destinations, thus allowing multiple real DHCP servers and ISE Policy Service nodes to receive a copy of the DHCP requests. DHCP Proxy, on the other hand, will send the request to only the primary DHCP server and only fall back to other configured DHCP targets if a valid response is not received. Although possible to configure the ISE nodes as the first entry to allow fallback to the actual DHCP server, such an implementation will delay the time required for an endpoint to acquire an IP address. This can impact the user experience, but may also result in the client timing out as it waits for a response. |
DHCP SPAN Probe
The DHCP SPAN probe is intended for use when traffic is mirrored to an interface on the ISE Policy Service node using methods such as Switch Port Analyzer (SPAN), Remote SPAN (RSPAN), or network taps. This method is primarily used when the basic DHCP probe using DHCP Relay is not available or possible.
Cisco Best Practice: For any given flow of DHCP traffic, only one probe should be selected to collect the attributes from that traffic. There is limited value in using both DHCP (IP Helper) and DHCP SPAN probes to collect attributes from the same DHCP traffic.
If available, it is recommended to use the DHCP probe rather than the DHCP SPAN probe. Sending only DHCP packets via DHCP Relay reduces the overall traffic load on the ISE Policy Service node to inspect and parse attributes from DHCP packets.
The DHCP SPAN probe can also be used to capture DHCP traffic from local subnet broadcasts, whereas use of DHCP Probe can capture only the DHCP traffic that is relayed by an upstream gateway. This may be necessary when the Layer 3 gateway is also the DHCP server for local clients. The Cisco IOS DHCP server will not relay DHCP for a segment if it is also configured to serve DHCP for that subnet. An alternative solution to this scenario is Device Sensor (discussed later in this guide).
The sample topology illustrates the use of SPAN or network tap to copy packets from wireless clients connected to the WLC to a dedicated interface on the Policy Service node (highlighted in blue in Figure 28). A dedicated interface is needed because SPAN destination ports may have special properties that restrict the sending and receiving of normal traffic destined to the PSN. Additionally, we do not want mirrored traffic to cause congestion on other critical interfaces of the PSN such as RADIUS. Using SPAN methods, it is possible to send more data to the SPAN port than it can handle, resulting in packet drops or delay of critical traffic.
DHCP Attributes
Both the DHCP and DHCP SPAN probes deliver the same key profiling attributes to ISE. These include some of the following:
- DHCPv4 Options
- client-fqdn (Option 81)
- dhcp-class-identifier (Option 60)
- dhcp-client-identifier (Option 61)
- dhcp-message-type (Option 53)
- dhcp-parameter-request-list (Option 55)
- dhcp-requested-address (Option 50)
- dhcp-user-class-id (Option 77)
- host-name (Option 12)
- mud-url (Option 161)
- DHCPv6 Options
- dhcpv6-user-class (Option 15)
- dhcpv6-vendor-class (Option 16)
- dhcpv6-vendor-opts (Option 17)
- dhcpv6-mud-url (Option 112)
Since DHCP provides both a MAC address (dhcp-client-identifier) and an IP address (dhcp-requested-address), it is also capable of establishing IP-to-MAC address bindings for the ISE ARP cache table. This is useful in supporting other probes that rely on IP address rather than MAC address. To apply and save the attributes they provide about a specific endpoint into the ISE database, the IP address needs to be correlated to a specific endpoint based on its MAC address.
In addition to dhcp-client-identifier and dhcp-requested-address, other key attributes include dhcp-class-identifier, dhcp-user-class-id, and dhcp-parameters-request-list. The class identifier is often used to convey platform or OS information. Class identifier as well as User Class ID may be customized on some client operating systems like Mac OS and Microsoft Windows, respectively, to be used as unique corporate identifiers for profiling or to return unique scope values by the DHCP server.
The dhcp-parameters-request-list offers a potentially unique indicator of the device type since the values and sequence of parameters requested are often unique to a limited set of device types or operating systems. For example, a dhcp-parameters-request-list value of 1, 3, 6, 15, 119, 252 is indicative of an Apple iOS device such as an iPad, iPod, or iPhone.
If a standard hostname, domain name, or Fully Qualified Domain Name (FQDN) naming convention is deployed to specific endpoints, these attributes can be used to classify them. For example, if all corporate Mac OS clients are assigned a name such as jsmith-macos, the host-name attribute or client-fqdn attribute can be used in a condition to classify managed Mac OS endpoints. Similarly, if there is a convention to populate the DNS name for corporate badge access readers to something like bldg10-access, then this attribute can be used to detect and classify building automation devices.
Caution must be taken to not confuse profile attributes as identity, but attributes can add a certain level of credence that the endpoint is a certain type. For example, the Authorization Policy can be used with profiling to deny full access privileges to employees where the host-name attribute of their PC (as indicated by matching Endpoint Profile policy) does not include expected values.
The Internet Assigned Numbers Authority (IANA) assigned DHCPv4 Option 161 and DHCPv6 Option 112 to allow clients to advertise their Manufacturer Usage Description (MUD) URL. The MUD URL is unique to different device types or device classes. As device manufacturers leverage these options, ISE can dynamically classify the endpoints based on the string values contained in the URL.
In general, DHCP offers many profiling benefits and will often be a cornerstone for classifying a large percentage of endpoints in any environment as the majority of endpoints provide some DHCP “fingerprint”.
Configuring the DHCP and DHCP SPAN Probes
To use the DHCP probe, the access devices (or next hop gateway for Layer 2-only access devices) must be configured to send DHCP Relay or DHCP Proxy packets to the ISE PSN configured for Profiling Services. To use the DHCP SPAN probe, the network must send copies of the network traffic, preferably a filtered subset of traffic containing DHCP only, to the ISE PSN through a dedicated interface.
Another requirement for either DHCP-based probe to be effective is that endpoints of interest must obtain their IP address using DHCP. This may seem obvious, but many customers may have clientless devices that have static IP address assignments. In those cases, it may be possible to deploy static DHCP reservations to allow endpoint to keep a specific IP address while also allowing centralized management of IP addressing and support for ISE profiling via DHCP.
Procedure 18 Enable DHCP Probes in ISE
Step 1 Go to Work Centers > Profiler > Node Config > Deployment and select the Policy Service node to perform profiling from list of deployed nodes on the RHS pane.
Step 2 Select the Profiling Configuration tab.
* To add support for the DHCP probe (for use with IP Helper, for example), check the box labeled DHCP as shown in the upper left corner of Figure 29.
* To add support for the DHCP SPAN probe (for use with SPAN or other port mirroring solution), check the box labeled DHCPSPAN (Figure 30).
Step 3 Select the Interface or interfaces to be used for collecting DHCP traffic. If ISE has only one interface, the default interface (GigabitEthernet 0) will be sufficient. If more than one interface will process DHCP traffic for Profiling, then select All.
- For use with IP Helper (DHCP Relay), the interface used is often the default interface used for Session Services. However, in larger environments where higher volumes of DHCP traffic are expected, you may want to use a dedicated interface - for example, GigabitEthernet 1, 2, 3, 4, 5 or bonded interface.
- For use with mirrored traffic (SPAN/RSPAN/taps) a dedicated interface should be selected.
Step 4 Click Save to commit the changes.
Step 5 Repeat the steps in this procedure for all other Policy Service nodes configured with Profiling Services.
| ⓘ | Note: Due to the requirements for traffic mirroring, it may not be possible or feasible to configure multiple Policy Service nodes to receive SPAN traffic. Additionally, if mirroring the same traffic flows, it may not be desirable to forward the same information to multiple Policy Service nodes. Although adding redundancy, doing so can greatly increase the load on the ISE nodes and result in unnecessary duplication of profiling data which must be correlated and synchronized across other nodes. |
Procedure 19 Add the Network Device to ISE (Network Resources)
There are no specific steps required to complete this procedure. Although access devices supporting RADIUS or SNMP may already be added to the list of ISE Network Devices (under Work Centers > Profiler > Network Devices), it is not required that a network device be added to ISE solely for the purpose of forwarding of DHCP to the DHCP probe or DHCP SPAN probe.
Procedure 20 Configure ISE Policy Service Node Interface to Receive DHCP Relay Packets
(DHCP Probe Only)
If the DHCP Probe is enabled on the default GigabitEthernet 0 interface, this procedure is complete. If another interface is to be used to receive DHCP Relay traffic, complete the following steps.
Step 1 Physically connect the desired interface to a network switchport.
Step 2 Access the ISE PSN console (CLI). Enable the appropriate interface and assign a valid IP address as shown in Figure 31.
Step 3 Verify all processes are in a running state as instructed.
Step 4 Verify the configuration of the newly configured interface and that it is enabled (NOT in shutdown) by using the show running-config command (Figure 32).
Step 5 Verify connectivity to the new ISE probe interface by sending an ICMP ping from a network device that needs to relay DHCP.
Step 6 Save changes using the CLI command copy running-config startup-config.
Procedure 21 Configure ISE Policy Service Node Interface to Receive SPAN Traffic
(DHCP SPAN Probe Only)
Step 1 Physically connect the desired interface to the appropriate SPAN destination port or network tap interface.
Step 2 Access the ISE PSN console (CLI). Enable the appropriate interface by simply entering no shutdown while in configuration mode for the desired interface.
Step 3 Save changes using the ISE CLI command copy running-config startup-config.
| ⓘ |
Note: For Policy Service Nodes Running on a Virtual Appliance To use a dedicated interface for profiling, it is assumed that additional virtual interfaces are configured for the virtual appliance. If not completed at the time of install, it will be necessary to shut down the ISE node and update the hardware and networking configuration of the virtual appliance for the required interface(s) before continuing with the ISE configuration. Additionally, to accept SPAN/mirror traffic on the ISE DHCP SPAN interface, the VMware appliance requires promiscuous mode to be set on the virtual switch interface. To enable this mode in VMware, go to VMware Host > Configuration > Hardware > Networking > vSwitch > Security and set Promiscuous Mode: Accept (Default = Reject), as shown in the example diagram: |
Procedure 22 Configure Wired Access Devices to Relay DHCP Packets to the ISE PSN
(DHCP Probe Only)
Step 1 Go to the management console of the Cisco Catalyst switch or router. Under each routed interface that connects to an endpoint subnet where DHCP traffic originates, add the following commands:
interface <Endpoint_VLAN>
ip helper-address <ISE_PSN_address>
The IP address specified should be to the PSN interface with the DHCP Probe enabled. For redundancy, you can add more IP Helper statements to relay DHCP to other Policy Service nodes, but the recommendation is to keep this at a minimum, say two destinations maximum, to reduce traffic duplication. Each PSN will process the traffic received, replicate as needed, and potentially contend for endpoint ownership. As discussed earlier in this section, alternative approaches to capture DHCP with redundancy include the use of load balancers, Anycast, or Device Sensor.
| ⓘ | Note: ISE is not a DHCP server. Therefore, ISE will only consume DHCP messages and not respond to client requests for a DHCP address. The one exception is the specific feature that allows PSNs to provide captive portal services for third-party and legacy Cisco access devices. This feature is disabled in ISE by default. |
Procedure 23 Configure Wireless Access Devices to Relay DHCP Packets to the ISE PSN (DHCP Probe Only)
It is recommended that you configure WLCs in DHCP Bridging mode rather than DHCP Proxy mode so that all DHCP packets are forwarded from the wireless clients to the ISE PSN.
Step 1 Go to the web administrative interface of the Cisco Wireless LAN Controller or Wireless Services Module and navigate to Controller > Advanced > DHCP > DHCP Parameters.
Step 2 If the checkbox labeled Enable DHCP Proxy is checked (enabled), uncheck (disable) it (Figure 33).
For each WLAN configured on the WLC using DHCP, be sure the upstream gateway is configured to relay DHCP to the ISE Policy Service node as described in the previous procedure.
Cisco Best Practice: Cisco Wireless LAN Controllers support Device Sensor functionality. This feature allows the WLC to locally capture DHCP client attributes and send them to ISE over RADIUS Accounting Updates using the RADIUS probe. However, as of WLC version 8.7.x, the WLC sensor is limited to sending only DHCP Option 12 (host-name) and Option 60 (dhcp-class-identifier). Therefore, if additional DHCP attributes are required to more fully profile endpoints, it is recommended to use DHCP probe to capture all required options. The Device Sensor feature in Cisco IOS-based devices do not have this same limitation.
Procedure 24 Configure Network Devices to Send Copies of DHCP Traffic to the PSN (DHCP SPAN Probe only)
There are multiple ways to mirror traffic to the ISE Policy Service node. This procedure will show one common way using basic SPAN on a Cisco Catalyst switch.
Step 1 Determine the interface(s) or VLAN(s) that will be the source of DHCP traffic. Certain chokepoints such as the egress interface of a WLC or connection to DHCP server(s) can make ideal places to capture all client DHCP packets.
Step 2 In the following example, interface GigabitEthernet 1/1 is a trunk connection to a Cisco Wireless LAN Controller. Interface GigabitEthernet 2/37 is a switchport connection to a Cisco UCS® server running VMware ESXi. The ESXi server hosts an ISE virtual appliance configured as a Policy Service node with profiling enabled. Interface GigabitEthernet 2/37 is link to an ESXi virtual interface linked to the ISE PSN on Gigabit Ethernet 3.
interface GigabitEthernet1/1
 description Cisco WLC ETH0 (Port 1)
 switchport
 switchport trunk encapsulation dot1q
 switchport trunk allowed vlan 40-44
 switchport mode trunk

interface GigabitEthernet2/37
 description UCS1 SPAN (port 3 of 6)
 switchport
Step 3 Configure SPAN to capture all inbound and outbound traffic on the Cisco WLC switch connection and forward to the ISE PSN connection. To do this, interface GigabitEthernet 1/1 is set as the SPAN source and interface GigabitEthernet 2/37 is the destination. Since ISE does not need to see tagged packets, 802.1Q trunking is not enabled on the switchport.
cat6500(config)# monitor session 1 source interface gigabitEthernet 1/1 both
cat6500(config)# monitor session 1 destination interface gigabitEthernet 2/37
Step 4 Verify the configuration and save.
cat6500# show monitor session 1

Session 1
---------
Type : Local Session
Source Ports :
Both : Gi1/1
Destination Ports : Gi2/37
Egress SPAN Replication State:
Operational mode : Centralized
Configured mode : Centralized (default)
Procedure 25 Verify DHCP Probe Data
Step 1 Go to the ISE Policy Administration node and navigate to Work Centers > Profiler > Endpoint Classification.
Step 2 Note the MAC address of target endpoint for testing and delete the endpoint.
Step 3 Disconnect and then reconnect the endpoint from the access device where the gateway interface has IP Helper forwarding DHCP to the ISE PSN.
Under Work Centers > Profiler > Endpoint Classification, find and select the MAC address of the newly connected endpoint and then select the Attributes sub-menu to display the attributes captured by the DHCP probe (Figure 34). The example shown is taken using only the DHCP probe to highlight the attributes collected using DHCP. The dashed lines indicate sections where the output has been truncated for display purposes.
The key attributes highlighted include:
- EndPointSource
- OUI
- client-fqdn
- dhcp-class-identifier
- dhcp-client-identifier
- dhcp-parameter-request-list
- dhcp-requested-address
- dhcp-user-class-id
- host-name
The EndPointSource shows that the DHCP probe was the source of last attribute update.
The dhcp-client-identifier typically provides the MAC address, which in turn provides the vendor OUI information through correlation from the MAC Address-OUI mapping table.
The dhcp-requested-address is the IP address requested by the endpoint. Along with the dhcp-client-identifier, this provides the binding between the IP and MAC address.
The dhcp-class-identifier often provides a unique platform-specific attribute and in some cases provides a detailed description of the connected endpoint - in this example, MSFT 5.0 which is the value assigned to Microsoft Windows workstations.
The dhcp-parameter-request-list also indicates that the endpoint is a Windows Workstation—more specifically a Windows 10 Workstation—since the exact sequence 1, 3, 6, 15, 31, 33, 43, 44, 46, 47, 121, 249, 252 is typically associated to Windows 10 clients.
The client-fqdn and host-name both provide the machine name. Vendors often use default naming values for their devices which can be used to classify specific device types. Customer may also assign machine names per a specific naming standard which can indicate both device type as well as an asset managed by the organization.
The dhcp-user-class-id is not typically set by default. In this example, the customer has assigned managed workstations a unique identifier to increase the confidence of the device type as well as its status as a corporate asset. For Windows clients, this value can be set at the command line but can also be set through Group Policy Objects (GPOs) managed in Microsoft Active Directory. The value is typically presented in hexadecimal. In this example, 57:69:6e:64:6f:77:73:31:30:2d:43:6f:72:70 translates into Windows10-Corp in ASCII text.
In summary, one or more attributes can classify network endpoints using DHCP. As explained later in the Device Sensor section of this guide, Cisco offers the capability to collect DHCP and other information using a local classification technology referred to as Device Sensor. This feature makes it possible to collect DHCP attributes even when it is not possible through IP Helper or SPAN techniques. This solution offers a much more scalable approach to endpoint attribute collection and classification.
Profiling Using the HTTP Probe
Web browsers typically identify themselves, including application type, operating system, software vendor, and software revision by submitting a characteristic identification string to the web server. In HTTP/HTTPS, this is transmitted in an HTTP request-header field known as User-Agent.
The User-Agent is the primary attribute collected using the HTTP probe. ISE profiling captures the web browser information from the User-Agent attribute, as well as other HTTP attributes from the request messages, and adds them to the list of endpoint attributes. Cisco ISE provides many default profiles which are built into the system to identify endpoints based on the User-Agent attribute.
The primary methods used to capture a client’s User-Agent and update the endpoint database for profiling include the following:
- URL Redirection
- HTTP Probe with Direct Portal Access (example, Sponsor or My Devices)
- HTTP Probe with SPAN (and other traffic mirroring methods)
- RADIUS Probe with Device Sensor
Capturing the User Agent with URL Redirection
ISE uses URL redirection for a number of user session services including Central WebAuth (CWA), Hotspot, Client Provisioning, Posture Assessment, and Native Supplicant Provisioning (NSP). In each of these use cases, the endpoint’s web browser is redirected to the ISE Policy Service node. During this process, it is possible for ISE to capture the User-Agent attribute.
The sample topology in Figure 35 illustrates the use of URL redirection as a part of the initial authorization of the endpoint, ISE can send a URL redirect to the access device (highlighted in green in Figure 35). When the client opens a web browser, they are redirected to the Policy Service node (highlighted in red) for a specified service such as CWA.
URL redirection can be a function of the network access device (NAD). An example of a NAD-initiated redirect is Local WebAuth whereby the wired switch or wireless controller redirects a client’s browser to the ISE Guest portal to provide a web authentication page.
URL redirection can also be initiated as a RADIUS authorization from ISE to the network access device. An example of a URL redirect triggered by a RADIUS authorization is CWA whereby the access device helps facilitate the redirection, but the actual session is established between the client and the ISE Policy Service node and is tracked via a unique session ID.
When URL redirection is triggered as a result of RADIUS authorization, ISE automatically discovers and profiles the endpoint in one process without an explicit IP-to-MAC address binding. This is possible since the portal service can directly correlate the HTTP/HTTPS traffic to an existing RADIUS session which includes the MAC address of the endpoint.
| ⓘ | Note: Capture of the client browser’s User-Agent occurs automatically and does not require the HTTP probe be explicitly enabled. The capture does require that the device/user responds to the form in the web portal. Redirection to the portal alone is not sufficient to capture and update the User-Agent in the endpoint record. |
HTTP Probe with Direct Portal Access
When the HTTP probe is enabled the Profiling Service will attempt to capture the browser user agent for client traffic that hits one of its web portals, not just redirected web traffic. This allows PSNs to acquire the browser user agent string for connected users that access non-redirected web pages on the PSN such as the Sponsor or My Devices portals. In this scenario, the PSN leverages its IP-to-MAC address binding table to correlate the connection to an existing endpoint. Another major advantage of using ISE web services to capture user agents is that the PSN is able to see both HTTP as well as encrypted HTTPS traffic since it is the server that terminates the connection.
Enabling the HTTP Probe checkbox also adds support for promiscuous collection of HTTP traffic as would occur when the PSN is on the same local network as client web traffic, or when Switch Port Analyzer (SPAN) or similar network tap feature is used to capture traffic from a network link.
HTTP Probe Using SPAN
To use the HTTP probe with general web traffic that is not terminated by ISE web services, an optional method is to copy, or mirror, the web traffic to an interface on the ISE Policy Service node using methods such as SPAN, RSPAN, or network taps. This method is primarily used when URL redirection is not feasible or possible, or when Device Sensor cannot be deployed.
The SPAN method can be useful for capturing web traffic through specific choke points in the network such as a link to/from a web proxy or connection to the Internet. ISE is a passive monitor in this process so does not interact or impact the HTTP communication session.
| ⓘ | Note: The HTTP probe listens to communications from web browsers on both TCP port 80 and port 8080. HTTP probe using SPAN does not listen to HTTPS traffic (for example, TCP port 443) since the traffic is encrypted and not terminated by ISE. |
Cisco Best Practice: When applicable, such as in a RADIUS-based environment, Device Sensor or URL redirection is the preferred method over HTTP SPAN. Capturing just the key User-Agent attribute during redirection reduces the overall traffic load on the ISE Policy Service node to inspect and parse attributes from HTTP packets.
If URL redirection is not applicable, for example in a deployment where NADs do not support Device Sensor, clients are not subject to URL redirection, or in an endpoint discovery phase where RADIUS has yet to be deployed to the access devices, the SPAN method is the preferred method as it still allows capture of the User-Agent without RADIUS or URL redirection as a requirement.
The sample topology in Figure 35 illustrates the use of SPAN or a network tap to copy packets from wireless clients connected to the WLC to a dedicated interface on the Policy Service node (highlighted in blue). A dedicated interface is needed because SPAN destination ports may have special properties that restrict the sending and receiving of normal traffic destined to the PSN. Additionally, we do not want mirrored traffic to cause congestion on other critical interfaces of the PSN such as RADIUS. Using SPAN methods, it is possible to send more data to the SPAN port than it can handle, resulting in packet drops or delay of critical traffic.
RADIUS Probe with Device Sensor
As explained later in the Device Sensor section of this guide, Cisco offers the capability to collect HTTP User-Agent and other information using a local classification technology referred to as Device Sensor. This feature makes it possible to collect the User-Agent attribute even when it is not possible through URL Redirection, direct ISE web portal access, or SPAN techniques. This solution offers a much more efficient and scalable approach to endpoint attribute collection and classification and is generally recommended over other methods when the network access devices support this feature for HTTP profiling.
HTTP Probe and IP-to-MAC Address Binding Requirement
Since HTTP traffic does not include the MAC address of an endpoint, it is critical that the ISE Policy Service node already have an IP-to-MAC address binding in its ARP cache table for an endpoint in order to properly correlate data sent to the HTTP probe. In other words, if the endpoint is not already known to ISE by its MAC address or if there is not an associated IP address, profiling data learned by the HTTP probe will be discarded, because there is no endpoint to which it can apply the learned User-Agent attribute. Consequently, it is required to learn the IP-to-MAC address binding via another probe prior to collecting HTTP data.
Probes that can be used to provide IP-to-MAC binding information include the following:
- RADIUS (via the Framed-IP-Address attribute)
- DHCP (via the dhcp-requested-address attribute)
- SNMP Query (via SNMP polling)
There are special HTTP profiling scenarios that offer exceptions to the IP-to-MAC binding requirement. These include cases where URL Redirection as a RADIUS authorization is used. Two such services include:
- URL Redirection with Client Provisioning
- URL Redirection with Central WebAuth
URL Redirection with Client Provisioning
Client Provisioning (CP) is the ISE session service that provides dynamic download of agent and configuration files to the endpoint to enable Posture Agent and Native Supplicant Provisioning (NSP) services. Client Provisioning relies on URL redirection. During the CP process, the Policy Service node must determine the client OS through its user agent to know which provisioning policy to apply. For example, if the endpoint is detected as a Windows client, the Windows posture agent should be selected for posture support. Similarly, if the endpoint is detected as an Android client, the Supplicant Provisioning files for an Android client should be installed on the endpoint.
When the Client Provisioning service learns the User-Agent attribute, ISE uses this knowledge by updating the profiling service with this information. Additionally, since Client Provisioning is part of an active session, ISE is able to apply this information to the MAC address (Calling-Station-ID) retrieved from the session cache. It is therefore possible to fully profile many endpoints using this process alone.
URL Redirection with Central WebAuth
Central WebAuth (CWA) relies on URL redirection. During the CWA process, the HTTP probe is able to capture the User-Agent attribute from the redirected HTTPS packets after decryption on the Policy Service node. Similar to Client Provisioning service, the guest flow is part of an active session from which ISE is able to retrieve the MAC address (Calling-Station-ID) from the session cache. This process allows HTTP probe to learn the User-Agent and associated MAC address required to populate the endpoint database.
In both scenarios—URL redirect with CP and URL redirect with CWA—ISE is able to apply the User-Agent attribute to a MAC address without a pre-existing IP-to-MAC address binding. HTTP SPAN methods always require a preexisting IP-to-MAC binding entry unless the mirrored traffic is taken from a segment that is Layer 2 adjacent to the endpoint. In this particular case, the packet source MAC address is that of the actual endpoint, and can be used to update the endpoint database accordingly.
Cisco Best Practice: Device Sensor is the recommended option to acquire the User-Agent attribute when supported by the NAD.
In the absence of Device Sensor support for HTTP profiling, leverage URL redirection for client provisioning and web-authentication use cases. URL redirection may already be a basic requirement based for the enabled ISE services including Client Provisioning (Posture, BYOD) and CWA, but in some cases, it may be desirable to deliberately force URL redirection even when these services are not required for the purpose of capturing the User-Agent. This can be accomplished through a one-time redirection to CWA or simply to an Acceptable Use Policy (AUP) page with Hotspot when the endpoint profile is set to Unknown or incomplete. The goal is to capture the User-Agent in the process and allow the resulting profile update to trigger a Change of Authorization (CoA). Upon reconnection, a new Authorization Policy rule can be assigned based on a more refined profile match.
URL redirection is generally preferred over HTTP SPAN as it allows the Policy Service node to acquire the User-Agent attribute with minimal traffic load versus packet mirroring methods that continuously capture and analyze all web traffic even after the user agent is learned. In addition, ISE is able to extract the User-Agent from encrypted HTTPS and allows profiling without first populating an ARP cache. Finally, URL redirection based on RADIUS authorization simplifies high-availability scenarios because the redirect is sent to the same PSN that terminated the RADIUS traffic and reduces replication.
For some scenarios such as access devices without RADIUS deployed the SPAN method may be the only feasible option.
In general, the HTTP probe provides a high level of fidelity for detecting client OS types via User-Agent. The HTTP probe is recommended when a policy based on platform or operating system is required, particularly for wireless environments where customers often need to provide differentiated based on device type (desktop or mobile).
HTTP Whitelisting
Prior to ISE version 2.1, it was common to see User-Agent values which were applied to an endpoint but served little or no value in classifying the endpoint. For example, the User-Agent may appear as Yahoo Voice,2.0, or Jabber/8.6.6 Sparkle/1.5, or even (null)/(null) ((null))! These are the user agents associated with web-enabled applications running on the endpoint. There may be cases where the info provides an indication of the applications or services running on the endpoint, but often are not significantly unique for device classification. Even worse is the possibility for profile flapping (frequent changes in endpoint profile due to continuous changes in the user agent). This can increase the load due to replication to synchronize these changes across the ISE nodes, but can also result in loss of access when Authorization Policy is based on the endpoint profile. To prevent benign user agents from impacting the deployment, ISE originally instituted a blacklist of User-Agent strings to ignore. However, with the countless and increasing number of possible values, a blacklist methodology is neither manageable nor effective.
ISE version 2.1 implemented a whitelist methodology to only save User-Agent strings which have a direct impact on the endpoint profile. Consequently, all User-Agent strings which do not match a condition used in a profile are ignored. To add User-Agent strings to the whitelist, an admin only needs to define a new IP:User-Agent condition based on that string and apply it to an Endpoint Profile Policy.
There may be cases where a previously unknown User-Agent string is relevant to profiling. To gain visibility into these strings, ISE Profiler added a new attribute labeled Ignored-User-Agent. This string captures the last captured User-Agent which was ignored by the PSN for the purposes of reprofiling. Figure 36 shows sample output for this attribute.
Figure 36: HTTP Whitelisting – Ignored User Agent Example
In the above example, only the HTTP probe was enabled. Consequently, the EndpointSource is HTTP Probe. The EndpointPolicy (its profile) matches Windows7-Workstation based solely on the User-Agent which includes the string “Windows NT 6.1”; this value is specific Windows 7 clients. Also notice the Ignored-User-Agent sent by Facebook, a social networking application. Although possible to create profiles based on this string, the value is likely to change frequently whereas the platform or operating system derived from popular web browsers should be fairly consistent.
Note two other fields which are populated by ISE Profiler—OperatingSystem and operating-system-result. The OperatingSystem attribute is actually populated by the ISE Client Provisioning or Web Authentication portal services where policy decisions and web page forms are based on the detected client operating system, or UADetector function. Although this specific attribute is not directly exposed to Profiler Conditions, it is factored into the operating-system-result attribute which is available for defining Profiler Conditions.
Cisco Best Practice: The operating-system-result attribute is derived from a number of potential sources for endpoint operating system (OS) including AD, Posture, MDM, and NMAP scan. Each source is ranked based on its fidelity. The OS value from the source with highest rank is assigned to operating-system-result. Therefore, it is recommended to leverage this critical attribute for profiles based on client OS.
Configuring the HTTP Probe
To collect user agent strings from redirected traffic, the access device must be capable of redirecting HTTP traffic to ISE either directly (for example, through Local WebAuth) or via a RADIUS authorization. For RADIUS-based redirection, ISE must be configured with an Authorization Policy rule to return the Cisco attribute value pair (AVP) for url-redirect as an authorization result.To use the HTTP probe with clients that connect directly to ISE web portals, the HTTP probe must be enabled and clients must simply connect to the ISE Sponsor or My Devices portal.
To use the HTTP probe with SPAN, the HTTP probe must be enabled and the network must send copies of the network traffic, preferably a filtered subset of traffic containing HTTP only, to the ISE PSN through a dedicated interface.
Procedure 26 Enable HTTP Probe in ISE
Step 1 Go to Work Centers > Profiler > Node Config > Deployment and select the Policy Service node to perform profiling from list of deployed nodes on the RHS pane.
Step 2 Select the Profiling Configuration tab. To add support for the HTTP probe, select the box labeled HTTP (Figure 37).
Step 3 Select the Interface or interfaces to be used for collecting HTTP traffic. If ISE has only one interface, the default interface (GigabitEthernet 0) will be sufficient. If more than one interface will process HTTP traffic for Profiling, then select All (Figure 38).
- For use with ISE web portals, the interface used should be the same interface or interfaces that host the web portal.
- For use with mirrored traffic (SPAN/RSPAN/taps), the selected interface should be dedicated to this function.
Step 4 Click Save to commit the changes.
Step 5 Repeat the steps in this procedure for all other Policy Service nodes configured with Profiling Services.
| ⓘ | Note: Due to the requirements for traffic mirroring, it may not be possible or feasible to configure multiple Policy Service nodes to receive SPAN traffic. Additionally, if mirroring the same traffic flows, it may not be desirable to forward the same information to multiple Policy Service nodes. Although adding redundancy, doing so can greatly increase the load on the ISE nodes and result in unnecessary duplication of profiling data which must be correlated and synchronized across other nodes. |
Procedure 27 Add the Network Device to ISE (Network Resources)
There are no specific steps required to complete this procedure. When URL redirection is the method used to capture User-Agent strings, the network access device must already be configured to support RADIUS-based authentication, so no additional steps are required to add or edit the network access device.
When SPAN is the method used to capture HTTP data, there is no specific requirement to add the access device to ISE if it is not performing RADIUS-based authentication.
Procedure 28 Configure ISE Policy Service Node Interface to Receive Redirected HTTP Traffic
There are no specific steps required to complete this procedure. When URL redirection is used to capture User-Agent strings, ISE Authorization Policy should be configured to redirect user traffic to the correct portal interface. When analyzing HTTP/S traffic sent directly to an ISE portal, then the appropriate portals should be already configured. No additional interface configuration is required.
Procedure 29 Configure ISE Policy Service Node Interface to Receive HTTP SPAN Traffic
When SPAN is used, the HTTP probe should be configured on a dedicated SPAN interface to receive HTTP traffic. To configure a dedicated SPAN interface on ISE, complete the following steps:
Step 1 Physically connect the desired interface to the appropriate SPAN destination port or network tap interface.
Step 2 Access the ISE PSN console (CLI). Enable the appropriate interface by simply entering no shutdown while in configuration mode for the desired interface.
Step 3 Save changes using the ISE CLI command copy running-config startup-config
| ⓘ |
Note: For Policy Service Nodes Running on a Virtual Appliance To use a dedicated interface for profiling, it is assumed that additional virtual interfaces are configured for the virtual appliance. If not completed at the time of install, it will be necessary to shut down the ISE node and update the hardware and networking configuration of the virtual appliance for the required interface(s) before continuing with the ISE configuration. Additionally, to accept SPAN/mirror traffic on the ISE HTTP SPAN interface, the VMware appliance requires promiscuous mode to be set on the virtual switch interface. To enable this mode in VMware, go to VMware Host > Configuration > Hardware > Networking > vSwitch > Security and set Promiscuous Mode: Accept (Default = Reject), as shown in the example diagram:
|
Procedure 30 Configure Wired Access Devices to Redirect HTTP Packets to the ISE PSN
Access device configuration to support URL redirection for specific services including CWA, Hotspot, Posture, or Supplicant Provisioning is beyond the scope of this guide. In summary, essential commands to support redirection based on RADIUS authorization using a Cisco Catalyst switch will be similar to the following:
Step 1 Under global configuration mode, enable HTTP and optionally HTTPS servers.
Step 2 Configure the redirect ACL that is referenced in the ISE RADIUS authorization to specify traffic eligible for redirection.
ip http server
ip http secure-server

ip access-list extended REDIRECT-ACL
 deny tcp any any <PSN_IP_address>
 permit tcp any any eq http
 permit tcp any any eq https
For traffic initiated by the client, Catalyst switches can support redirection of both HTTP and HTTPS traffic. The traffic redirected to ISE is always HTTPS.
Procedure 31 Configure Wireless Access Devices to Redirect HTTP Packets to the ISE PSN
Access device configuration to support URL redirection for specific services, including CWA, Hotspot, Posture, or Supplicant Provisioning is beyond the scope of this guide. In summary, essential steps to support redirection based on RADIUS authorization using a Wireless LAN Controller will be similar to the following example for CWA:
Step 1 Under Security > AAA > RADIUS > Authentication > (RADIUS Server) > Edit, verify that Support for RFC 3576 is set to Enabled (Figure 39).
Figure 39: CoA Configuration for Wireless Controller Example
Step 2 Under WLANs > Edit (WLAN) > Security > Layer 2, configure the WLAN for MAC Filtering. Layer 2 and Layer 3 Security should be set to None (Figure 40).
Figure 40: MAC Filtering Configuration for Wireless Controller Example
Step 3 Under the Advanced tab, select Allow AAA Override and set the NAC State to RADIUS NAC (Figure 41).
Figure 41: RADIUS Authorization Configuration for Wireless Controller Example
For traffic initiated by the client, Cisco Wireless LAN Controllers currently support redirection of HTTP traffic only. Redirection of HTTPS traffic is not supported. The traffic redirected to ISE is always HTTPS.
Procedure 32 Configure ISE to Perform URL Redirection as a RADIUS Authorization
ISE configuration to support URL redirection for specific services including CWA, Hotspot, Posture, MDM, as well as Client and Supplicant Provisioning is beyond the scope of this guide. In summary, all of these services can be used to capture the User-Agent for endpoints with supported operating systems and browsers. Figure 42 shows one example of a RADIUS Authorization Profile which provides URL Redirection for web-based services.
In the above example, the Common Task labeled Web Redirection is selected with the specific redirect selected as Client Provisioning (Posture). This will result in the endpoint being redirect to Client Provisioning and Posture services, or CPP. The redirect ACL is ACL-POSTURE-REDIRECT and must be preconfigured on the access device. The resulting RADIUS authorizations are highlighted in the grey box. The PSN that terminates the RADIUS session will also terminate the web-based service and correlate the client User-Agent string from HTTPS to the MAC address of the same session.
Procedure 33 Configure Network Devices to Send Copies of HTTP Traffic to the ISE PSN
There are multiple methods to mirror traffic to the ISE Policy Service node. This procedure shows one common way using VACL Capture on a Cisco Catalyst switch. This method has the added benefit of being able to forward only select traffic of interest to the ISE Policy Service node.
Cisco Best Practice: When available, utilize intelligent tap systems that support scalable traffic mirroring with filters to only send the required traffic to the ISE probe. This includes DHCP SPAN and HTTP probes that rely on SPAN methods to acquire profiling data. More advanced tap systems will support high availability for mirrored traffic.
Alternatively, when supported by the infrastructure, take advantage of intelligent SPAN techniques such as VACL Capture on the local switch, or VACL Capture/Redirect in conjunction with RSPAN, to allow selective capture of network traffic.
Step 1 Determine the interface(s) or VLAN(s) that will be the source of HTTP traffic. Certain chokepoints such as the egress interface of a WLC, outbound links to the Internet or the organization’s internal web servers can make ideal places to capture all client HTTP packets.
In the following example, VLANs 40-44 are trunked to a Cisco Wireless LAN Controller. Interface GigabitEthernet 2/37 is a switchport connection to a Cisco UCS® server running VMware ESXi. The ESXi server hosts an ISE virtual appliance configured as a Policy Service node with profiling enabled. Interface GigabitEthernet 2/37 is link to an ESXi virtual interface linked to the ISE PSN on Gigabit Ethernet 3.
interface GigabitEthernet1/1
 description Cisco WLC ETH0 (Port 1)
 switchport
 switchport trunk encapsulation dot1q
 switchport trunk allowed vlan 40-44
 switchport mode trunk

interface GigabitEthernet2/37
 description UCS1 SPAN (port 3 of 6)
 switchport
Step 2 Configure VACL Capture to match all HTTP traffic on VLANs 40-44 and forward to the ISE PSN connection.
a.Configure an ACL to match only HTTP traffic and another to match all IP traffic, as follows:
cat6500(config)# ip access-list extended HTTP_TRAFFIC
cat6500(config-ext-nacl)# permit tcp any any eq www
cat6500(config)# ip access-list extended ALL_TRAFFIC
cat6500(config-ext-nacl)# permit ip any any
b.Configure a VLAN access map with a sequence that sets the capture bit on traffic that matches the HTTP_TRAFFIC ACL. Configure another sequence in the same VLAN access map that forward all other traffic (matches the ALL_TRAFFIC ACL).
cat6500(config)# vlan access-map HTTP_MAP 10
cat6500(config-access-map)# match ip address HTTP_TRAFFIC
cat6500(config-access-map)# action forward capture

cat6500(config)# vlan access-map HTTP_MAP 20
cat6500(config-access-map)# match ip address ALL_TRAFFIC
cat6500(config-access-map)# action forward
c.Configure a VLAN filter that applies the VLAN access map to VLANs 40, 41, 42, and 43, as follows:
cat6500(config)# vlan filter HTTP_MAP vlan-list 40-43
d.Configure the capture port (Gi2/37) to include all matching traffic on VLANs 40, 41, 42, and 43, including traffic routed to upstream VLAN 100, as follows:
cat6500(config)# int Gi2/37
cat6500(config-if)# switchport capture allowed vlan 40–43,100
cat6500(config-if)# switchport capture
Procedure 34 Verify HTTP User-Agent Data Using URL Redirection
(CWA Example)
Step 1 Go to the ISE Policy Administration node and navigate to Work Centers > Profiler > Endpoint Classification.
Step 2 Note the MAC address of target endpoint for testing and delete the endpoint.
Step 3 Disconnect and then reconnect the endpoint from the access device configured to support HTTP/S redirection to the ISE PSN. Be sure to complete the guest flow. It is not sufficient to simply be redirected to a portal. The PSN must process the web transaction to capture the User-Agent string.
Step 4 Under Work Centers > Profiler > Endpoint Classification, find and select the MAC address of the newly connected endpoint and then select the Attributes sub-menu to display the attributes captured by URL Redirection.
Figure 43 provides sample output of profiling based on URL redirection. Note that the endpoint matched an Authorization Policy for CWA redirection. The client browser sent a User-Agent string which indicates it is an iPad and the OUI (not shown) is “Apple, Inc.”. This is sufficient to profile the endpoint as Apple-iPad. Also note that the EndPointSource is GUEST Portal and not HTTP Probe.
(The dashed line indicates a section where the output has been truncated for display purposes.)
Procedure 35 Verify HTTP User-Agent Data Using URL Redirection (Client Provisioning Example)
Step 1 Go to the ISE Policy Administration node and navigate to Work Centers > Profiler > Endpoint Classification.
Step 2 Note the MAC address of target endpoint for testing and delete the endpoint.
Step 3 Disconnect and then reconnect the endpoint from the access device configured to support HTTP/HTTPS redirection to the ISE PSN. Be sure to complete the client provisioning flow. It is not sufficient to simply be redirected to a portal. The PSN must process the web transaction to capture the User-Agent string.
Step 4 Under Work Centers > Profiler > Endpoint Classification, find and select the MAC address of the newly connected endpoint and then select the Attributes sub-menu to display the attributes captured by URL Redirection.
Figure 44 shows an example without any probes enabled to highlight the attributes collected using URL redirection with Client Provisioning.
The key attributes highlighted are similar to those in previous example with the exception of the EndPointSource, which is set to CP (Client Provisioning). This example highlights the ability to capture the HTTP user agent string and profile the endpoint in the absence of an IP-to-MAC address binding.
Procedure 36 Verify HTTP Probe Data using SPAN
Step 1 Go to the ISE Policy Administration node and navigate to Work Centers > Profiler > Endpoint Classification.
Step 2 Note the MAC address of target endpoint for testing and delete the endpoint.
Step 3 Disconnect and then reconnect the endpoint to the network.
Step 4 Open the web browser on the endpoint and attempt HTTP access to any website. Remember, HTTPS traffic cannot be inspected using SPAN.
Step 5 Under Work Centers > Profiler > Endpoint Classification, find and select the MAC address of the newly connected endpoint and then select the Attributes sub-menu to display the attributes captured by the HTTP probe.
Figure 45 shows only the HTTP probe enabled to highlight the attributes collected using SPAN.
The key attributes include the same in previous examples as well as some new attributes:
- Cookie (truncated for display)
- Host
In summary, endpoints can be classified based on their operating system as determined by the User-Agent attribute. Three general methods to collect HTTP User-Agent strings include Device Sensor, ISE web services based on URL redirection, and SPAN techniques. In general, URL redirection is much more efficient than SPAN, but traffic mirroring may be the only option if profiling is required in an environment without RADIUS services enabled. Device Sensor (discussed later in this guide) is the most efficient and can cover endpoints that may not be subject to URL Redirection.
Profiling Using the DNS Probe
The DNS probe is used to acquire the DNS Fully Qualified Domain Name (FQDN) based on a reverse DNS lookup from the ISE Policy Service node once the IP address for an existing endpoint is learned. Therefore, the DNS probe cannot function unless the IP address is known and associated with an endpoint MAC address.
The following are common probes used to determine the IP-to-MAC address binding of an endpoint:
- RADIUS Probe via Framed-IP-Address
- SNMP Probe via IP-MIB or cdpCacheAddress
- DHCP Probes via dhcp-requested-address
- pxGrid Probe via AssetIpAddress
In addition to having a known IP address, the use of reverse DNS lookups has a number of other requirements to function:
- In DNS, each endpoint requires an Address or A record (hostname) and a pointer or PTR record (IP address).
- If endpoints use DHCP to obtain addresses:
- Dynamic DNS (DDNS) must be configured on the DHCP servers if not using DHCP Reservations.
- Depending on the DHCP server configuration, endpoints may require configuration to request dynamic updates.
- ISE Policy Service nodes must be configured to resolve addresses from DNS servers that are dynamically updated.
Assuming DDNS is configured and working properly, the DNS probe can retrieve the FQDN. Otherwise, there will be no attribute added if the reverse lookup fails.
Cisco Best Practice: To support persistent IP address assignments for select hosts while still gaining the benefits of central IP address management and DHCP fingerprinting, it is recommended to utilize DHCP Reservations. DHCP Reservations allow the administrator to centrally administer specific addresses to a host depending on its MAC address and other attributes such as its VLAN/subnet or scope.
If a standard hostname, domain name, or FQDN naming convention is deployed to specific endpoints, these attributes can be used to classify them. For example, if all Windows 10 clients are assigned a name such as jsmith-win10, the host-name attribute or client-fqdn attribute can be used in a condition to classify Windows 10 endpoints. Furthermore, if the organization’s naming convention is to populate hostname for its endpoints to something like jsmith-corp-sales, that can be used to validate a managed asset.
Caution must be taken to not confuse profile attributes as identity, but attributes can add a certain level of credence that the endpoint is a certain type. For example, the Authorization Policy can be used with profiling to deny full access privileges to employees where the host-name attribute of their PC (as indicated by matching Endpoint Profile) does not include expected values.
As this discussion suggests, it may be possible to collect the FQDN or its components using other probes. Therefore, the use of the DNS probe may not be necessary if the same information, or portions of the FQDN, is already available by other means. However, DDNS can be configured to be more secure, thus making the information retrieved via DHCP alone less reliable than a reverse lookup to a trusted DNS server.
While DHCP is beneficial for dynamically-addressed endpoints, it is common for organizations to have a significant population of statically-addressed endpoints. These static IP endpoints often serve a specific function and as such, will commonly have a static DNS entry hat follows a naming convention to simplify management and user access. The naming conventions often infers the device type, department, and/or function. Consequently, the DNS probe can be an invaluable source of classification for devices with static addressing.
| ⓘ | Note: After an initial interface DNS probe lookup, the Policy Service node will not attempt another DNS lookup for the same endpoint within the same 1-hour period. This is to limit the load on the DNS server. The DNS probe lookup interval is not configurable. |
Figure 46 depicts a sample topology using the DNS probe. As the figure shows, the ISE Policy Service node learns the IP address for an endpoint using one of multiple methods. The PSN then initiates a reverse lookup for the IP address. If response received, ISE Profiling services update the endpoint record with the FQDN attribute.
Configuring the DNS Probe
To use the DNS probe and acquire an endpoint’s FQDN, the name server(s) referenced in the ISE Policy Service node must be populated—either manually or dynamically using DDNS—to include host and reverse pointer records for that endpoint.
Procedure 37 Enable DNS Probe in ISE
Step 1 Go to Work Centers > Profiler > Node Config > Deployment and select the Policy Service node to perform profiling from list of deployed nodes on the RHS pane.
Step 2 Select the Profiling Configuration tab. To add support for the DNS probe, select the box labeled DNS (Figure 47).
There is no interface selection with the DNS probe as all probe queries are initiated by the ISE Policy Service node using the global routing table for reverse lookups to the locally configured DNS server(s).
Step 3 Leave the default value for Timeout. This value specifies the number of seconds the PSN waits for a reverse lookup response.
Step 4 Click Save to commit the changes.
Step 5 Repeat the steps in this procedure for all other Policy Service nodes configured with Profiling Services.
Procedure 38 Configure Probes to Obtain the Endpoint IP Address
| ⓘ | Note: In order for the DNS probe to perform a reverse DNS lookup for the FQDN, it must first learn the IP address of the endpoint from the RADIUS, SNMP Query, DHCP, DHCP SPAN, or pxGrid probe. Refer to the appropriate section in this guide for details on the configuration of these probes. |
Procedure 39 Configure ISE with DNS Servers for Reverse Address Lookups
When the ISE appliance is initially installed, a required configuration step is to configure one or more domain name servers.
Step 1 If required, update the list of DNS servers used by the ISE Policy Service nodes running Profiling Services using the ISE CLI command ip name-server in global configuration mode, as shown below.
ise-psn-1/admin# configure terminal
Enter configuration commands, one per line. End with CNTL/Z.
ise-psn-1/admin(config)# ip name-server ?
<A.B.C.D> Primary DNS server IPv4 address
<A.B.C.D> DNS server 2 IP address
<A.B.C.D> DNS server 3 IP address
Step 2 To remove an entry, us the no name-server command.
Step 3 To save changes, exit global configuration mode and enter the command copy running-config startup-config.
Step 4 Repeat steps as required on remaining Policy Service nodes running Profiling Services.
Procedure 40 Verify DNS Probe Data
Step 1 Go to the ISE Policy Administration node and navigate to Work Centers > Profiler > Endpoint Classification.
Step 2 Note the MAC address of target endpoint for testing and delete the endpoint.
Step 3 Disconnect and then reconnect the endpoint to the network.
Step 4 Under Work Centers > Profiler > Endpoint Classification, find and select the MAC address of the newly connected endpoint and then select the Attributes sub-menu to display the attributes captured by the DNS probe (Figure 48).
The example in Figure 48 shows only the RADIUS, DHCP (IP Helper), and DNS probe enabled. RADIUS and DHCP are enabled as methods to acquire both the MAC address and IP address of the endpoint. These probes are also selected to compare similar data that can be collected using various probes. The dashed lines indicate sections where the output has been truncated for display purposes.
The key attributes highlighted in red include:
- EndPointSource = DNS Probe
- FQDN = win7-pc.cts.local
- ip = 10.1.10.100
EndPointSource reflects the last source of endpoint attributes.
The FQDN value is the result of a successful reverse lookup to the DNS server using the DNS probe.
The ip attribute is important to emphasize the requirement of obtaining this attribute in order for the DNS probe to function. In this example, either the RADIUS or DHCP probe could have updated this value.
Secondary attributes highlighted in orange include:
- ADDomain = cts.local
- client-fqdn = 00:00:00:77:69:6e:37:2d:70:63:2e:63:74:73:2e:6c:6f:63:61:6c
- host-name = win7-pc
ADDomain value is the domain name learned from RADIUS attributes using the RADIUS probe.
The client-fqdn attribute is the fully qualified domain name of the endpoint learned from the DHCP probe and is expressed in HEX format (Figure 49).
The host-name attribute is the simple hostname of the endpoint learned from the DHCP probe.
This example illustrates that different probe attributes may supply similar information. Ultimately, the policy administrator must choose which attributes are the most useful to profiling endpoints and which probes are can best acquire this information. A comparison of probe and profiling methods will be discussed later in this guide.
Profiling Using the NetFlow Probe
Cisco NetFlow is a form of telemetry exported from Cisco IOS Software-based routers and Layer 3 switches. NetFlow provides information about traffic passing through or directly to each NetFlow-enabled router or switch. NetFlow-enabled devices collect and export network flow data to collectors on a specified UDP port (default UDP/9996). A flow is a unidirectional stream of packets between a given source and destination and is uniquely identified by a combination of the following key fields:
- Source IP address
- Destination IP address
- Source port number
- Destination port number
- Layer 3 protocol type
- ToS byte
- Input logical interface (ifIndex)
The ISE NetFlow probe is cable of receiving flow records from NetFlow Version 5 and Version 9-enabled devices to allow parsing of critical information for profiling purposes.
The sample topology in Figure 50 shows two different endpoints that have established traffic flows through a NetFlow-capable switch. The switch is configured to export the flows to the ISE Policy Service node on a dedicated interface with IP address 10.1.200.6 on UDP/9996. This interface is separate from the one that terminates user session services like RADIUS and Web Authentication.
As you can see from the topology, NetFlow must be enabled on routers or switches that are in the path of interesting traffic. For example, if traffic flows between segments within a remote branch must be collected, NetFlow deployed at a hub or central location will not offer the required visibility. Additionally, in order to collect specific traffic flows, that traffic must first be allowed on the network. Therefore, if network access is dependent on a profile that relies on NetFlow data, you need to determine how to best limit access while still allowing traffic required to complete profiling.
NetFlow Attributes
Table 4 shows some of the attributes collected by the NetFlow Probe Attributes:
| IN_BYTES | IN_PKTS | FLOWS |
| PROTOCOL | SRC_TOS | TCP_FLAGS |
| L4_SRC_PORT | IPV4_SRC_ADDR | SRC_MASK |
| L4_DST_PORT | IPV4_DST_ADDR | DST_MASK |
| IPV4_NEXT_HOP | LAST_SWITCHED | FIRST_SWITCHED |
| OUT_BYTES | OUT_PKTS | IPV6_SRC_ADDR |
| IPV6_DST_ADDR | IPV6_SRC_MASK | IPV6_DST_MASK |
| IPV6_FLOW_LABEL | ICMP_TYPE | DST_TOS |
| IN_SRC_MAC | OUT_DST_MAC | SRC_VLAN |
| DST_VLAN | IP_PROTOCOL_VERSION | DIRECTION |
In ISE Profiling Services, NetFlow is typically used to identify endpoints based on the traffic they generate. Conversely, it can provide an indicator of anomalous behavior when specific endpoints appear to generate traffic that is not characteristic of that endpoint. For example, if an endpoint initially profiled as an IP phone began to suddenly start communicating to remote destinations on port 443 as reflected by NetFlow attributes, this would represent an anomalous condition and potential spoofing exploit. However, please note that the use of NetFlow with ISE Profiling Services is currently not positioned as an anti-spoofing solution.
Focusing on the positive classification of endpoints, NetFlow is most useful in scenarios where Internet of Things (IoT) devices are used for mission-specific functions whereby the only information that uniquely classifies them is traffic-related. Examples of these types of devices include those used in manufacturing or healthcare industries. For example, a patient monitor in a hospital may use an embedded Windows OS or hardened Linux kernel using standard hardware technology, but can run applications that communicate on very specific protocols, ports, and destinations. For these types of endpoints, NetFlow may be a feasible option.
In general, it is not recommended to randomly enable NetFlow and/or use the NetFlow probe as an all-purpose profiling method. If not deployed with caution, NetFlow can have a negative impact on device resources depending on the platforms used, as well as on the NetFlow configuration and traffic volumes. NetFlow can also generate a high load on the ISE Policy Service nodes if large volumes of traffic are continuously sent from one or more sources. Unlike other ISE probes, the NetFlow probe does not support attribute filters to optimize data collection and database efficiency.
Where available on network devices, NetFlow Version 9 is recommended over Version 5 for NetFlow export to the ISE Policy Service node. Version 9 supports Flexible NetFlow and numerous enhancements for filtering flow data collected and exported to the NetFlow probe. Although sampled NetFlow can reduce overall traffic volume, sampling may not satisfy all profiling requirements because some scenarios may require that all flows be seen by the NetFlow probe.
Cisco Best Practice: Use of NetFlow for profiling can result in a potentially high volume of data being sent to ISE for parsing. Restrict the use of NetFlow to scenarios where other probes are insufficient. If required, NetFlow Version 9 is advocated to take advantage of filtering enhancements as found in Flexible NetFlow. Although ISE will not prevent the use of the default interface, it is highly recommended that NetFlow be exported to an ISE PSN interface dedicated to the NetFlow probe.
The less granular the flow capture, the smaller the volume of flow data sent to ISE. Only export the level of detail needed to capture the key attributes used in the profiling conditions such as the protocol, source/destination ports, and destination IP address. This core set of network data is also known as the “5-Tuple”.
NetFlow Probe and IP-to-MAC Address Binding Requirement
NetFlow records are based on communications between source and destination IP addresses. Since NetFlow traffic does not include the MAC address of the source or destination endpoint, it is critical that the ISE Policy Service node already have an IP-to-MAC address binding in its ARP cache table in order to properly correlate data sent to the NetFlow probe. In other words, if the endpoint is not already known to ISE by its MAC address or if there is not an associated IP address, profiling data learned by the NetFlow probe will be discarded since there is no endpoint to which it can apply the learned flow attributes. Consequently, you have to learn the IP-to-MAC address binding via another probe prior to collecting NetFlow data. Probes that can be used to provide this information include the following:
- RADIUS (via Framed-IP-Address)
- DHCP (via dhcp-requested-address)
- SNMP Query (via SNMP polling)
It should be noted that NetFlow Version 9 does support the option to include source and destination MAC addresses within the flow record, whereas version 5 does not. However, these reported MAC addresses are that of the adjacent nodes in the path, typically Layer 3 routers and switches, not the MAC address of endpoints more than one hop away. Unless the end systems are directly connected to the NetFlow device, this functionality offers little value.
Configuring the NetFlow Probe
To use the NetFlow probe, network devices that are inline with traffic flows of interest must be NetFlow-capable and support NetFlow Version 5 or Version 9. A dedicated interface should be used on each ISE PSN that will be the target of NetFlow data.
Procedure 41 Enable NetFlow Probe in ISE
Step 1 Go to Administration > System > Deployment and select the Policy Service node to perform profiling from list of deployed nodes on the RHS pane.
Step 2 Select the Profiling Configuration tab and select the box to enable the NetFlow probe (Figure 51).
Step 3 Select the Interface to be used for collecting NetFlow traffic. This should be a dedicated interface (individual or bonded) with a routable IP address (Figure 52)
Step 4 Select the UDP Port to listen for exported NetFlow. This value should be the same as that configured on the NetFlow export device. The default port is UDP/9996.
Step 5 Click Save to commit the changes.
Step 6 Repeat the steps in this procedure for all other Policy Service nodes configured with Profiling Services.
| ⓘ | Note: Many NetFlow-capable routers and switches support only a single target for NetFlow export. Therefore, consideration must be given to high availability. It is also recommended that all profile data for a given endpoint be received by the same Policy Service node. This may not always be possible due to network configuration and other limitations. |
Procedure 42 Add the Network Device to ISE (Network Resources)
Access devices may also be capable of NetFlow but there is no specific requirement that other network devices capable of sending NetFlow to the NetFlow probe be configured as a network device in ISE.
Procedure 43 Configure ISE Policy Service Node Interface to Receive NetFlow Traffic
The NetFlow probe should be configured on a dedicated interface to receive NetFlow traffic. To configure a dedicated NetFlow interface on ISE, complete the following steps:
Step 1 Physically connect the desired interface to a network switchport.
Step 2 Access the ISE PSN console (CLI). Enable the appropriate interface and assign a valid IP address as shown in Figure 53.
Step 3 Verify all processes are in a running state as instructed.
Step 4 Verify the configuration of the newly configured interface and that it is enabled (NOT in shutdown) by using the show running-config command (Figure 54).
Step 5 Verify connectivity to the new probe interface by sending an ICMP ping from a network device that needs to export NetFlow data.
Step 6 Save changes using the CLI command copy running-config startup-config.
Step 7 Physically connect the desired interface to the appropriate SPAN destination port or network tap interface.
| ⓘ | Note: For Policy Service Nodes Running on a Virtual Appliance To use a dedicated interface for profiling, it is assumed that additional virtual interfaces were configured for the virtual appliance. If not completed at the time of install, it will be necessary to shut down the ISE node and update the hardware and networking configuration of the virtual appliance for the required interface(s) before continuing with the ISE configuration. |
Procedure 44 Configure NetFlow-Capable Switch/Router to Export NetFlow to the ISE PSN
NetFlow configuration is specific to the NetFlow-capable device. This procedure includes an example configuration for a Catalyst 6500 Series switch.
Under global configuration mode, enable NetFlow, configure NetFlow Version 9 support, the interface IP address from which to source NetFlow data, and the Policy Service node to export data. Note the specification of the ISE default port of UDP 9996.
mls netflow interface
mls flow ip interface-full
mls nde sender
mls nde interface
ip flow-cache timeout active 1
ip flow-export source Vlan100
ip flow-export version 9
ip flow-export destination 10.1.200.6 9996
| ⓘ | Note: In the preceding example, the Catalyst 6500 Series Switch has a Supervisor 720 where the Policy Feature Card (PFC) performs hardware-based NetFlow and flows punted to Multilayer Switch Feature Card (MSFC) are performed in software. The PFC must be configured to perform NetFlow Data Export (NDE) using the mls nde sender command. |
Step 1 Optionally configure capture filters, as follows:
ip flow-capture ttl
ip flow-capture vlan-id
ip flow-capture ip-id
ip flow-capture mac-addresses
Step 2 Enable NetFlow on the ingress interfaces (endpoint-facing interfaces), as follows:
interface GigabitEthernet 2/47
 description To cat3750x
 ip address 10.1.50.1 255.255.255.0
 ip flow ingress
!
interface Vlan40
 description EMPLOYEE
 ip address 10.1.40.1 255.255.255.0
 ip helper-address 10.1.100.100
 ip helper-address 10.1.200.6
 ip flow ingress
!
interface Vlan41
 description GUEST
 ip address 10.1.41.1 255.255.255.0
 ip helper-address 10.1.100.100
 ip helper-address 10.1.200.6
 ip flow ingress
IP Helper commands are also shown to highlight the configuration to support the DHCP probe, which is used to obtain IP-to-MAC address binding information. This allows the NetFlow probe to apply attributes based on the matching IP attribute.
Figure 55 illustrates the interfaces where NetFlow is applied as well as the destination for NetFlow Data Export (NDE). The goal is to capture traffic from wired endpoints connecting through the Core Switch as well wireless endpoints connecting through the Wireless LAN Controller.
Procedure 45 Verify NetFlow Probe Data
Step 1 Go to the ISE Policy Administration node and navigate to Work Centers > Profiler > Endpoint Classification.
Step 2 Note the MAC address of target endpoint for testing and delete the endpoint.
Step 3 Disconnect and then reconnect the endpoint from the access device.
Step 4 Login from the endpoint and attempt generate sample traffic such as attempting web access using a browser.
Step 5 Under Work Centers > Profiler > Endpoint Classification, find and select the MAC address of the newly connected endpoint and then select the Attributes sub-menu to display the attributes captured by the NetFlow probe (Figure 56).
The example in Figure 56 highlights the attributes collected using NetFlow export. Additionally, the RADIUS and DHCP probes were enabled to ensure that IP-to-MAC bindings were acquired to support the NetFlow probe.
The key attributes highlighted in red include:
- EndPointSource = NetFlow Probe
- IPV4_DST_ADDR = 173.37.144.208 (cisco.com)
- IPV4_SRC_ADDR = 10.1.10.100 (win7-pc)
- L4_DST_PORT = 80 (HTTP)
- L4_SRC_PORT = 53149
- PROTOCOL = 6 (TCP)
If flow capture statements are used, you may see the following additional attributes:
- DST_VLAN/SRC_VLAN
- IN_SRC_MAC/OUT_DST_MAC
- MAX_TTL/MIN_TTL
Cisco Best Practice: The attributes learned from the NetFlow probe are single valued and update the endpoint record with only the last values reported. Therefore, it is not currently possible to create a condition based on the detection of multiple values. For example, a Profiler Condition may be based on a specific TCP destination port or inclusion in a range of TCP ports, and it is possible to have a Profiling Policy based on a logical OR of such conditions, but it is not possible to have a Profiling Policy that matches multiple ports at the same time (a logical AND of protocols and ports). Furthermore, if the endpoint is profiled based on a matching protocol and port, and then different values are learned for the same endpoint, it is possible that the endpoint profile will continuously flap based on the last reported NetFlow export. This will result in potentially a huge volume of replication traffic to synchronize the latest profile and likely result in a repeated disruption in service for the endpoint.
To leverage the learned traffic behavior while avoiding potential profile flaps (excessive replication and service disruptions), it is recommended that profiles based on NetFlow have an Exception Action defined. Profiler Exception Actions allow an endpoint to be statically assigned to a profile with optional CoA issued upon matching a profile and key condition, such as communication on a unique UDP or TCP port. Once statically assigned, the profile will not change, even if different flow records are received for the endpoint. Similarly, a NetFlow condition with matching Exception Action could check for the presence of anomalous traffic behavior (for example, a building automation device which unexpectedly communicates on a foreign port or to a foreign destination). In this scenario, the exception could be to statically assign the endpoint to a quarantine policy. Exception Actions are discussed in greater detail later in this guide.
Step 6 To verify that NetFlow data is being collected, you can use the show ip cache flow and the show mls netflow ip commands. The following example uses the show ip cache flow command:
cat6503#show ip cache flow
-------------------------------------------------------------------------------
Displaying software-switched flow entries on the MSFC in Module 1:
IP packet size distribution (348128 total packets):
1-32 64 96 128 160 192 224 256 288 320 352 384 416 448 480
.548 .342 .077 .005 .000 .000 .000 .000 .000 .000 .015 .000 .000 .000 .000
512 544 576 1024 1536 2048 2560 3072 3584 4096 4608
.000 .000 .007 .000 .000 .000 .000 .000 .000 .000 .000
IP Flow Switching Cache, 278544 bytes
2 active, 4094 inactive, 15760 added
251284 ager polls, 0 flow alloc failures
Active flows timeout in 1 minutes
Inactive flows timeout in 15 seconds
IP Sub Flow Cache, 33992 bytes
6 active, 1018 inactive, 47280 added, 15760 added to flow
0 alloc failures, 2775 force free
1 chunk, 24 chunks added
last clearing of statistics never
Protocol Total Flows Packets Bytes Packets Active(Sec) Idle(Sec)
-------- Flows /Sec /Flow /Pkt /Sec /Flow /Flow
TCP-Telnet 44 0.0 91 42 0.0 14.4 7.8
TCP-WWW 1361 0.0 22 45 0.0 0.0 14.2
TCP-other 1602 0.0 25 51 0.0 0.1 13.6
UDP-DNS 128 0.0 1 70 0.0 0.0 15.4
UDP-NTP 1375 0.0 1 76 0.0 0.0 15.5
UDP-other 2880 0.0 3 338 0.0 3.8 15.4
ICMP 6985 0.0 34 30 0.0 0.4 13.4
IP-other 1383 0.0 13 65 0.0 58.3 2.0
Total: 15758 0.0 22 46 0.0 6.0 13.0
SrcIf SrcIPaddress DstIf DstIPaddress Pr SrcP DstP Pkts
Gi2/47 10.1.50.2 Null 224.0.0.10 58 0000 0000 4
Gi2/47 10.1.13.1 Null 10.1.100.7 11 0043 0043 3
-------------------------------------------------------------------------------
Displaying hardware-switched flow entries in the PFC (Active) Module 1:
SrcIf SrcIPaddress DstIf DstIPaddress Pr SrcP DstP Pkts
Gi2/47 10.1.50.1 Gi2/47 10.1.50.2 58 0000 0000 0
Gi2/47 10.1.50.2 --- 10.1.100.1 11 007B 007B 0
Gi2/47 10.1.50.2 --- 10.1.50.1 58 0000 0000 0
Gi2/47 10.1.100.1 Gi2/47 10.1.50.2 11 007B 007B 0
Gi2/47 10.1.50.2 Vl100 10.1.200.6 11 CC9B 00A2 15
Gi2/47 10.1.13.1 Vl100 10.1.100.100 11 0043 0043 124
Gi2/47 10.1.13.1 Vl100 10.1.200.6 11 0043 0043 124
Gi2/47 10.1.13.1 Vl100 10.1.100.6 11 0043 0043 124
Gi2/47 10.1.50.2 --- 224.0.0.10 58 0000 0000 84
Vl40 10.1.40.1 --- 224.0.0.10 58 0000 0000 0
Gi2/47 10.1.50.2 Vl100 10.1.100.4 11 C8D5 5022 30
Gi2/47 10.1.13.1 --- 10.1.100.7 11 0043 0043 0
Gi2/47 10.1.10.100 Vl100 10.1.100.100 11 CA72 0035 1
Gi2/47 10.1.50.2 Vl100 10.1.200.6 11 066E 0715 128
Vl41 10.1.41.1 --- 224.0.0.10 58 0000 0000 0
Gi2/47 10.1.50.2 Vl100 10.1.200.6 11 06A4 7195 2
Gi2/47 10.1.50.2 Vl100 10.1.100.6 11 E6D7 00A2 15
Gi2/47 10.1.50.2 --- 10.1.100.7 11 C748 00A2 0
Gi2/47 10.1.50.2 Vl100 10.1.200.6 11 066D 0714 6
Gi2/47 10.1.10.100 Vl100 10.1.100.100 11 E5CC 0035 1
Gi2/47 10.1.10.100 Vl100 10.1.100.100 11 DA8B 0035 1
Gi2/47 10.1.10.100 Vl100 10.1.100.100 11 C114 0035 1
Gi2/47 10.1.10.100 Vl100 10.1.100.100 11 FC03 0035 1
Gi2/47 10.1.10.100 Vl100 10.1.100.100 11 D295 0035 1
Gi2/47 10.1.10.100 Vl100 10.1.100.100 11 ED48 0035 1
Gi2/47 10.1.10.100 Vl100 10.1.100.100 11 E7E8 0035 1
Gi2/47 10.1.10.100 Vl100 10.1.100.100 11 D770 0035 1
Gi2/47 10.1.10.100 Vl100 10.1.100.100 11 D5AB 0035 1
-- 0.0.0.0 --- 0.0.0.0 00 0000 0000 31K
The following example uses show mls neflow ip:
cat6503#show mls netflow ip

Displaying Netflow entries in Active Supervisor EARL in module 1
DstIP SrcIP Prot:SrcPort:DstPort Src i/f :AdjPtrPkts Bytes Age LastSeen Attributes
--------------------------------------------------------------------------------------------------------------------------------
10.1.50.2 10.1.100.1 udp :ntp :ntp Gi2/47 :0x00 0 43 20:26:48 L2 - Dynamic
10.1.44.90 10.1.14.100 udp :16792 :5246 Gi2/47 :0x03 359 35 20:27:26 L3 - Dynamic
10.1.100.100 10.1.13.1 udp :67 :67 Gi2/47 :0x04 1846 32 20:27:30 L3 - Dynamic
10.1.200.6 10.1.50.2 udp :52379 :162 Gi2/47 :0x015 2734 335 20:23:02 L3 - Dynamic
10.1.100.4 10.1.50.2 udp :51413 :20514 Gi2/47 :0x030 5286 334 20:23:58 L3 - Dynamic
10.1.200.6 10.1.50.2 udp :1646 :1813 Gi2/47 :0x04 2680 32 20:27:30 L3 - Dynamic
10.1.100.100 10.1.10.100 udp :51826 :dns Gi2/47 :0x01 61 211 20:24:00 L3 - Dynamic
10.1.44.90 10.1.14.100 udp :16792 :5247 Gi2/47 :0x06 901 30 20:27:30 L3 - Dynamic
224.0.0.10 10.1.41.1 88 :0 :0 Vl41 :0x00 0 426 20:27:27 Multicast
10.1.200.6 10.1.50.2 udp :1700 :29077 Gi2/47 :0x02 132 335 20:23:56 L3 - Dynamic
10.1.100.6 10.1.50.2 udp :59095 :162 Gi2/47 :0x015 2734 335 20:23:02 L3 - Dynamic
10.1.100.7 10.1.50.2 udp :51016 :162 Gi2/47 :0x00 0 335 20:23:02 L3 - Dynamic
10.1.200.6 10.1.50.2 udp :1645 :1812 Gi2/47 :0x06 1365 270 20:23:56 L3 - Dynamic
10.1.100.100 10.1.10.100 udp :54699 :dns Gi2/47 :0x01 64 211 20:24:00 L3 - Dynamic
10.1.100.1 10.1.50.2 udp :ntp :ntp Gi2/47 :0x00 0 43 20:26:48 L3 - Dynamic
17.172.232.209 10.1.40.101 tcp :61858 :443 Vl40 :0x02 173 17 20:27:14 L3 - Dynamic
17.172.232.209 10.1.40.101 tcp :61858 :443 Vl40 :0x00 0 17 20:27:14 L2 - Dynamic
10.1.40.101 17.172.232.209 tcp :443 :61858 Vl40 :0x00 0 17 20:27:14 L2 - Dynamic
0.0.0.0 0.0.0.0 0 :0 :0 -- :0x032283 20941051 1573 20:27:31 L3 - Dynamic
Step 7 To verify the NetFlow export configuration and that flows are being sent to the ISE Policy Service node, use the show ip flow export command, as follows:
cat6503# sh ip flow export
Flow export v9 is enabled for main cache
Export source and destination details :
VRF ID : Default
Source(1) 10.1.100.1 (Vlan100)
Destination(1) 10.1.200.6 (9996)
Version 9 flow records
20408 flows exported in 7635 udp datagrams
0 flows failed due to lack of export packet
0 export packets were sent up to process level
0 export packets were dropped due to no fib
0 export packets were dropped due to adjacency issues
0 export packets were dropped due to fragmentation failures
0 export packets were dropped due to encapsulation fixup failures
0 export packets were dropped enqueuing for the RP
0 export packets were dropped due to IPC rate limiting
0 export packets were dropped due to Card not being able to export
Profiling Using the Network Scan (NMAP) Probe
The Network Scan probe is based on an embedded version of the open-source Network Mapper utility. Network Mapper (NMAP) is designed to scan large networks for connected endpoints, and then perform scans on individual hosts to detect their operating system (OS), OS version, and services (application names and versions).
Other ISE probes are considered “passive” in the sense that they do not directly interrogate the endpoint itself but rather rely on indirect methods of data collection such as parsing data generated by the device or from other network devices. The Network Scan probe is considered an “active” assessment mechanism since it communicates directly with the endpoint to obtain information from the source.
NMAP Probe Scan Operations
The NMAP probe can perform one or more of the following scan operations:
- Operating System Scan
- SNMP Port Scan
- Common Ports Scan
- Custom Ports Scan
- SMB Discovery
The Operating System (OS) Scan performs an “nmap -O” (OS detection) operation to determine an endpoint’s OS and version. This is an intensive operation. Over 2,500 TCP ports are used in OS detection scanning as well as ICMP and UDP port 51824. For a complete list, refer to the ISE Administrator Guide on Cisco.com.
The SNMP Port Scan tries to detect if UDP port 161 (SNMP daemon) or 162 (SNMP Trap) are open. If so, an SNMP query is initiated to the endpoint using a configurable community string to collect additional information about the endpoint from the System MIB and others. This probe has proven especially useful in endpoints like network printers and cameras that support SNMP.
| ⓘ | Note: The default SNMP community string is public, but other strings can be configured under global Profiler settings. The PSN will first attempt the community strings with SNMPv2c and fallback to SNMPv1 if no response received. SNMPv3 is not supported for endpoint SNMP queries. The SNMP query triggered by the NMAP probe should not be confused with the SNMP Query probe which queries network devices, not endpoints, and has configurable SNMP settings under the Network Device settings. However, the NMAP probe does request the service of the SNMP Query probe to perform queries against endpoints, but this operation occurs without explicit enablement of the SNMP Query probe. Profile updates resulting from NMAP-triggered SNMP query may reflect EndPointSource as SNMPQuery Probe even if the probe is disabled. |
The Common Ports Scan performs a scan of common TCP and UDP ports. As of the writing of this guide, the collective list of “common ports” includes 18 TCP and 16 UDP ports, as shown in Table 5:
|
TCP Ports |
UDP Ports |
|||
| Port | Service | Port | Service | |
| 21/tcp | ftp | 53/udp | domain | |
| 22/tcp | ssh | 67/udp | dhcps | |
| 23/tcp | telnet | 68/udp | dhcpc | |
| 25/tcp | smtp | 123/udp | ntp | |
| 53/tcp | domain | 135/udp | msrpc | |
| 80/tcp | http | 137/udp | netbios-ns | |
| 110/tcp | pop3 | 138/udp | netbios-dgm | |
| 135/tcp | msrpc | 139/udp | netbios-ssn | |
| 139/tcp | netbios-ssn | 161/udp | snmp | |
| 143/tcp | imap | 162/udp | snmptrap | |
| 443/tcp | https | 445/udp | microsoft-ds | |
| 445/tcp | microsoft-ds | 500/udp | isakmp | |
| 515/tcp | printer | 520/udp | route | |
| 631/tcp | ipp | 631/udp | ipp | |
| 3306/tcp | mysql | 1434/udp | ms-sql-m | |
| 3389/tcp | ms-term-serv | 1900/udp | upnp | |
| 8080/tcp | http-proxy | |||
| 9100/tcp | pdl-datastream/jetdirect | |||
One example of using the Common Ports Scan is a Profile Policy based on matching TCP port 515, 631, or 9100. Each of these ports is related to network printing; TCP/515 is the well-known port for Line Printer Remote (LPR)/Line Printer Daemon (LPD)-based printers; TCP/631 is the Internet Printing Protocol (IPP) and is supported by the majority of printers sold today; TCP/9100 is a raw streaming port—most commonly associated with HP JetDirect print servers. When combined with an OUI-based condition for popular printer manufacturers, it is possible to identify many of the printers across the network.
The list of common ports scanned is not configurable. The Custom Ports Scan allows administrators to define specific ports to scan outside the list of predefined common ports. Up to 10 custom UDP and 10 custom TCP ports can be defined per NMAP Scan Action or manual scan event.
SMB Discovery performs an “nmap --script smb-os-discovery” to extract operating system, computer name, domain, workgroup, and Common Platform Enumeration (CPE) info over the SMB protocol (ports 445 or 139). When the SMB discovery script is run, the returned attributes are prefixed with SMB, such as SMB.operating-system, SMB.lanmanager, SMB.server, SMB.fqdn, SMB.domain, SMB.workgroup, and SMB.cpe.
| ⓘ | Note: SMB Discovery assumes the client is reachable via ports 139 and 445 and that File and Print Sharing is enabled. If security policy mandates that SMB access be blocked, then it will not be possible to acquire the additional attributes collected through the NMAP SMB OS Discovery script. |
Service Version Information
When either Common Port Scan or Custom Port Scan is selected, an additional level of scanning can be performed by enabling the Include service version information option in a Network Scan Action or Manual Scan. This option instructs the NMAP probe to perform an “nmap -sV” operation to provide Service and Application Version detection for all selected ports.
Administrators may choose to classify and secure endpoints differently based on services they run. For example, a Windows server running web services may require a specific authorization policy applied (dACL, VLAN, SGT) to ensure it is protected from non-HTTP requests. Conversely, a Windows or Linux workstation running a web server may need to be denied access or quarantined using similar authorization methods.
McAfee ePolicy Orchestrator Agent Detection
The NMAP probe is capable of detecting the presence of McAfee ePolicy Orchestrator (McAfee ePO) agent. When Service Version Information is included in a port scan, the Profiling Service will automatically include a scan for the ePO client. ISE includes a prebuilt NMAP Scan Action for detecting ePO client on the default port of TCP/8081 named MCAFeeEPOOrchestratorClientscan.
| ⓘ | Note: If a custom port is used for MacAfee ePO server to agent communications (for example, TCP/8085), then simply include that port in the Custom Port Scan list and enable the option to include Service Version Information. The MacAfee ePO agents must be enabled for agent-to-server communication. Additionally, the ePO Server must configure its agents to allow communications from foreign hosts. This is typically controlled on ePO Server by unchecking the option Accept connections only from the ePO server. |
NMAP Host Discovery
When scanning a large group of endpoints, it is common for many to be offline or significant number of IP addresses in a range to be inactive. In such cases it is more efficient to validate that the endpoint is actually connected and reachable on the network before attempting a more in-depth network scan. When defining a new NMAP Scan Action or initiating an on-demand scan, the default behavior is to first check the presence of the endpoint’s IP address using a simple ping check. If the endpoint responds, ISE continues with the specified scan actions. If the endpoint fails to respond to the ping, scanning of that IP is skipped. This additional test probe is referred to as NMAP Host Discovery.
There are cases when the selected IP range is known to be active, or mostly active, and the additional connectivity check actually increases the processing overhead. It is also possible that ICMP traffic is blocked from reaching endpoint while other network ports are open. In these situations, it may be desirable to disable the ping check. This is accomplished by checking the “Skip NMAP Host Discovery” option in the NMAP scan configuration. This setting essentially runs NMAP with the “-Pn” parameter to bypass the ping check.
| ⓘ | Note: NMAP Host Discovery is never performed (ICMP check is bypassed) for a triggered NMAP scan. It is always assumed that the endpoint is alive and reachable when the Network Scan Action is initiated for an individual host. |
Subnet Exclusions
NMAP scan results can provide valuable attributes for endpoint profiling. However, Network Scan is an “active” probe. Unlike most other Profiler probes which are passive in nature by collecting telemetry from the network devices and other external sources, the NMAP probe interrogates the actual endpoint through port scans, crafted packets, or even initiate an SNMP query to the endpoint. Such scanning could potentially disrupt services, especially IoT devices that run a rudimentary operating system. Although the role they play is critical, these systems may have limited protections and infrequent patches or updates to make them more resilient to scanning.
If the risk to service availability is deemed more impactful than the potential benefits gained from the NMAP probe, scanning should be disabled for subnets where these critical but fragile systems are present. ISE Profiler allows admins to define NMAP Scan Subnet Exclusions to prevent network scanning for specified IP address ranges.
The NMAP probe can be initiated using one of two methods:
- Network Scan (Manual, On-Demand)
- Endpoint Scan (Automatic, Triggered)
The sample topology in Figure 57 depicts a Network Scan being initiated across the 10.1.10/24 subnet (highlighted in red).
NMAP Probe Network Scan
The Network Scan is an on-demand scan against one or multiple network endpoints based on IP subnet. It is manually started by an admin user through the ISE administrative interface. The NMAP scan runs from the selected Policy Service node and the results updated to endpoints upon completion. The admin can define new scan options at the time of execution, save the new scan settings for reuse, or load a previously saved NMAP Scan Action. Figure 57 illustrates this concept (shown in red).
Since scans of large networks can be time consuming and add load to the Policy Service node, it is recommended that the scope of the subnet be selected carefully. After initiating the scan, the admin user can click a link to navigate to a page where results are displayed.
NMAP Probe Endpoint Scan
An Endpoint Scan is a triggered scan against a single endpoint. It is automatically initiated based on a matching rule in the Profiling Policy. In order for the triggered scan to occur, the endpoint must match both the profile policy as well as the specified condition to which a Network Scan Action is assigned. The Network Scan Action is configurable per profile rule and defines the specific scan operations to be taken.
There are three predefined NMAP Actions which can be assigned as responses to matching profile rules:
- MCAFeeEPOOrchestratorClientscan = McAfee ePO agent scan only
- OS-scan = OS scan only
- SNMPPortsAndOS-scan = SNMP Ports + OS scan
The sample topology in Figure 57 depicts this process. A new endpoint is detected as a result of a recent probe event (shown in blue). Per previous profile data collected, the endpoint is known to be an Apple device based on OUI from its MAC address, but it is not known if the endpoint is a Mac OS X workstation, Apple iDevice, or another Apple endpoint. A policy rule is matched that triggers a pointed OS scan against the Apple device (shown in green). As a result, it is learned that the endpoint is running Apple iOS and its profile is updated to that of a mobile Apple device.
Endpoints that match the Unknown profile are automatically scanned using the SNMPPortsAndOS-scan which performs both an SNMP ports and OS scan. This is not a configurable response. It is intended to allow ISE Profiling to quickly gain more information about any endpoint that is discovered but not profiled.
| ⓘ | Note: Some endpoints have personal firewalls or other agent software enabled which blocks attempts to scan the endpoint. These endpoints will yield little or no NMAP data. Additionally, any endpoints that have restricted network access may not be able to receive or reply to NMAP operations. |
NMAP Probe and IP-to-MAC Address Binding Requirement
NMAP is based on a known IP address. If the NMAP probe collects attributes for an endpoint but cannot correlate that to a specific MAC address, that data is discarded. If the Policy Service node is on the same segment as the endpoint it is scanning, it can learn the IP-to-MAC address binding from its local ARP cache and add the endpoint directly into the Internal Endpoints database. Consequently, it is required to learn the IP-to-MAC address binding via another probe prior to collecting NMAP probe data. Probes that can be used to provide this information include the following:
- RADIUS (via Framed-IP-Address)
- DHCP (via dhcp-requested-address)
- SNMP Query (via SNMP polling)
- pxGrid (via assetIpAddress)
Cisco Best Practice: During the discovery phase of an ISE deployment when ISE is not yet authenticating endpoints, the Network Scan can be run against larger network blocks to scan and detect endpoints along with any relevant OS and endpoint information. It is recommended that the SNMP Query probe also be enabled during this phase for all network devices that store endpoint ARP table information. This will allow discovery of endpoint MAC and IP addresses, including statically addressed endpoints. This, in turn, will support NMAP probe collection, as the PSN should now have MAC addresses for each IP address discovered during the Network Scan.
Configuring the NMAP Probe
As just described, there are two methods to run the NMAP probe—either as a manual, on-demand Network Scan or as an automatically triggered scan event for a single endpoint. Common configuration elements will be covered first and then procedures to use each scan method will be covered separately.
Procedure 46 Verify Global Profiler Settings for NMAP Scanning
Step 1 Go to Work Centers > Profiler > Settings > Profiler Settings and review the current SNMP community strings used in NMAP scans based on detection of UDP Ports 161 and 162 (Figure 58).
Step 2 The default SNMP community used for endpoint queries triggered by the NMAP probe is set to public. To see the current community strings, click Show. A window will display to reveal the current value(s). In the example shown in Figure 58, the current settings are public, ciscoro, and ise-profiler. These values should match those configured on the endpoints. Click OK when finished reviewing the current settings.
Step 3 To change the current community string(s), enter the new values under Change custom SNMP community strings” and re-enter under Confirm changed custom SNMP community strings.
Step 4 Click Save to commit the changes.
Step 5 Verify new settings by clicking Show.
| ⓘ | Note: Community string entries are not cumulative. To add, change, or remove entries, be sure to include the entire list of community strings in the desired sequence. |
Procedure 47 Configure the NMAP Probe for Endpoint Scanning
Step 1 Go to Work Centers > Profiler > Node Config > Deployment and select the Policy Service node to perform profiling from list of deployed nodes on the RHS pane.
Step 2 Select the Profiling Configuration tab and select the box labeled Network Scan (NMAP) (Figure 59).
Step 3 Click Save to commit the changes.
Step 4 Repeat the steps in this procedure for all other Policy Service nodes configured with Profiling Services.
Procedure 48 Review NMAP Scan Actions (Preparation for Manual Network Scan)
Step 1 Go to Work Centers > Profiler > Policy Elements > NMAP Scan Actions from the LHS pane.
Step 2 Review the default NMAP Actions (Figure 60).
Additional NMAP Scan Actions can be defined if required. For example, a new Scan Action named CommonPorts or SNMPPorts can be created to perform only a scan of Common Ports or SNMP Ports, respectively, as part of a triggered response.
Procedure 49 Run a Network Scan
Step 1 To run an on-demand Network Scan, go to Work Centers > Profiler > Manual NMAP Scan (Figure 61). The scan options selected in the last scan are enabled by default to simplify repeated operations of the same type.
Step 2 Select the Policy Service node to perform NMAP scanning under on the RHS pane as shown in the example in Figure 62.
Step 3 Under Manual Scan Subnet, enter a valid IP subnet address and mask in the format shown. For example, to scan all endpoints on subnet 10.1.10.x, enter 10.1.10.0 and the appropriate number of mask bits (24) for a Class C subnet. Other subnet sizes can be selected, but consideration must be given to the scope of network and number of endpoints covered by the selection to reduce overall time and load to execute the scan.
Step 4 Under Scan Options, choose either Specify scan options or Select an existing NMAP scan action. To load an existing scan action, it must have been previously defined and saved to the list of NMAP Scan Actions as verified in previous procedure. Figure 63 shows an example of loading a previously-defined Scan Action.
Step 5 If an existing scan is loaded, proceed to Step 7. Otherwise, continue with the selection one or more scan options:
- OS – Enables operating system detection
- SNMP Port – Enables scan of UDP ports 161 and 162. If client responds, probe proceeds to perform SNMP queries of the endpoint using the community strings defined under global Profiler settings.
- Common Ports – Enables scan of frequently used ports including 18 TCP and 16 UDP ports (non-configurable).
- Custom Ports – Enables scan of up to 10 TCP and/or 10 UDP ports (configurable).
Figure 64 shows an example of UDP and TCP ports often used to allow remote desktop sharing. Such a scan could be triggered against specific clients and detect if they may be violating company policy, or simply allowing remote control from external systems.
By expanding the View Common Ports link, you will see the list of common ports for reference. It is not permissible to add a port from the common list as a custom port. Choose Common Ports if require scanning of ports in that list.
- Include service version information – Available only if Common or Custom Ports option is enabled, this option includes additional application and service version information for the scanned ports.
- Run SMB Discovery script – Enables execution of the SMB scanning script on ports 139 and 445 to acquire more detailed Windows-based information including FQDN, Domain, Workgroup, and operating system version.
- Skip NMAP Host Discovery – Available only for on-demand/manual scans, this option will bypass the ICMP ping check to verify if endpoint is active on the network before attempting other scan operations.
Step 6 Optional: To save the selected scan configuration for future use or reuse, click Save as Scan Action and provide the name of the NMAP Scan Action name and optional description as shown in the example (Figure 65).
Step 7 Click Run Scan. The display changes to indicate that a manual scan is in progress (Figure 66).
The scan will continue until completion, even if navigate away from the page. If attempt to load or run another manual scan, the “Manual scan in progress…” will reappear. To run another scan prior to completion of active scan, click Cancel Scan.
Step 8 Select Click to see scan results. This redirects the page to the menu item just below current location (Work Centers > Profiler > Manual Scans > Manual NMAP Scan Results).
Depending on the progress of the scan, endpoints with positive scan results will appear on the RHS pane only if included in last completed scan, one or more attributes are added or changed, and its IP address can be correlated to endpoint in ISE database based on its MAC address (Figure 67). Larger subnets and numerous scan options will contribute to the total scanning time.
| ⓘ | Note: Endpoints that do not display in the NMAP Scan Results include:
|
Step 9 Click endpoint entries by MAC address to view the results, as shown in the example (Figure 68).
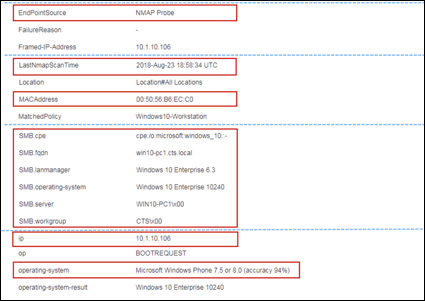
All NMAP scan operations were enabled for this example. The selected endpoint is a Windows 10 Workstation. The key attributes highlighted in red include:
- #-tcp = <open TCP ports> and Application and Service Versions
- #-udp = <open UDP ports> and Application and Service Versions
- EndpointSource = NMAP Probe
- LastNmapScanTime = 2018-Aug-23 18:58:34 UTC
- MACAddress = 00:50:56:B6:EC:C0
- SMB.<value> = SMB Discovery output
- ip = 10.1.10.106
- operating-system = Microsoft Windows Phone 7.5 or 8.0 (accuracy 94%)
As you can see from the output of the manual Network Scan, NMAP has detected multiple attributes that contributed to the endpoint classification.
The #-tcp and #-udp entries show the Common Ports that are open (client listening for service) on the endpoint. Most of the port scan entries have the default service name, but others have an extended description or version information. These expanded values are the result of enabling the option to fetch of Service Version Information.
The final port entry (8081-tcp) is the result of the Custom Port scan for the default ePO agent port. Again, as a result of Service Version Information, an additional scan for the presence of ePolicy Orchestrator agent was run and resulted in the extended value Network Associates ePolicy Orchestrator. If the port is open but ePO agent not running or discarding remote requests from the foreign PSN node, the value would likely be a more generic value such as tcpwrapper or blackice-icecap.
EndPointSource is shown as NMAP Probe. LastNmapScanTime is the date and time of last NMAP scan event for this endpoint.
MACAddress and ip are important to highlight to show that an IP-to-MAC address binding is needed to associate the IP-based scan data to an endpoint in the ISE Endpoint database.
The SMB entries are the result of a successful SMB Discovery scan. The attributes add a wealth of information related to the FQDN, Domain, Workgroup, and operating system.
Finally, the operating-system attribute is the result of the NMAP OS detection scan. While often useful, the result is a best estimate and not always reliable as seen in this particular example.
Procedure 50 Review NMAP Actions (Preparation for Triggered Endpoint Scan)
Step 1 Go to Work Centers > Profiler > Policy Elements > NMAP Scan Actions from the LHS pane.
Step 2 Review the available NMAP Actions (Figure 69). The default Cisco Provided entries cannot be modified, but new entries can be added. These newly added entries are flagged as Administrator Created as shown in Figure 69.
Procedure 51 Review the Configuration to Assign an NMAP Action to a Profiling Policy Condition
The intent of this procedure is to review how Network Scan Actions can be applied to a profile based on matching conditions. Profiling Policy configuration will be discussed in greater detail in the section Configuring Profiling Policies.
Step 1 Go to Work Centers > Profiler > Profiling Policies and select the Apple-Device profile from the list on the RHS pane (Figure 70).
Cisco Best Practice: To quickly find specific Profiling Policies, navigate the structured list in the LHS pane using the optional search bar to filter by policy name, or else use the Quick Filter at top right corner in RHS pane to search based on profile name, status, type, or description. More complex filters can be defined using the Advanced Filter and saved for future use.
Figure 70: Profiling Policy with NMAP Scan Action Example
Step 2 The Apple-Device profile has multiple rule entries. Click to the right of the condition named Apple-DeviceRule1Check1 to review its contents (Figure 71).
The condition matches if the OUI from MAC address matches “Apple”. The corresponding rule entry is used to match Apple endpoints to this profile by increasing its certainty factor (CF).
Step 3 Click to the right of the condition named Apple-DeviceRule1-SCAN to review its contents (Figure 72).
The corresponding rule is used to trigger an endpoint scan. Both rules match on the same condition. Therefore, any endpoint matching this profile based on matching OUI for Apple will automatically match the rule to trigger the Network Scan Action, which is OS-scan.
In this example, two separate conditions with identical contents were used, but the same condition could also be used to achieve the same result. Individual rule entries can be added or removed by clicking the gear icon to the right of the existing rule table.
Step 4 When you finish reviewing or making changes, click Save at the bottom of the page to commit changes.
Procedure 52 Verify NMAP Probe Data Based on a Triggered Endpoint Scan Action
Step 1 Go to the ISE Policy Administration node and navigate to Work Centers > Profiler > Endpoint Classification.
Step 2 Note the MAC address of target endpoint for testing and delete the endpoint.
Step 3 Disconnect and then reconnect the endpoint to the network.
Step 4 Under Work Centers > Profiler > Endpoint Classification, find and select the MAC address of the newly connected endpoint and then select the Attributes sub-menu to display the attributes captured by the NMAP probe (Figure 73).
In the example in Figure 73, only the RADIUS and DHCP (IP Helper) probes are enabled in addition to the NMAP probe. These additional probes are used to discover new endpoints and to add them to the Internal Endpoints database along with appropriate MAC address and IP address information. This will help to ensure NMAP probe data is properly applied and not discarded.
Step 5 The truncated output shows that an initial scan has been run against this endpoint (NmapScanCount), but the profile assignment of Apple-Device is still based on the OUI alone. The scan is triggered based on the matching OUI condition for Apple.
Step 6 After a brief period, the OS scan should complete. Refresh the attributes for the endpoint to review any updated profiling attributes (Figure 74).
The key attributes highlighted include:
- EndPointPolicy
- LastNmapScanTime
- NmapScanCount
- OUI
- operating-system
In this example, it is apparent that the NMAP scan completed. The EndPointSource attribute indicates that RADIUS made the last updates. This is possible, as the value will constantly change as different sources supply profiling data.
The LastNmapScanTime and NmapScanCount attributes are not really critical to device classification, but are highlighted to show attributes added by the NMAP probe.
The OUI attribute is Apple but now the profile assigned is that of Apple-iDevice instead of the more generic Apple-Device. This is due to a match on the triggered NMAP scan result, which revealed that the endpoint OS is Apple iOS. If you review the contents of the Apple-iDevice profile under Work Centers > Profiler > Profiling Policies, you can see that this profile can match on one of multiple conditions based on NMAP OS scan results (Figure 75).
This profile matches if either the NMAP scan returns an operating-system attribute value containing Apple iOS or Apple iPhone OS. In this example, it matched on Apple iOS.
If NMAP data does not appear, or not all of the expected attributes appear, then be sure to verify the following:
- Network connectivity between PSNs and endpoints
- Check the access policy of the endpoint. It is possible that the endpoint has limited network access when first connected to the network which may block attempts to query via NMAP or SNMP.
- Firewalls or other security systems may be in place that restrict endpoint scanning to an administratively-defined set of network management and security scanners. If so, work with security policy team to determine if PSNs can be granted access on the required ports and added to the list of approved scanners.
- If Host Discovery is enabled for manual network scans, is ICMP allowed between PSNs and the endpoint. If ICMP is blocked, then options include “Skip Host Discovery” or else allow ICMP between PSNs and endpoints.
- IP-to-MAC bindings – Be sure the IP address for the endpoint is known by the PSN. ISE will drop NMAP probe data if the IP address cannot be correlated to the endpoint MAC address. Also note that ISE will clear the IP address for an endpoint if RADIUS Accounting Stop is received for the endpoint’s session.
- Client Permissions
- Check for the presence of personal firewalls or host-based IPS (HIPS) that may block access from the PSNs. Again, it is a security policy decision to determine if the access is warranted based on risk versus profiling benefits.
- For SMB Discovery, is File and Print Sharing enabled? If not, review security policy to determine if SMB access from the PSNs is warranted.
- For ePO Scan, is server-to-agent communication enabled? Is the agent configured to allow access from PSNs? Is the correct port selected under Custom Ports scan with Service Version Information enabled in the NMAP Scan Action?
- For SNMP queries triggered by NMAP, is an SNMP agent installed and running on the endpoint? Have the correct community strings been configured to match ISE settings, and with a supported version of SNMP?
In summary, the NMAP probe can be useful in classifying endpoints based on their operating system, as determined by the Operating System scan. Many clientless devices support SNMP agents that can be queried using the NMAP probe for device classification. Other devices can be classified based on their open ports or running services, and policy may govern that certain devices running specific services should be granted more or less restrictive permissions. Independent of authorization policy assignments, each probe offers an additional level of visibility that can be invaluable to the operational and security management of the entire network.
Profiling Using the Active Directory (AD) Probe
The Active Directory (AD) probe improves the fidelity of operating system (OS) information for AD-joined endpoints. While the primary target for this probe is Windows clients, other client systems including Mac OS can be integrated into Microsoft AD and leverage this probe. Microsoft AD tracks detailed OS information for AD-joined computers including version and service pack levels. The AD probe retrieves this information directly using the AD Runtime connector to provide a highly reliable source of client OS information.
The AD probe can also help distinguish between corporate and non-corporate assets. A basic but important attribute available to the AD probe is whether an endpoint exists in AD. This information can be used to classify an endpoint contained in the AD as a managed device or corporate asset
The following attributes can be fetched using the AD probe:
- AD-Host-Exists
- AD-Join-Point
- AD-Operating-System
- AD-OS-Version
- AD-Service-Pack
The lookup to AD is based on the computer name of the endpoint. Therefore, ISE must first learn the hostname of the endpoint before it can check for the presence of the endpoint in AD and fetch its attributes. The hostname is typically learned from the following profile attributes and probes:
- Hostname (DHCP probe)
- FQDN (DNS probe)
- User-Name (RADIUS probe - Machine Authentication)
| ⓘ | Note: AD probe retrieves machine/computer attributes from Microsoft AD, not user attributes. Once Microsoft AD is queried for the host, the Policy Service node will not attempt to query AD again for the same endpoint until a rescan timer expires. This is to limit the load on AD for attribute queries. The rescan timer is configurable. |
Figure 76 depicts a sample topology using the AD probe. As the figure shows, the Policy Service node learns the endpoint hostname or FQDN from another source. The PSN then initiates an AD lookup for additional endpoint attributes.
Configuring the AD Probe
To use the AD probe and fetch computer object attributes from AD, ISE Policy Service nodes must be joined to the Active Directory domains where the endpoints exist.
Procedure 53 Enable AD Probe in ISE
Step 1 Go to Work Centers > Profiler > Node Config > Deployment and select the Policy Service node to perform profiling from list of deployed nodes on the RHS pane.
Step 2 Select the Profiling Configuration tab.
Step 3 Verify the AD probe is enabled. If not, check the box labeled Active Directory (Figure 77).
There is no interface selection with the AD probe as all probe queries are initiated by the ISE Policy Service node using the global routing table for lookups to the Domain Controllers (DCs) in the joined domain(s).
Leave the default value for Days before rescan. This value specifies the number of days the PSN waits before querying AD again for the same host when new profile data is learned. This helps to reduce the load on Active Directory DCs. One day should be adequate to keep queries to a minimum, but the interval can be increased if AD is determined to be under excessive load. Load due to authentication is typically the primary source of load on AD, not profiler activity.
Step 4 Click Save to commit the changes.
Step 5 Repeat the steps in this procedure for all other Policy Service nodes configured with Profiling Services.
Procedure 54 Configure Probes to Obtain the Endpoint Hostname/FQDN
| ⓘ | Note: In order for the AD probe to perform an AD lookup for the computer attributes, it must first learn the endpoint’s hostname or FQDN from the DHCP or DNS probes, or through machine authentication information learned by the RADIUS probe. Refer to the appropriate sections in this guide for details on the configuration of these probes. |
Procedure 55 Verify ISE is Joined to Active Directory
When Active Directory is deployed in an organization, ISE will typically be joined to AD for the purpose of machine and/or user authentication of credentials or MAC addresses. Other ISE services such as Passive Identity and agentless Posture can also leverage AD and necessitate the need to join the Policy Service nodes to AD. Therefore, it is possible that ISE was previously joined and no further action is required in this procedure other than verify PSNs are still successfully joined.
There may be cases where ISE is not joined to AD. For example, authentication is based solely on Identity Stores that exclude Microsoft AD (Internal database, Certificates, non-AD LDAP, ODBC, or RADIUS Token or Proxy) and AD authorization is not required. It is also possible that the ISE deployment is at early stages where initial focus is on visibility only without authentication. For these scenarios it may be necessary to join the PSNs to AD for the first time to support the AD probe.
Comprehensive procedures to join ISE to AD are beyond the scope of this guide. For detailed guidance, refer to the ISE documentation or other Cisco deployment guides specifically on AD integration.
Step 1 Navigate to Work Centers > Profiler > Ext Id Sources and click on Active Directory from the LHS pane as shown in the example (Figure 78).
Step 2 If one or more domain names are listed in the RHS pane, then ISE has previously been joined to AD. Click on the Join Point Name for the domain to be used for profiling (Figure 79).
Although important to ensure the health of all AD-joined nodes in the ISE deployment, make sure the PSNs with AD probe enabled appear in the list with Status = Operational. If not, resolve the join failure before proceeding. Common causes for AD join failures include DNS misconfiguration where name servers are incapable of resolving the domains, time sync issues (often referred to as clock skew), invalid credentials, or basic network connectivity issues.
Step 3 If no domain names were listed under External Identity Sources for Active Directory, click Add from the RHS pane and enter a Join Point Name to be given to the AD instance as well as the name of the Active Directory Domain as shown in the example (Figure 80).
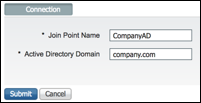

Respond Yes when prompted “Would you like to Join all ISE Nodes to this Active Directory Domain?” and enter admin credentials to complete the join process.
Procedure 56 Verify AD Probe Data
Step 1 Go to the ISE Policy Administration node and navigate to Work Centers > Profiler > Endpoint Classification.
Step 2 Note the MAC address of target endpoint for testing and delete the endpoint.
Step 3 Disconnect and then reconnect the endpoint from the access device.
Step 4 Under Work Centers > Profiler > Endpoint Classification, find and select the MAC address of the newly connected endpoint and then select the Attributes sub-menu to display the attributes captured by the AD probe (Figure 81).
The example in Figure 81 shows example profile attributes collected using only the DHCP and Active Directory probe. RADIUS was removed from the switch port to prevent a race condition with the RADIUS probe for the last endpoint update. This also highlights the fact that AD is not required to perform authentication to be used for profiling. The functions are independent while sharing the services of the same AD connector. DHCP probe was enabled to ensure ISE detect the endpoint and acquired both MAC and IP address in the absence of RADIUS or other probes. DHCP also provided the critical hostname attribute which ultimately triggered the AD probe to fetch matching attributes. The dashed lines indicate sections where the output has been truncated for display purposes.
The key attributes collected are highlighted in red and include:
- AD-Fetch-Host-Name = win10-pc1$
- AD-Host-Exists = true
- AD-Join-Point = CTS.LOCAL
- AD-Last-Fetch-Time = 1535143391881
- AD-OS-Version = 10.0 (17134)
- AD-Operating-System = Windows 10 Enterprise
- EndPointSource = Active Directory Probe
- hostname = win10-pc1
- operating-system-result = Windows 10 Enterprise
The AD-* attributes provide a wealth of information. A key attribute is AD-Host-Exists = true as this declares this endpoint as a managed workstation in the organization’s Active Directory. Other AD attributes provide details regarding the domain and specific operating system. The AD-Last-Fetch-Time tracks the epoch time of the last scan. The minimum interval between any two fetch times is 1 day per the PSN’s AD probe configuration.
EndPointSource reflects the last source of endpoint attributes, i.e. Active Directory Probe.
The DHCP hostname was critical to provide the key for the lookup to AD.
The operating-system-result is highlighted to show how ISE Profiler determined the OS based on the most trustworthy source. Even if the OS was learned from an NMAP OS Detection scan, for example, the final result would still have been “Windows 10 Enterprise” based on the fidelity of the source.
Profiling Using the pxGrid Probe
Cisco Platform Exchange Grid (pxGrid) is a multivendor, cross-platform network system that allows sharing of device and user context across a wide range of network and security solutions such as security monitoring and detection systems, network policy platforms, asset and configuration management, and identity and access management platforms. Cisco pxGrid provides an open and standard interface to enable participants to share information (publish) as well as receive shared information (subscribe). This publisher/subscriber framework offers a scalable method for systems to share once across multiple receivers simultaneously. Cisco
The ISE pxGrid node currently provides the controller function for pxGrid. The pxGrid Controller is a master gatekeeper that manages published topics (predefined schema for shared data), authorizes subscribers, and serves as the switchboard operator for establishing direct pub/sub communications.
The pxGrid probe leverages Cisco pxGrid for receiving endpoint context from external sources. Prior to ISE 2.4, ISE services were strictly publishers that shared various context including session identity and group information as well as configuration elements to external subscribers. With the introduction of the pxGrid probe in ISE 2.4, other solutions serve as the publishers and ISE Policy Service nodes become the subscribers.
The pxGrid probe is based on pxGrid v2 specification using the Endpoint Asset topic (/topic/com.cisco.endpoint.asset) with Service Name “com.cisco.endpoint.asset”. Table 6 displays the topic attributes—all of which are preceded by the prefix “asset”:
Table 6: pxGrid Probe – Endpoint Asset Topic
| Attribute Name | Type | Description |
| assetId | Long | Asset ID |
| assetName | String | Asset name |
| assetIpAddress | String | IP address |
| assetMacAddress | String | MAC address |
| assetVendor | String | Manufacturer |
| assetProductId | String | Product Code |
| assetSerialNumber | String | Serial Number |
| assetDeviceType | String | Device Type |
| assetSwRevision | String | S/W Revision number |
| assetHwRevision | String | H/W Revision number |
| assetProtocol | String | Protocol |
| assetConnectedLinks | Array | Array of Network Link objects |
| assetCustomAttributes | Array | Array of Custom name-value pairs |
Cisco and third-party products can publish information about endpoints using these predefined attributes. In addition to the attributes commonly used to track networked assets such as device MAC address (assetMacAddress) and IP address (assetIpAddress), the topic allows vendors to publish unique endpoint information as Custom Attributes (assetCustomAttributes). The use of Endpoint Custom Attributes in ISE makes the topic extensible to a variety of use cases without requiring schema updates for each new set of unique vendor attributes shared over pxGrid.
The first application to implement the pxGrid probe was Cisco Industrial Network Director (IND). Cisco IND is a network management system specifically designed to help operations teams manage automation by providing full visibility and control of the industrial Ethernet network infrastructure. The pxGrid probe allows ISE to learn advanced details of IoT manufacturing devices through Cisco IND’s unique understanding of the industrial ethernet network.
Figure 82 shows a Cisco IND Attributes example of the type of attributes shared with ISE using the pxGrid probe.
| ⓘ | Note: Additional details on pxGrid may be found on Cisco.com. For organizations looking to add pxGrid capabilities to share unique endpoint context from their applications, visit https://developer.cisco.com/site/pxgrid/. |
Figure 83 depicts a sample topology using the pxGrid probe. The pxGrid Publisher in this example diagram is Cisco IND. Cisco IND discovers detailed information about industrial automation devices using Common Industrial Protocol (CIP), PROFINET, Modbus, OPC Unified Architecture (OPC-UA), BACnet, Siemens S7, and other industrial protocols.
Once the pxGrid publisher (Cisco IND) is authorized to the topic with the pxGrid Controller (ISE pxGrid node), it will begin to update subscribers regarding creates, updates, and adds to its endpoints. The operation type for each endpoint is advertised in the pxGrid updates. When the pxGrid probe is enabled on an ISE PSN, it will first fetch all endpoints from the publisher using a bulk query. This event allows the PSN to get “caught up” with current endpoint information and status. Once fully updated, PSNs running the probe can begin receiving delta updates as they occur over pxGrid.
PSNs with the pxGrid probe enabled will perform a pxGrid Bulk Request under the following conditions:
- New publisher announced for Endpoint Asset topic
- Server restart
- Out-of-Sync flag received by publisher. Cisco IND, for example, maintains sync status via a poller mechanism. If out-of-sync condition detected, IND marks sync flag on next request and ISE will perform a Bulk Request.
Figure 83: pxGrid Probe Example
Cisco Best Practice: One Publisher is depicted in the figure, but ISE supports multiple, different publishers for the same Endpoint Asset topic. Similarly, multiple PSNs can be configured as subscribers to the Endpoint Asset topic by enabling the pxGrid probe.
Each PSN enabled with the pxGrid probe will subscribe to the same topic and each PSN receives the same endpoint events. Therefore, it is recommended to limit the number of PSNs enabled with the pxGrid probe. For most customers where high availability is required, enable the probe on one additional PSN—preferably in a separate data center for geographic redundancy. Enabling the pxGrid probe on more than two PSNs could unnecessarily increase the overall load to collect and process duplicate endpoint attributes. There is currently no option to selectively receive a filtered set of events.
Configuring the pxGrid Probe
To collect endpoint attributes using the pxGrid probe, pxGrid must be running in the ISE deployment. External systems that support publishing to the Endpoint Asset topic must be registered and authorized to the pxGrid controller. Finally, select PSNs need to be configured to subscribe to the Endpoint Asset topic.
| ⓘ | Note: Comprehensive configuration for pxGrid services and specific publishers is beyond the scope of this guide. Please refer to the ISE documentation for a detailed overview on pxGrid configuration and deployment. Refer to product-specific configuration guides for details on deployment and integration of external publishes (for example, Cisco IND) with Cisco ISE. |
The ability to leverage Custom Attributes from the publisher also requires configuration. First, ISE must be configured to accept Endpoint Custom Attributes over pxGrid and allow their use in ISE Profiler conditions and policies. Secondly, the Endpoint Custom Attributes must be defined in ISE. If not configured, or if misconfigured, then the data sent in these custom fields via pxGrid will be dropped and not recorded to the ISE Endpoint database.
| ⓘ | Note: ISE version 2.4 is the minimum release that supports the pxGrid probe. ISE 2.4 is also the minimum release to support the use of Endpoint Custom Attributes in ISE Profiling Policies. |
Procedure 57 Verify pxGrid Services in the ISE Deployment
Step 1 Navigate to Work Centers > Profiler > Node Config > Deployment. Verify that one or more nodes have pxGrid listed as one of its personas under the Personas column on the RHS pane.
a.If none of the ISE nodes have pxGrid listed as a persona, then pxGrid services have not yet been configured in the ISE deployment. Refer to the ISE documentation for an overview on pxGrid configuration before continuing.
b.For each node enabled for pxGrid, click on its name and note the IP address. Access the command-line interface (CLI) console of each pxGrid node and verify services are running as shown in the sample excerpt below.
ise-pxg-1/admin# show application status ise

ISE PROCESS NAME STATE PROCESS ID
--------------------------------------------------------------------
...
pxGrid Infrastructure Service running 302
pxGrid Publisher Subscriber Service running 572
pxGrid Connection Manager running 508
pxGrid Controller running 616
...
ise-pxg-1/admin#
Procedure 58 Verify pxGrid Publisher is Registered and Authorized
Step 1 Navigate to Administration > pxGrid Services > All Clients and verify that the external publisher for the Endpoint Asset topic is present in the list. If not present in this list, then be sure to complete the steps to register the external publisher before continuing. Also make certain that the required ports are open between the external pxGrid client (the publisher) and the ISE pxGrid nodes. Currently ISE pxGrid v2 uses TCP/8910 for registration, pub/sub operations, and bulk queries. Additional ports may be needed as mandated by the external publisher.
Step 2 If the publisher appears in the list but has a Status = Pending, that indicates registration has been initiated but requires explicit approval. Figure 84 shows an example where the publisher (Cisco IND) is pending approval. Select the checkbox for the entry and click Approve from the menu to authorize the new publisher. Once authorized, it may be necessary to return to the publisher to activate the registration. When the pxGrid Controller settings are configured to “Automatically approve new certificate-based accounts”, this step should not be required.
Figure 84: Authorized pxGrid Clients
Step 3 Go to Administration > pxGrid Services > Web Clients and verify that the external publisher for the Endpoint Asset topic is present in the list and that its Status = ON.
Figure 85 shows an example of the Web Clients page. Note that our external publisher (Cisco IND) is listed at the bottom. The name assigned to this publisher is “ind” and its Status = ON.
Once the pxGrid probe is enabled, additional entries should appear for each PSN configured for the pxGrid probe to indicate its subscription to the Endpoint Asset topic (/topic/com.cisco.endpoint.asset). In the figure, PSN1 has been enabled for pxGrid probe (ise-admin-ise-psn-1) and the Endpoint Asset topic is listed under its Subscriptions. The publisher may not initially display the Endpoint Asset topic under Publications. However, this entry should appear when the publisher sends updates that occur after the PSN has joined the topic.
Procedure 59 Enable Global Profiler Settings for Custom Attributes
Step 1 Navigate to Work Centers > Profiler > Settings > Profiler Settings.
Step 2 Select the checkbox for Enable Custom Attribute for Profiling Enforcement (Figure 86).
This setting enables Custom Attributes to be used for profiling purposes including the processing of Custom Attributes received from the pxGrid probe as well as the use of Endpoint Custom Attributes in Profiler Conditions and Profiling Policies. If disabled, then conditions based on these attributes may be ignored.
Cisco Best Practice: Do not enable the Custom Attribute for Profiling Enforcement option unless specifically required. The use of this feature does consume additional ISE resources to track and manage these additional attributes so recommend only enable when needed to support the pxGrid probe or other use cases to based Endpoint Profiles on custom-defined fields.
Procedure 60 Create Custom Attributes as Required by Publisher
Complete this procedure if your external publisher sends Custom Attributes in the Endpoint Asset topic. If there are Custom Attributes which are sent but not needed, then do not create matching attributes in ISE. The core set of attributes are predefined as part of the Profiler IOTASSET dictionary and cannot be changed.
Step 1 Go to Administration > Identity Management > Settings and select Endpoint Custom Attributes from the LHS pane. The RHS pane displays the current list of predefined, non-configurable Endpoint Customer Attributes (for reference) at the top of the page. Admin-defined Endpoint Custom Attributes, if any, appear at the bottom of the page.
| ⓘ | Note: Be sure not to confuse the User Custom Attributes page with the Endpoint Custom Attributes page. The general layout is similar so location may be accidentally mistaken since User Custom Attributes is the default landing page under Administration > Identity Management > Settings. |
Step 2 Enter Attribute name—being sure to use correct spelling and exact case—in the empty field at the bottom of the RHS pane.
Step 3 Select String from the drop-down list under the attribute Type field. Multiple Endpoint Custom Attributes can be configured by clicking the plus (+) sign at the end of the final entry.
Figure 87 shows an example of two Endpoint Custom Attributes (assetGroup and assetTag) used to integrate Cisco IND with the pxGrid Probe.
Step 4 Once certain of spelling and case of each new Endpoint Custom Attribute, click Save.
Procedure 61 Enable pxGrid Probe on Select PSN(s)
Step 1 Go to Work Centers > Profiler > Node Config > Deployment and select the specific Policy Service node to perform the Subscriber function for ISE Profiling from list of deployed nodes on the RHS pane.
Step 2 Select the Profiling Configuration tab and check the box labeled pxGrid (Figure 88).
Step 3 Click Save to commit the changes.
Step 4 For redundancy, repeat the steps in this procedure on one additional Policy Service node—preferably a node in a secondary data center in a distributed deployment to provide high availability across locations. Unlike other probes that are capable of receiving data from unique sources, the information received from one or more publishers to the Endpoint Asset topic is currently the same across all subscribers (PSNs enabled for the pxGrid probe).
Procedure 62 Verify pxGrid Probe Data
Step 1 Go to the external publisher application (for example, Cisco IND) and find an endpoint that includes a MAC address. Note the MAC address of the endpoint.
Step 2 Go to the ISE Policy Administration node and navigate to Work Centers > Profiler > Endpoint Classification. Find and select the MAC address of the endpoint chosen in Step 1.
If endpoint is not found, check the MAC address again and verify value was entered using a valid format such as xx:xx:xx:xx:xx:xx. If still not found, then return to configuration to troubleshoot setup. Also make certain that the required ports including TCP/8910 are open between the external pxGrid publisher and both the ISE pxGrid node and all PSNs configured for the pxGrid probe; the pxGrid Bulk Request requires direct communication between the PSN (the subscriber) and the external publisher.
Step 3 Select the Attributes sub-menu to display the attributes captured by the pxGrid probe.
Figure 89 shows sample pxGrid Probe Attributes learned using only the pxGrid probe. Neither RADIUS nor SNMP (for PSN access) was enabled yet on the industrial ethernet (IE) switch. The endpoint is statically addressed so no DHCP information could be gleaned. If the IoT device was registered in DNS, then the DNS probe could pick up the FQDN. Due to the sensitive nature of the endpoints, NMAP scanning was not permitted. The dashed lines indicate sections where the output has been truncated for display purposes.
The key attributes collected that are highlighted include:
- EndPointSource = PXGRIDPROBE
- LogicalProfile = Industrial Automation Devices
- MatchedPolicy = Industrial-IO
- OUI = Siemens AG
- assetDeviceType = IO
- assetId = 109
- assetIpAddress = 172.27.162.167
- assetMacAddress = 28:63:36:5d:51:86
- assetName = et200mxb167f362
- assetProductId = 6ES7 153-4AA01-0XB0
- assetProtocol = PROFINET
- assetSerialNumber = S C-H5CV22852016
- assetVendor = SIEMENS AG
- assetGroup = Root > Zone2
As expected, the EndPointSource is the pxGrid probe. All of the attributes prefixed with “asset” are the values learned directly from the pxGrid probe. Also notice that one of the Custom Attributes (assetGroup) is also populated. As a Custom Attribute, assetGroup appears in its own section.
The pxGrid Probe was the source to populate the MACAddress (which automatically provided the OUI of Siemens AG), as well as the IP address which can be used to correlate other attributes based on IP address. The LogicalProfile was created to logically group all Industrial Automation Devices. Logical Profiles can be leveraged in Context Visibility views, reports, as well as Authorization Policy conditions.
The MatchedPolicy is Industrial-IO and is based on a custom profile which keys off the assetDeviceType. Other unique identifiers that can be used to uniquely classify the endpoint include OUI, assetVendor, assetName, assetProductId, and assetProtocol.
The assetGroup of Root > Zone2 is a value assigned by the OT administrator. Profiling and Authorization Policy can easily be based on this value. This allows OT admins to use their native management applications to control groupings that directly translate into IT access control and segmentation policies.
Endpoint Custom Attributes
Endpoint Custom Attributes are administrator-defined fields which are associated with each endpoint in ISE. They are persisted values which can be referenced in ISE Profiling Policy Conditions as well as conditions used in ISE Authorization Policy Rules. Custom Attributes can even be used to assign dynamic permissions in the Authorization Profile (for example, assign a unique ACL, VLAN, SGT, URL redirect, or individual Pre-Shared Key based on the dynamic lookup from the endpoint’s Custom Attribute values!). These custom fields are accessible to Context Visibility views to provide filtering, sorting, and reports based on unique customer-defined information.
Values assigned to Endpoint Custom Attributes can be updated through the following methods:
- Admin user interface
- Singular entry
- File import
- External RESTful Services (ERS) API
- pxGrid probe
The pxGrid probe is one example of how Endpoint Custom Attributes can be populated and used in ISE policy. Custom attributes can be used to represent virtually any endpoint value for tracking, visibility, or policy conditions. For example, Custom Attributes can be used to flag whether an endpoint is a managed asset or track its department, contact information, compliance or threat status and scores, or next maintenance date. The possibilities are endless as the attributes are not dictated by ISE, but the administrator.
Another use case for Custom Attributes is to populate the ISE Endpoint database with information available in asset management systems and configuration management databases (CMDBs). Endpoint telemetry learned and tracked in one specialized solution can be populated directly into ISE using the same or more user-friendly field names.
Configuring Endpoint Custom Attributes for Profiling
The overall process to leverage Endpoint Custom Attributes includes the enablement of these attributes at a global level, the definition of custom attributes, and the population of attributes.
| ⓘ | Note: ISE 2.4 is the minimum release to support the use of Endpoint Custom Attributes in ISE Profiling Policies. |
Procedure 63 Enable Global Profiler Settings for Custom Attributes
Step 1 Navigate to Work Centers > Profiler > Settings > Profiler Settings.
Step 2 Select the checkbox for Enable Custom Attribute for Profiling Enforcement (Figure 90).
This setting enables Custom Attributes to be used for profiling purposes including the processing of Custom Attributes received from the pxGrid probe as well as the use of Endpoint Custom Attributes in Profiler Conditions and Profiling Policies. If disabled, then conditions based on these attributes may be ignored.
Figure 90: Enable Endpoint Custom Attributes for Profiling
Cisco Best Practice: Do not enable the Custom Attribute for Profiling Enforcement option unless specifically required. The use of this feature does consume additional ISE resources to track and manage these additional attributes so recommend only enable when needed to support the pxGrid probe or other use cases to based Endpoint Profiles on custom-defined fields.
Procedure 64 Define Endpoint Custom Attributes
Step 1 Go to Administration > Identity Management > Settings and select Endpoint Custom Attributes from the LHS pane. The RHS pane displays the current list of predefined, non-configurable Endpoint Customer Attributes (for reference) at the top of the page. Admin-defined Endpoint Custom Attributes, if any, appear at the bottom of the page.
| ⓘ | Note: Be sure not to confuse the User Custom Attributes page with the Endpoint Custom Attributes page. The general layout is similar so location may be accidentally mistaken since User Custom Attributes is the default landing page under Administration > Identity Management > Settings. |
Step 2 Enter Attribute name in the empty field at the bottom of the RHS pane. Endpoint Custom Attributes are added to the CUSTOMATTRIBUTE dictionary. Be sure to use correct spelling and exact case to avoid potential attribute mismatch issues when updating or retrieving values.
Step 3 Select the data Type from the drop-down list as shown in Figure 91. Additional Endpoint Custom Attributes can be added by clicking the plus (+) sign at the end of the final entry, or deleted by clicking the minus (-) sign next to the corresponding entry.
The valid attribute data types include:
- String Alphanumeric characters including letters, numbers, spaces, and punctuation marks.
- Int Integer; whole or non-fractional number
- Boolean true / false
- Float Floating Point; fractional numbers (numbers with decimal points)
- Long Larger integers up to 64 bits long
- IP IP address
- Date Date
| ⓘ | Note: ISE supports a maximum of 100 Endpoint Custom Attributes. |
Step 4 Once certain of spelling and case of each new Endpoint Custom Attribute, click Save.
Procedure 65 Populating Endpoint Custom Attributes for a Single Endpoint
Step 1 Go to Work Centers > Profiler > Endpoint Classification.
Step 2 Select an endpoint to modify its Custom Attributes.
Step 3 Click the edit icon to change the endpoint record as shown in the example (Figure 92).
The Edit Endpoint window appears.
Step 4 Enter an optional Description under the General Attributes section. This value can be used to track ad-hoc information about the endpoint and is available in Context Visibility filter and sort operations.
Step 5 Expand the Custom Attributes section and locate the Custom Attribute to modify. Click the edit icon to the right of the attribute and enter in the new attribute value (Figure 93).
| ⓘ | Note: The blank entries at the top of the Custom Attributes section are used to filter the list of existing entries, not define new entries. To define new Endpoint Custom Attributes, refer to the previous procedure. |
When the edit is complete, select the checkmark (✓) to the right of the attribute to accept the change, or else click the ✖ to cancel the change. The input values are checked against the data type selected for the attribute (String, Int, Boolean, Date, etc.) and error displayed if incorrect format. Attributes updated manually using the ISE admin interface will show EndPointSource as GUI.
Step 6 Edit additional attributes as required, and then click Save at the bottom right corner of window to commit all endpoint changes.
Procedure 66 Populating Endpoint Custom Attributes using File Import
Step 1 Go to Work Centers > Profiler > Endpoint Classification and click on Import > Import From File from the lower menu (Figure 94).
| ⓘ | Note: Import from LDAP is a valid option to import endpoints. However, this option is currently limited to the import of MAC address and Endpoint Policy only and is therefore not suitable for updating Endpoint Custom Attributes. |
Step 2 The “Import Endpoints from CSV file” window appears (Figure 95). If this is the first time importing endpoints in current ISE version, be sure to select the option to Generate a Template. The template defines the format of the import file as well as the attributes supported for import. Not all attributes that can be exported can be imported!
Save the template to a local folder.
Step 3 Open the saved template.
Cisco Best Practice: The template is a Comma Separated Value (CSV) file-formatted document. While possible to open and edit using any basic text editor, it is recommended to use a spreadsheet tool such as Microsoft Excel that can simplify the viewing and manipulation of the data.
Figure 96 shows the first few rows of a sample Endpoint Import Template. The columns have been layered to display all of the fields available for import.
The first three highlighted fields (MACAddress, EndpointPolicy, IdentityGroup) are mandatory and must be present as the first three columns in this order for successful import. Other attributes are optional and the field headers can be rearranged in any order provided the corresponding values use the same order. With the exception of the first three attributes noted above, if any attribute is not required, that field/column can be completely removed. If there are empty values, the resulting CSV file must still account for these empty values with a comma.
Note the presence of the Custom Attributes (CUSTOM.SGT, CUSTOM.ACL, CUSTOM.VLAN, …) added to the last columns. As new Custom Attributes are added or removed, it is important to generate an updated template. The base template is version-specific so it is important to use only templates for the specific version of ISE used. When Endpoint Custom Attributes are modified, the template becomes deployment-specific.
Step 4 Populate the template using any tools necessary. When updates are complete, save the resulting file as a CSV file! ISE will not import the file if not in the expected format.
Step 5 Return to Work Centers > Profiler > Endpoint Classification and the option to Import From File. Select the Browse link to choose the CSV file for import and click Submit.
| ⓘ | Note: There is a 20MB file limit on endpoint imports. If the import file exceeds 20MB, either reduce the number of attributes for import, or else break import file into smaller chunks. For example, take only a subset of row entries and save each into its own import template file, each with its own list of field headers. |
Procedure 67 Populating Endpoint Custom Attributes using ERS API
Comprehensive coverage on ERS API is beyond the scope of this guide. For complete details on the ERS API, please refer to the Cisco ISE documentation on Cisco.com as well as the resources provided in the Online SDK. This guide focuses on the basic steps to enable the API and provide insight into where and how attributes are updated.
Step 1 Go to Administration > System > Settings and select ERS Settings from the LHS pane.
Step 2 Verify that ERS is enabled for Read/Write operations and set appropriate security settings for CSRF Check (Figure 97). Note the URL listed on the ERS Settings page to access the online SDK. The ERS API is run against the Primary Policy Administration Node (PAN). The Primary PAN is the active “manager” for the configuration database which is replicated to all other nodes in the ISE deployment.
Step 3 Go to Administration > System > Admin Access and select Administrators > Admin Users from the LHS pane. If not already defined, create an internal admin user that is a member of the ERS Admin group. This group has full permissions for Read/Write on the Endpoints using the ERS API, whereas the ERS Operator group has Read-Only access (Figure 98).
Step 4 Use the link in the global ERS Settings page to access the online SDK for the ERS API. For example:
https://ise-pan-1.company.com:9060/ers/sdk
Be sure to use HTTPS, not HTTP.
Step 5 Enter the credentials for the ERS Admin user created in previous step. The ERS Online SDK appears (Figure 99).
The Online SDK is split into three core sections:
- Quick Reference – General information on API setup and usage of basic operations to search, filter, sort, create, update, and delete database information.
- API Documentation – Detailed information on the specific objects that can be managed (for example, End Point), available operations for the selected object, and specific syntax for each type of request.
- Developer Resources – Additional tools and multiple examples for scripting different use cases.
Step 6 Endpoint Custom Attributes can be updated using the Update API call for the End Point configuration object. Review the options available for updating endpoints using the API. Figure 100 shows a sample ERS API call to update a single endpoint’s Custom Attributes.
Cisco Best Practice: To update a large number of endpoints at once, the Endpoint Update API can be used in a Bulk Request. Bulk requests provide a more efficient means to execute APIs again multiple database entries and have much higher performance.
Figure 100: Sample ERS API (JSON Format)
Procedure 68 Populating Endpoint Custom Attributes using pxGrid
This information is covered under pxGrid probe section.
Procedure 69 Verify Profile Changes Using Endpoint Custom Attributes
Step 1 Use the ISE admin interface or ERS API to change the Custom Attributes of an endpoint. Note its MAC address.
Step 2 Under Work Centers > Profiler > Endpoint Classification, find and select the MAC address of the newly updated endpoint and then select the Attributes sub-menu to display the attributes captured by the NMAP probe (Figure 101).
The key attributes collected that are highlighted include:
- Custom Attribute: isManaged = true
- Custom Attribute: assetType = Building Automation
- EndPointPolicy = Building-Automation-Device
- EndPointProfileServer = pan1.company
- EndPointSource = REST
The Custom Attributes isManaged and assetType were updated using ERS API. Consequently, the EndPointSource is REST. Attributes updated manually using the ISE admin interface will show EndPointSource as GUI.
The EndPointPolicy is Building-Automation-Device. This is the result of a custom profile based on the Endpoint Custom Attribute assetType. The creation of custom profiles is covered later in this guide.
EndPointProfileServer is typically a PSN, but since the profiling occurred locally on the Primary PAN after local ERS update, the source is the FQDN of the Primary PAN (in this example, pan1.company.com).
Device Sensor
Device Sensor Overview
Device Sensor is an access device feature that is supported on many Cisco Catalyst switches and Wireless LAN Controllers. Device Sensor collects network information from connected endpoints through protocols such as CDP, LLDP, DHCP, and HTTP and forwards this information to the ISE PSN as Attribute-Value (AV) pairs in RADIUS accounting packets (Figure 102). ISE Profiler is able to collect and parse the AV pairs using only the RADIUS probe.
Device Sensor Details
Device Sensor gathers raw endpoint data from network devices. The endpoint information that is gathered aids in completing the local profiling capability of the switches and controllers as well as the telemetry made available to ISE Profiler. The profiling capability of the access device consists of two parts:
- Collector—Gathers endpoint data from connected endpoints
- Analyzer—Processes the data and determines the type of device
The Device Sensor represents the embedded collector functionality of the access device such as a Cisco Catalyst switch or Cisco Wireless LAN Controller. Figure 103 shows the Device Sensor in the context of the profiling system and also depicts other possible consumers of the sensor data.
A switch or wireless controller with sensor capability gathers endpoint information from network devices using protocols such as CDP, LLDP, and DHCP, subject to statically configured filters, and makes this information available to its registered clients in the context of an access session. An access session represents an endpoint's connection to the network device.
The Device Sensor has internal and external clients. The internal clients include components such as the embedded Device Classifier (DC, or local analyzer), Cisco Auto SmartPorts (ASP), MSI-Proxy, and Cisco EnergyWise™ (EW). Device Sensor uses RADIUS accounting to send data to external clients such as the Identity Services Engine (ISE) Profiling “analyzer”.
Figure 103: Device Sensor Operation Details
Client notifications and accounting messages containing profiling data along with the session events, and other session-related data, such as MAC address and ingress port data, are generated and sent to the internal and external clients (ISE). By default, for each supported peer protocol, client notifications and accounting events are only generated where an incoming packet includes a profiling attribute, or type-length value (TLV), that has not previously been received in the context of a given session. You can enable client notifications and accounting events for all TLV changes, where either a new TLV has been received or a previously received TLV has been received with a different value using CLI commands.
The sensor limits the maximum device monitoring sessions to 32 per port (access ports and trunk ports). In other words, a maximum of 32 endpoints may be monitored per port. An inactivity timer will age out sessions older than 12 hours.
Device Sensor Requirements
Many Cisco Catalyst Switches and Wireless LAN Controllers support the Device Sensor feature. Please refer to Device Sensor - Catalyst Supported Platforms for details.
| ⓘ | Note: Be sure to reference the applicable Release Notes for your platform to verify software version and feature set support. Additionally, each platform and software release will vary in the attributes it supports. For example, AireOS only supports HTTP and a subset of DHCP attributes. For more information, see Device Sensor - Catalyst Supported Platforms. |
When Device Sensor is configured on a Cisco wireless controller, DHCP profiling is enabled for all clients that join the WLANs configured for sensing. Both DHCP Proxy and Bridged modes are supported for client DHCP requests. The Device Sensor feature on Cisco WLCs/WiSM2s is controller based; standalone access points and local authentication with local switching are not supported.
Cisco Best Practice: Cisco WLCs and WiSM2s running AireOS 7.2.110.0 and above support Device Sensor for DHCP Profiling. However, the attributes are limited to DHCP host-name (Option 12) and class-identifier (Option 60). To collect other potentially useful attributes such as DHCP parameter-request-list (Option 55) and others, it is recommended to disable DHCP Profiling sensor on the wireless controller and instead use another method (for example, IP helper on Layer 3 gateway pointed to ISE DHCP probe) that is capable of processing these additional attributes.
Additionally, many WLCs are configured to use DHCP Proxy mode by default. This is a useful method for serving IP addresses from real DHCP servers, but offers no ability to forward secondary copies of DHCP data to ISE PSNs for profiling using the DHCP probes. Therefore, if not using the Device Sensor for Profiling on the WLC, it is also recommended that DHCP Bridged mode be used with appropriate helpers on the client gateways. This will ensure profiling redundancy as well as capture of all relevant DHCP attributes.
In summary, Device Sensor offers significant benefits in scaling data collection for ISE Profiling Services. The following list highlights key advantages of Device Sensor:
- Highly distributed data collection across the access layer, the points closest to the endpoint and source of data.
- Sole source of multimedia endpoint telemetry in ISE profiling such as H323, SIP, and mDNS.
- Ability to support cases where DHCP server is the Layer 3 access switch. A switch will not forward/relay DHCP packets if it is the DHCP server.
- Pre-processing and pre-filtering of relevant attributes. ISE PSNs need not consume raw packets that requires massive parsing and analysis.
- Consolidates the collection of multiple data types in batched updates, thus reducing overall load and deployment complexity to collect same data from multiple methods across the network.
- Use of RADIUS as the transport ensures the same PSN that terminates the session for authentication and authorization is also the same node which collects profile data for a given endpoint. This single ownership for RADIUS and profile data drastically reduces the amount of data replication that must occur on the backend, thus increasing overall ISE deployment stability and scale.
Configuring Device Sensor for ISE Profiling
This guide provides an example Device Sensor configuration for a particular Catalyst switch and version. While the majority of commands will be the same across Catalyst switches, each platform and version may vary in the exact set of commands required to enable the feature. Be sure to reference the product configuration guide for your particular switch model and version for the most up to date information.
The Device Classifier collects information from MAC-OUI and protocols such as CDP, LLDP, and DHCP to identify devices. To collect CDP and LLDP information, CDP and LLDP must be enabled on the Catalyst switch. To make DHCP options information available to the Device Classifier, the DHCP Snooping feature must be enabled on the switch. Filters can then be defined which specify specific attributes and options to be sent to the analyzer (ISE). To send sensor data to ISE, the access device must have RADIUS accounting enabled. ISE PSNs should also have the RADIUS probe enabled.
| ⓘ |
Note: RADIUS accounting is required to forward sensor data to ISE. However, RADIUS authentication and authorization are not required to collect and send device sensor data to ISE in 15.1.x and earlier. Device sensor will only trigger notifications if there is a successful authentication event in IOS 15.2.x and later (CSCux48616). After 15.2.x, IBNS 2.0 is required to send device sensor data without authentication. Therefore, it is possible to use the Device Sensor for pre-ISE deployments during a network discovery phase when an organization is not yet ready to enable RADIUS authentication, even if only Monitor Mode. Below are configuration steps may be required on the switch to force RADIUS accounting in the absence of authentication/Authorization:
|
Procedure 70 Enable RADIUS Probe in ISE
The steps for enabling the RADIUS probe have been covered in detail under the section Configuring the RADIUS Probe. Refer to that section for proper enabling and configuration for the RADIUS probe.
Be sure that the IP address entered in ISE matches the value sourced by the access device for sending RADIUS. In addition, be certain that the RADIUS key matches the value configured on the network devices. These steps are required to support reception of RADIUS accounting packets from the Device Sensor.
Procedure 71 Enable Profiling Protocols on Cisco Wired Switches
To collect CDP, LLDP, or DHCP attributes from the endpoint, the access switch needs to have these protocols enabled to allow it read and gather the associated attributes.
Step 1 Access the command console of an access switch with Device Sensor support.
Step 2 Enable the switch to support CDP.
a.CDP is enabled globally on Cisco switches by default. If disabled, enable it using this global command:
cat3750x(config)# cdp run
b.CDP is enabled on each switchport by default. If disabled, enable using the following interface command:
cat3750x(config-if)# cdp enable
Step 3 Verify CDP is working on the switch using the show cdp neighbors command as shown:
cat3750x# show cdp neighbors

Capability Codes: R - Router, T - Trans Bridge, B - Source Route Bridge
S - Switch, H - Host, I - IGMP, r - Repeater, P - Phone,
D - Remote, C - CVTA, M - Two-port Mac Relay
Device ID Local Intrfce Holdtme Capability Platform Port ID
ap1602 Gig 1/0/13 156 T B I AIR-CAP16 Gig 0
SEP001F6C7EE6A2 Gig 1/0/9 165 H P M IP Phone Port 1
SEP0016C898B6AB Gig 1/0/15 142 H P IP Phone Port 1
cat6503.cts.local
Gig 1/0/24 125 R S I WS-C6503 Gig 2/47
Total cdp entries displayed : 4
Here is an excerpt of the detailed view:
cat3750x# show cdp neighbors detail
-------------------------
Device ID: ap1602
Entry address(es):
IP address: 10.1.10.100
IPv6 address: FE80::6E20:56FF:FE13:E9FC (link-local)
Platform: cisco AIR-CAP1602I-A-K9, Capabilities: Trans-Bridge Source-Route-Brid
ge IGMP
Interface: GigabitEthernet1/0/13, Port ID (outgoing port): GigabitEthernet0
Holdtime : 131 sec
Version :
Cisco IOS Software, C1600 Software (AP1G2-K9W8-M), Version 15.3(3)JF4, RELEASE SOFTWARE (fc1)
Technical Support: http://www.cisco.com/techsupport
Copyright (c) 1986-2017 by Cisco Systems, Inc.
Compiled Sat 09-Dec-17 17:54 by prod_rel_team
advertisement version: 2
Duplex: full
Power drawn: 15.400 Watts
Power request id: 23811, Power management id: 2
Power request levels are:15400 13000 0 0 0
Management address(es):
IP address: 10.1.10.100
-------------------------
Device ID: SEP001F6C7EE6A2
Entry address(es):
IP address: 10.1.13.101
Platform: Cisco IP Phone 7971, Capabilities: Host Phone Two-port Mac Relay
Interface: GigabitEthernet1/0/9, Port ID (outgoing port): Port 1
Holdtime : 139 sec
Second Port Status: Down
Version :
SCCP70.8-4-4S
advertisement version: 2
Duplex: full
Power drawn: 14.900 Watts
Power request id: 59042, Power management id: 2
Power request levels are:14900 0 0 0 0
-------------------------
Step 4 Enable the switch to support LLDP.
a.LLDP is disabled globally on Cisco switches by default. To enable it enter the following global command:
cat3750x(config)# lldp run
b.LLDP is enabled on each switchport by default. If disabled, enable using the following interface command:
cat3750x(config-if)# lldp receive
Step 5 Verify that LLDP is working on the switch using the show lldp neighbors command, as shown:
cat3750x# show lldp neighbors
Capability codes:
(R) Router, (B) Bridge, (T) Telephone, (C) DOCSIS Cable Device
(W) WLAN Access Point, (P) Repeater, (S) Station, (O) Other
Device ID Local Intf Hold-time Capability Port ID
ap1602.cts.local Gi1/0/13 120 B Gi0
cat6503.cts.local Gi1/0/24 120 B,R Gi2/47
SEP0016C898B6AB.ciscGi1/0/15 180 B,T 0016C898B6AB:P1

Total entries displayed: 3
Here is an excerpt of the detailed view:
cat3750x# show lldp neighbors detail
------------------------------------------------
Local Intf: Gi1/0/13
Chassis id: 6886.a7ca.fee0
Port id: Gi0
Port Description: GigabitEthernet0
System Name: ap1602.cts.local
System Description:
Cisco IOS Software, C1600 Software (AP1G2-K9W8-M), Version 15.3(3)JF4, RELEASE SOFTWARE (fc1)
Technical Support: http://www.cisco.com/techsupport
Copyright (c) 1986-2017 by Cisco Systems, Inc.
Compiled Sat 09-Dec-17 17:54 by prod_rel_team
Time remaining: 106 seconds
System Capabilities: B
Enabled Capabilities: B
Management Addresses:
IP: 10.1.10.100
Auto Negotiation - supported, enabled
Physical media capabilities:
1000baseT(FD)
1000baseT(HD)
100base-TX(FD)
100base-TX(HD)
10base-T(FD)
10base-T(HD)
Media Attachment Unit type: 30
Vlan ID: - not advertised
------------------------------------------------
Local Intf: Gi1/0/24
Chassis id: 000b.45b2.47c0
Port id: Gi2/47
Port Description: GigabitEthernet2/47
System Name: cat6503.cts.local
System Description:
Cisco IOS Software, s72033_rp Software (s72033_rp-ADVIPSERVICESK9_WAN-M), Versio
n 12.2(33)SXJ2, RELEASE SOFTWARE (fc4)
Technical Support: http://www.cisco.com/techsupport
Copyright (c) 1986-2011 by Cisco Systems, Inc.
Compiled Wed 14-Dec-11 19:51 by prod_
Time remaining: 112 seconds
System Capabilities: B,R
Enabled Capabilities: B,R
Management Addresses:
IP: 10.1.50.1
Auto Negotiation - supported, enabled
Physical media capabilities:
1000baseT(FD)
100base-TX(FD)
100base-TX(HD)
10base-T(FD)
10base-T(HD)
Media Attachment Unit type: 30
Vlan ID: - not advertised
----<snip>----
Total entries displayed: 3
Step 6 Enable the switch to snoop DHCP. Enter the following commands in global configuration mode to enable DHCP Snooping on select access VLANs:
cat3750x(config)# ip dhcp snooping
cat3750x(config)# ip dhcp snooping vlan <VLANs>
At a minimum, access VLANs that connect endpoints to be profiled should be included in the list. It is important to have connectivity between the endpoint and DHCP server on the configured VLANs. DHCP Snooping needs a complete DHCP flow to propagate the information to device-sensor.
Step 7 To trust DHCP information that is sent from an interface connected directly or indirectly to a trusted DHCP server, use the following interface configuration command:
cat3750x(config)# interface <interface_to_DHCP_Server>
cat3750x(config-if)# ip dhcp snooping trust
Step 8 Verify DHCP Snooping is enabled on the switch using the show ip dhcp snooping command, as shown:
cat3750x# show ip dhcp snooping

Switch DHCP snooping is enabled
DHCP snooping is configured on following VLANs:
10-14
DHCP snooping is operational on following VLANs:
10-14
Smartlog is configured on following VLANs:
none
Smartlog is operational on following VLANs:
none
DHCP snooping is configured on the following L3 Interfaces:
Insertion of option 82 is enabled
circuit-id default format: vlan-mod-port
remote-id: 1cdf.0f8f.6000 (MAC)
Option 82 on untrusted port is not allowed
Verification of hwaddr field is enabled
Verification of giaddr field is enabled
DHCP snooping trust/rate is configured on the following Interfaces:
Interface Trusted Allow option Rate limit (pps)
----------------------- ------- ------------ ----------------
Step 9 Verify DHCP Snooping is working (binding tables are created for DHCP clients) on the switch using the show ip dhcp snooping binding command as shown:
cat3750x# show ip dhcp snooping binding

MacAddress IpAddress Lease(sec) Type VLAN Interface
------------------ --------------- ---------- ------------- ---- ---------------------
00:30:94:C4:52:8A 10.1.13.100 691187 dhcp-snooping 13 GigabitEthernet1/0/1
00:50:56:A0:0B:3A 10.1.10.100 653260 dhcp-snooping 10 GigabitEthernet1/0/1
C4:71:FE:34:19:7A 10.1.14.100 653068 dhcp-snooping 14 GigabitEthernet1/0/2
Total number of bindings: 3
Step 10 Save your changes to the switch configuration.
Procedure 72 Configure Device Sensor on Cisco Wired Switches
Step 11 Define filters that select CDP, LLDP, or DHCP attributes to be included or excluded from data collection.
a.Define a filter for CDP attributes starting in global configuration mode:
cat3750x(config)# device-sensor filter-list cdp list <my_cdp_list>

cat3750x(config-sensor-cdplist)# tlv name device-name

cat3750x(config-sensor-cdplist)# tlv name address-type

cat3750x(config-sensor-cdplist)# tlv name capabilities-type

cat3750x(config-sensor-cdplist)# tlv name platform-type

cat3750x(config)# device-sensor filter-spec cdp include list <my_cdp_list>
CDP TLV values can be entered by name or by number. Table 7 displays a list of CDP TLV names and corresponding descriptions available from the Cisco Catalyst 3750-X Series Switch console interface.
| CDP TLV Name | CDP TLV Description |
| address-type | Address Type |
| capabilities-type | Capabilities Type |
| cos-type | COS Type |
| device-name | Device Name |
| duplex-type | Duplex Type |
| external-port-id-type | External Port Id Type |
| ipprefix-type | IP Prefix Type |
| mgmt-address-type | Management Address Type |
| mtu-type | MTU Type |
| native-vlan-type | Native VLAN Type |
| platform-type | Platform Type |
| port-id-type | Port Id type |
| power-available-type | Power Available Type |
| power-request-type | External Port Id Type |
| power-type | Power Type |
| protocol-hello-type | Protocol Hello Type |
| trigger-type | Trigger Type |
| trust-type | Trust Type |
| twoway-connectivity-type | Twoway Connectivity Type |
| unidirectional-mode-type | Unidirectional Mode Type |
| version-type | Version Type |
| vtp-mgmt-domain-type | VTP Management Domain Type |
| vvid-type | VVID Type |
b.Define a filter for LLDP attributes starting in global configuration mode, as follows:
cat3750x(config)# device-sensor filter-list lldp list <my_lldp_list>

cat3750x(config-sensor-lldplist)# tlv name system-name

cat3750x(config-sensor-lldplist)# tlv name system-description

cat3750x(config)# device-sensor filter-spec lldp include list <my_lldp_list>
LLDP TLV values can be entered by name or number. Table 8 displays a list of Device Sensor LLDP TLV Names and Descriptions available from the Cisco Catalyst 3750-X Series Switch console interface.
| LLDP Name | LLDP Description |
| chassis-id | Chassis Chassis Id |
| end-of-lldpdu | End Of LLDP |
| management-address | Management Address |
| port-description | Port Description |
| port-id | Port Id |
| system-capabilities | System Capabilities |
| system-description | System Description |
| system-name | System Name |
| time-to-live | Time To Live |
d.Define a filter for DHCP attributes starting in global configuration mode, as follows:
cat3750x(config)# device-sensor filter-list dhcp list my_dhcp_list
cat3750x(config-sensor-dhcplist)# option name host-name
cat3750x(config-sensor-dhcplist)# option name default-ip-ttl
cat3750x(config-sensor-dhcplist)# option name requested-address
cat3750x(config-sensor-dhcplist)# option name parameter-request-list
cat3750x(config-sensor-dhcplist)# option name class-identifier
cat3750x(config-sensor-dhcplist)# option name client-identifier
cat3750x(config)# device-sensor filter-spec dhcp include list my_dhcp_list
DHCP options can be entered by name or number. Table 9 displays a list of Device Sensor DHCP Option Names and Descriptions available from the Cisco Catalyst 3750-X Series Switch console interface.
| DHCP Option Name | DHCP Option Description |
| class-identifier | Class Identifier |
| client-fqdn | Client FQDN |
| client-identifier | Client Identifier |
| default-ip-ttl | Default IP Time To Live |
| domain-name | Domain Name |
| host-name | Host Name |
| server-identifier | Server ID |
| user-class-id | User Class ID |
Cisco Best Practice: The sample filters shown for CDP, LLDP, and DHCP provide reasonable selections for most use cases. To understand which attributes are available, use the show commands for CDP and LLDP to view which TLVs the endpoints in the network present and determine if any specific attributes will assist in uniquely classifying the endpoint. Device Sensor can also be deployed initially without filters to see which attributes are presented to ISE under Work Centers > Profiler > Endpoint Classification. Appropriate filters can be applied based on those determined to be required to match profiling conditions of customer endpoints.
| ⓘ | Note: Entering a specific TLV or option value does not mean that this information is being transmitted by the endpoint. Filters are applied based on the attributes that the endpoint presents to switch or network. For example, if DHCP option client-fqdn is selected for inclusion by the filter, but that option is not requested by DHCP client, no information on that option will be available to Device Sensor or ISE. |
Step 12 Enable sensor data to be sent in RADIUS accounting, including all changes, as follows:
cat3750x(config)# device-sensor accounting
cat3750x(config)# device-sensor notify all-changes
| ⓘ | Note: In newer IOS-XE releases, such as 16.3.x and above, replace device-sensor accounting with the following: |
In scenarios where a workstation and phone are connected to a single switchport with multi-domain mode and the phone has not been onboarded to the network, you want to place the phone in the voice VLAN as soon as possible to avoid a violation condition caused by two devices connected to the data VLAN. For this specific scenario, use the command below to allow the switch to send the device sensor collected data in the authentication phase rather than waiting for the accounting phase:
access-session authentication attributes filter-spec include list Def_Acct_List
Step 13 Disable local analyzer to prevent duplicate updates from being sent to ISE:
cat3750x(config)# no macro auto monitor
cat3750x(config)# access-session template monitor
The embedded Device Classifier is enabled by default on Cisco switches, which programmatically enables Device Sensor. Therefore, Device Sensor is also enabled by default. When RADIUS authentication and accounting are enabled to send sensor data to ISE, a duplicate RADIUS accounting packet may be sent for each TLV change. This is due to the session monitoring by the local analyzer. To prevent duplicate accounting messages, the local analyzer must be disabled.
| Note: Be sure to check the documentation for your particular platform and version as behavior may differ. |
If RADIUS authentication is disabled (for example, in networks that are in a pre-ISE deployment/discovery phase), no sensor data will be sent if local analyzer disabled. To allow sensor data to be sent independent of the local analyzer, use the command access-session template monitor.
Step 14 Configure the switch to send session accounting information to ISE using RADIUS accounting.
If RADIUS authentication and authorization have already been configured, this step should already be complete. Refer to the section Configuring the RADIUS Probe for additional details on configuring the switch for RADIUS communication with ISE.
If RADIUS/802.1X has not yet been deployed, be sure to include the following commands in the switch configuration:
cat3750x(config)# aaa new-model
cat3750x(config)# aaa accounting dot1x default start-stop group radius
cat3750x(config)# radius-server host <PSN_ip> auth-port <port> acct-port <port> key <shared-secret>
cat3750x(config)# radius-server vsa send accounting
Step 15 Verify that the Device Sensor is collecting profiling information.
Use the command show device-sensor cache, as follows, to verify that the Device Sensor is working properly:
cat3750x# show device-sensor cache all
Device: 0050.56a0.0b3a on port GigabitEthernet1/0/1
--------------------------------------------------
Proto Type:Name Len Value
dhcp 55:parameter-request-list 14 37 0C 01 0F 03 06 2C 2E 2F 1F 21 79 F9 2B
dhcp 60:class-identifier 10 3C 08 4D 53 46 54 20 35 2E 30
dhcp 12:host-name 9 0C 07 77 69 6E 37 2D 70 63
dhcp 50:requested-address 6 32 04 0A 01 0A 64
dhcp 61:client-identifier 9 3D 07 01 00 50 56 A0 0B 3A
Device: 0012.d9e3.427e on port GigabitEthernet1/0/24
--------------------------------------------------
Proto Type:Name Len Value
cdp 4:capabilities-type 8 00 04 00 08 00 00 00 29
cdp 2:address-type 17 00 02 00 11 00 00 00 01 01 01 CC 00 04 0A 01 32 01
cdp 6:platform-type 18 00 06 00 12 63 69 73 63 6F 20 57 53 2D 43 36 35 30 33
cdp 1:device-name 21 00 01 00 15 63 61 74 36 35 30 33 2E 63 74 73 2E
6C 6F 63 61 6C
Device: c471.fe34.197a on port GigabitEthernet1/0/2
--------------------------------------------------
Proto Type:Name Len Value
cdp 4:capabilities-type 8 00 04 00 08 00 00 00 02
cdp 2:address-type 17 00 02 00 11 00 00 00 01 01 01 CC 00 04 0A 01 0E 64
cdp 6:platform-type 30 00 06 00 1E 63 69 73 63 6F 20 41 49 52 2D 4C 41
50 31 31 34 32 4E 2D 41 2D 4B 39 20 20 20
cdp 1:device-name 20 00 01 00 14 41 50 63 34 37 31 2E 66 65 33 34 2E 31 39 37 61
dhcp 50:requested-address 6 32 04 0A 01 0E 64
dhcp 60:class-identifier 16 3C 0E 43 69 73 63 6F 20 41 50 20 63 31 31 34 30
dhcp 55:parameter-request-list 10 37 08 01 06 0F 2C 03 21 96 2B
dhcp 12:host-name 18 0C 10 41 50 63 34 37 31 2E 66 65 33 34 2E 31 39 37 61
dhcp 61:client-identifier 9 3D 07 01 C4 71 FE 34 19 7A
Device: 0030.94c4.528a on port GigabitEthernet1/0/1
--------------------------------------------------
Proto Type:Name Len Value
cdp 2:address-type 17 00 02 00 11 00 00 00 01 01 01 CC 00 04 0A 01 0D 64
cdp 6:platform-type 23 00 06 00 17 43 69 73 63 6F 20 49 50 20 50 68 6F
6E 65 20 37 39 36 30
cdp 4:capabilities-type 8 00 04 00 08 00 00 04 90
cdp 1:device-name 19 00 01 00 13 53 45 50 30 30 33 30 39 34 43 34 35 32 38 41
dhcp 50:requested-address 6 32 04 0A 01 0D 64
dhcp 55:parameter-request-list 9 37 07 01 42 06 03 0F 96 23
dhcp 60:class-identifier 39 3C 25 43 69 73 63 6F 20 53 79 73 74 65 6D 73 2C
20 49 6E 63 2E 20 49 50 20 50 68 6F 6E 65 20 43
50 2D 37 39 36 30 00
dhcp 12:host-name 18 0C 10 53 45 50 30 30 33 30 39 34 43 34 35 32 38 41 00
dhcp 61:client-identifier 9 3D 07 01 00 30 94 C4 52 8A
Procedure 73 Configure Device Sensor on Cisco Wireless Controllers
Device Sensor for DHCP on supported wireless controllers can be enabled using the CLI or web administrative interface.
Step 1 To configure Device Sensor on the Cisco Wireless Controller via the CLI, enter the following command:
> config wlan profiling radius enable <wlan-id>
Device Sensor is enabled for all wireless clients on the specified WLAN.
Step 2 Configure the wireless controller to send session accounting information to ISE using RADIUS accounting. If RADIUS authentication and authorization have already been configured, this step should already be complete.
Refer to the section Configuring the RADIUS Probe for additional details on configuring the wireless controller for RADIUS communication with ISE.
Step 3 From the WLC web interface, go to WLANs > (WLAN-id) > Edit. The screen display in Figure 104 shows where to enable Device Sensor.
| ⓘ | Note: Be careful not to confuse the Local Client Profiling (the internal, local classifier function) with Radius Client Profiling (Device Sensor function). |
Procedure 74 Verify Profiling using Device Sensor
Step 1 Go to the ISE Policy Administration node and navigate to Work Centers > Profiler > Endpoint Classification.
Step 2 Note the MAC address of target endpoint for testing and delete the endpoint.
Step 3 Disconnect and then reconnect the endpoint from the access device configured for Device Sensor.
Step 4 Under Work Centers > Profiler > Endpoint Classification, find and select the MAC address of the newly connected endpoint and then select the Attributes sub-menu to display the attributes captured using Device Sensor (Figure 105).
In Figure 105, only the RADIUS probe is enabled on the ISE Policy Service node. Key attributes highlighted include:
- EndPointPolicy
- EndPointSource
- OUI
- CDP attributes (cdpCacheAddressType, cdpCacheCapabilities, cdpCacheId, cdpCachePlatform)
- DHCP attributes (dhcp-class-identifier, dhcp-client-identitifier, dhcp-parameter-request-list, dhcp-requested-address, host-name)
Using Device Sensor alone with only the RADIUS probe (EndPointSource = RADIUS Probe), we can see that EndPointPolicy is correctly matched to Cisco-IP-Phone-7960. The profiling attributes received from Device Sensor that contributed to the profile match include OUI = Cisco Systems, Inc., cdpCachePlatform = Cisco IP Phone 7960, and dhcp-class-identifier = Cisco Systems, Inc, IP Phone CP-7960.
Note that the CDP and DHCP attributes include only those specified by the filter, which shows how data collection is optimized. The Policy Service node was not required to parse and synchronize unneeded attributes across all Administration and Policy Service nodes in the ISE deployment. Based on the Device Sensor configuration, updates are received only when changes occur. SNMP Query and DHCP Probes, on the other hand, will update attributes upon each query or DHCP renewal.
Cisco Best Practice: Deploy ISE Profiling using Device Sensor when possible to greatly increase scalability and simplify overall management and profiling configuration. Device Sensor can be deployed across wired access switches and wireless controllers for both RADIUS-authenticated environments and other types of deployments such as a pre-ISE discovery phase.
Configuring Profiling Policies
Profiling Policy Configuration Overview
Earlier in this guide, we introduced the high-level architecture of ISE Profiling Services, as shown in Figure 106. This can also serve as a general guideline for ISE Profiling configuration and overall process flow.
We just completed the first component in the flow—namely configuration of probes to collect endpoint attributes. In this section, we will continue through the remaining components to configure Profiling Policy and Authorization Policy to support customer profiling requirements.
Profiling Conditions
Many profiling attributes can be collected by various ISE probes. Once attributes are collected by the ISE Policy Service nodes, the next step in the profiling process is to match these attributes to Profiling Conditions (Figure 107). Each condition represents a match to a supported attribute listed in the System Dictionary under Work Centers > Profiler > Dictionaries.
Dictionary Attributes
The System Dictionary can be found under Work Centers > Profiler > Dictionaries. These attributes are selectable when profiling conditions are created or modified under Work Centers > Profiler > Policy Elements > Profiler Conditions. Table 10 presents the attributes available for Profiler Conditions. In the case of RADIUS, only a subset has been exposed based on their relevance to profiling.
| Protocol | Attributes |
| DHCP | boot-file client-fqdn client-identifier device-class dhcp-class-identifier dhcp-client-identifier dhcp-message-type dhcp-parameter-request-list dhcp-requested-address dhcp-user-class-id dhcpv6-client-identifier dhcpv6-ia-na dhcpv6-ia-ta dhcpv6-interface-id dhcpv6-server-identifier dhcpv6-user-class dhcpv6-vendor-class dhcpv6-vendor-opts domain-name host-name name-servers pxe-client-arch pxe-client-machine-id pxe-client-network-id server-identifier vendor-class |
| MAC | MACAddress OUI |
| SNMP | cafSessionAuthorizedBy cafSessionAuthUserName cafSessionAuthVlan cafSessionClientMacAddress cafSessionDomain cafSessionStatus cLApIfMacAddress cLApName cLApNameServerAddress cLApNameServerAddressType cLApSshEnable cLApSysMacAddress cLApTelnetEnable cLApTertiaryControllerAddress cLApTertiaryControllerAddressType cLApUpTime cLApWipsEnable cldcAssociationMode cldcClientAccessVLAN cldcClientIPAddress cldcClientStatus dot1xAuthAuthControlledPortControl dot1xAuthAuthControlledPortStatus dot1xAuthSessionUserName hrDeviceDescr hrDeviceStatus ifDescr ifIndex ifOperStatus port portIfIndex sysContact sysDescr sysLocation sysName sysObjectID Vlan VlanName vlanPortVlan vtpVlanIfIndex vtpVlanName vtpVlanState |
| IP | EndpointSource FQDN Host ip ipv6 mask operating-system-result PortalUser User-Agent |
| RADIUS | Acct-Input-Gigawords Acct-Output-Gigawords Called-Station-ID Calling-Station-ID Chargeable-User-Identity Connect-Info Delegated-IPv6-Prefix Delegated-IPv6-Prefix-Pool Device-Type DNS-Server-IPv6-Address Egress-VLAN-Name Egress-VLANID Framed-Interface-Id Framed-IP-Address Framed-IP-Netmask Framed-IPv6-Address Framed-IPv6-Pool Framed-IPv6-Prefix Framed-IPv6-Route Framed-Pool Location Location-Capable Login-IPv6-Host NAS-Filter-Rule NAS-Identifier NAS-IP-Address NAS-IPv6-Address NAS-Port NAS-Port-Id NAS-Port-Type Route-IPv6-Information Service-Type Stateful-IPv6-Address-Pool User-Name VendorSpecific |
| NetFlow | agg_version aggregation CLASS_ID count DIRECTION dOctets dPkts dst_as DST_MAC DST_MASK DST_TOS DST_VLAN dstaddr dstport engine_id engine_type first FIRST_SWITCHED FLOW_SAMPLER_ID flow_sequence FLOWS FragmentOffset ICMP_TYPE IN_BYTES IN_PKTS input INPUT_SNMP IP_PROTOCOL_VERSION IPV4_DST_ADDR IPV4_IDENT IPV4_NEXT_HOP IPV4_SRC_ADDR IPV6_DST_ADDR IPV6_DST_MASK IPV6_FLOW_LABEL IPV6_SRC_ADDR IPV6_SRC_MASK L4_DST_PORT L4_SRC_PORT last LAST_SWITCHED MAX_PKT_LNGTH MAX_TTL MIN_PKT_LNGTH MIN_TTL nexthop OUT_BYTES OUT_PKTS output OUTPUT_SNMP prot PROTOCOL sampling_interval source_id src_as SRC_MAC SRC_MASK SRC_TOS SRC_VLAN srcaddr srcport sys_uptime tcp_flag TCP_FLAGS TOS TOTAL_BYTES_EXP TOTAL_FLOWS_EXP TOTAL_PKTS_EXP unix_nsecs unix_secs version |
| CDP | cdpCacheAddress cdpCacheCapabilities cdpCacheDeviceId cdpCachePlatform cdpCacheVersion |
| LLDP | lldpCacheCapabilities lldpCapabilitiesMapSupported lldpChassisId lldpManAddress lldpPortDescription lldpPortId lldpSystemCapabilitiesMapEnabled lldpSystemDescription lldpSystemName lldpTimeToLive |
| NMAP | 110-tcp 123-udp 135-tcp 135-udp 137-udp 138-udp 139-tcp 139-udp 143-tcp 1434-udp 161-udp 162-udp 1900-udp 21-tcp 22-tcp 23-tcp 25-tcp 3306-tcp 3389-tcp 443-tcp 445-tcp 445-udp 500-udp 515-tcp 520-udp 53-tcp 53-udp 631-tcp 631-udp 67-udp 68-udp 80-tcp 8080-tcp 9100-tcp operating-system SMB.cpe SMB.domain SMB.fqdn SMB.lanmanager SMB.operating-system SMB.server SMB.workgroup |
| NMAP Extension | 8081-tcp <All Custom Ports> |
| Multimedia | H323DeviceName H323DeviceVendor H323DeviceVersion mdns_VSM_class_identifier mdns_VSM_srv_identifier mdns_VSM_txt_identifier sipDeviceName sipDeviceVendor sipDeviceVersion |
| ACIDEX | device-platform device-platform-version device-type |
| IOTAsset | assetDeviceType assetHwRevision assetId assetIpAddress assetMacAddress assetName assetProductId assetProtocol assetSerialNumber assetSwRevision assetVendor |
| ACTIVEDIRECTORY_PROBE | AD-Host-Exists AD-Join-Point AD-Operating-System AD-OS-Version AD-Service-Pack |
| CUSTOMATTRIBUTE | <All Custom Attributes> |
Note the following items as you review the dictionary attributes available for Profiler Conditions:
- The RADIUS Dictionary includes Network Device Group (NDG) Device Type and Location.
- The IP Dictionary holds the attributes from multiple probes and sources:
- DNS probe data (FQDN)
- HTTP probe data (User-Agent)
- System-calculated values for IP address (ip and ipv6) and mask
- System-calculated OS (operating-system-result)
- PortalUser (user account associated to the endpoint’s registration)
- EndPointSource
- New NMAP Custom Ports are automatically added to the NMAPExtension list.
- New Endpoint Custom Attributes are automatically added to the CUSTOMATTRIBUTE list.
- Not all listed attributes are collected when the Endpoint Attribute (Whitelist) Filter is enabled. To collect endpoint data for a dictionary attribute not in the Whitelist, either disable the filter (not recommended for production), or create a Profiler Condition based on the attribute and include that the new condition in one or more Profiling Policies (recommend approach).
Configuring Profiling Conditions
Cisco ISE comes packaged with an extensive list of prebuilt profiling conditions used to build the large library of profiles in the Profiling Policy. At times it may be necessary to create a new custom condition or modify an existing one to suit a particular set of endpoints and a specific environment.
To illustrate the process for creating a custom profiling condition, we will use a real-world example. Under Work Centers > Profiler > Endpoint Classification, there are a number of endpoints with the OUI = Cyber Switching Inc. and the Endpoint Profile = Unknown (Figure 108).
The sample entries in the figure all share the same MAC prefix value and consequently share the same OUI vendor name. Reviewing the Detailed Attributes from an Unknown Endpoint shows (Figure 109):
It is determined by direct inspection of the endpoint or simple deduction from the OUI (Cyber Switching Inc.) that these endpoints are Power Distribution Units (PDUs) used to manage power to critical networking assets. It is also discovered that these devices are manageable through SNMP as learned by the NMAP probe. (Note the presence of 161-udp = snmp-SNMPv1 server-public).
The EndPointSource = SNMPQuery Probe, even though the probe was disabled. This is due to the fact that the NMAP probe triggered the SNMP query (based on UDP port 161 being open) independent of the SNMP Query probe being enabled. You can also see other attributes related to the NMAP probe including LastNmapScanTime (date-time when last NMAP scan run against endpoint), NmapScanCount (the number of scans against this endpoint), NmapSubnetScanID (unique ID used to track the scanning event)
Since there are no default conditions or profiles in the ISE Profiler library for these endpoints, we will create them and ultimately build new policies to support all matching devices throughout the network.
Procedure 75 Configure a Custom (User-Defined) Profiler Condition
Step 1 Go to Work Centers > Profiler > Policy Elements and select Profiler Conditions from the LHS pane.
Scroll through the list of conditions to get an understanding of the common attributes used to create conditions such as OUI, dhcp-class-identifier, host-name, User-Agent, and SNMP MIB data such as cdpCachePlatform, lldpSystemDescription, and hrDeviceDescr.
Step 2 Click Add from the RHS pane.
a.In this example, the name Cyber-Switching-Device-OUI-Check1 is used to indicate the vendor and type of check.
b.Enter optional description—Power Automation and Control condition for Cyber Switching PDU devices based on OUI, in this example.
c.There are a number of categories under Type. For this check, the Type is MAC (Figure 110).
d.Attribute Name is OUI.
e.Operator is STARTSWITH.
f. Attribute Value is the vendor name assigned to the OUI. In this example, it is Cyber Switching.
| ⓘ | Note: Try to use correct case when specifying Attribute Value strings, but in general, string matches are not case sensitive. |
In the example given, many different operators and attribute values could have been used to provide a successful match. For example, an Operator of EQUALS with Attribute Value set to “Cyber Switching Inc.”, or else an Operator of MATCH with Attribute Value set to “^(normerel).*(systemes)$” could have been used to successfully match the OUI.
However, care must be taken to sufficiently match related devices without expanding the condition to match unrelated devices. For example, many vendor OUIs start with “Cyber”, but only one vendor OUI currently starts with “Cyber Switching”. It is common for vendors to produce product with slightly different registered OUIs.
In event that the OUI database lacks an entry for a particular MAC address prefix, it is possible to create a condition for the unknown OUI using the following settings:
- Type = MAC
- Attribute Name = MACAddress
- Operator = STARTSWITH
- Attribute Value = XX:XX:XX (3- or 4-byte prefix of the MAC address)
| ⓘ | Note: Based on the above suggestion to create a condition using MAC Address prefixes, one may ask “Why would I need to do this? I thought Cisco provided updated OUI files in its Feed Service.” While it is correct that Cisco updates the ISE OUI database via its Profiling Feed Service, there are a number of cases where manual MAC-based conditions may be required: · IEEE Registration Authority (RA) has deregistered the original vendor OUI · Interim measure before updating ISE with newly issued OUIs via Feed Service · Organization is using Locally Administered Addresses (LAA) whereby the default vendor MAC address of a device is modified to use a value managed by the organization · OUI is listed as IEEE Registration Authority or Private
|
Figure 111 shows the final form of the user-defined profile condition based on OUI.
Step 3 Click the Submit button (or Save for successive edits) to commit changes.
The above sample condition may be sufficient to detect and profile the Cyber Switching PDUs. However, the following steps will be used to illustrate how to create additional conditions that can serve to further classify the endpoint and increase the certainty of the device type. This example will leverage the fact that the endpoint SNMP query returned DUALCOM-S-16 under the sysDescr attribute. As it turns out, the vendor manufactures a line of PDUs under the name “Dualcom”. A more specific series is “Dualcom S” and “16” indicates the number of power outlets.
Step 4 Under Work Centers > Profiler > Policy Elements > Profiler Conditions, again click Add from the RHS pane.
a.In this example, the name Cyber-Switching-Dualcom-PDU-SNMP-sysDescr-Check1 is used to indicate the vendor, product model, and type of check.
| ⓘ | Note: The example uses a longer, descriptive name to help understand the use case and basis of the condition. Shorter, simpler names can be used, but the important guideline is to use names that will facilitate identification, tracking, and management across a list of hundreds of conditions. |
b.Enter optional Description—Power Automation and Control condition for Cyber Switching Dualcom PDU devices based on SNMP sysDescr, in this example.
c.Type is MAC.
d.Attribute Name is sysDescr.
e.Operator is STARTSWITH.
f. Attribute Value is the product series. In this example, it is Dualcom.
Figure 112 shows the final entries for the new Profiler Condition.
Step 5 Click the Submit button (or Save for successive edits) to commit changes.
In the example given, additional conditions can be created to match on specific product series (namely, Dualcom S), or the # of outlets (16), but only one condition will be used in this example to match any Dualcom PDUs from this vendor.
Procedure 76 Verify Configuration of a Custom Profiler Condition
To quickly view the new Profiler Conditions, click the Filter icon in the upper right corner of RHS pane. A search field will appear in each column to allow quick sorting and filtering on values entered as shown in Figure 113.
Filtering and sorting of Profiler Conditions can be based on Check Name, System Type, Expression, or Description. In the example shown in Figure 113, Check Name includes “Cyber” and System Type equals “Administrator Created”. For more advanced filtering logic, select Advanced Filter from the Show drop-down menu. Multiple advanced filter criteria can be defined and then saved for reuse.
Profiling Policies and Rules
A Profiling Policy, or profile, defines the policy rules that must match for an endpoint to be considered a profile match. The policy rules contain one or more conditions. If all the conditions of a rule are satisfied (using the AND operator), or if one condition of a rule is satisfied (using the OR operator), the specified action is taken. Figure 114 shows the Profiling Policy configuration flow.
Profiling Policy Rule Actions
The three supported Profiling Policy rule actions include:
- Certainty Factor Increases <X>
- Take Exception Action
- Take Network Scan Action
Certainty Factor (CF)
The simple Profiling Policy named Android is shown in Figure 115. This policy contains two rules. Each rule has a single condition that, if matched, takes the action Certainty Factor Increases 30. The CF is used to provide a general weighting, or relative level of certainty, that an endpoint is a proper match for the profile per the matched condition(s).
The Minimum Certainty Factor is set to 30 for the Android profile. Therefore, if either rule matches, the endpoint is a candidate to be assigned to this profile. Since an endpoint can match multiple conditions and consequently multiple profiles simultaneously, the cumulative CF value must be calculated per matching profile.
There are four Profiling Policy assignment criteria. The endpoint is assigned to a profile if all of the following conditions are met:
- The policy must be enabled. (Policy Enabled checkbox must be checked/enabled).
- Endpoint cumulative CF value for a profile meets the Minimum Certainty Factor.
- The CF rating for the profile is higher than any other profile where 1 and 2 are also true.
- The endpoint meets the Minimum CF for the parent profile (if profile is part of a hierarchy).
Per the first rule in the Android policy example shown in Figure 115 and Figure 116, if an endpoint’s User-Agent contains the string “Android”, its CF for this profile is increased to 30. If the endpoint matches the second rule (DHCP host-name value contains the string “android”), that will also increase its CF for this profile to 30. If it matches the conditions for both rules, its cumulative CF for this profile will be 60.
Even with a cumulative CF of 60, it is technically possible for the endpoint to match the conditions of another policy where the cumulative CF value is greater than 60. If all other conditions are met, the endpoint could be assigned to that profile even though it met all conditions for the Android policy. An endpoint will match the policy where its cumulative CF, or Total Certainty Factor (TCF), has the highest value.
| ⓘ | Note: There is currently no tie-breaker logic if an endpoint matches two different profiles with the same TCF. In such cases, it may be necessary to augment the CF for a specific rule to bias the selection of one profile over another. Furthermore, profiler logic first finds the highest match at the root level before calculating TCF at the sub-tree level. |
Typically, the CF values for predefined policies should be left at the default value. In some cases, it may be necessary to modify the default values to ensure certain policies take precedence over others based on network policy or preference. In that case, increase the CF value for the applicable rules in the preferred policy the minimal amount to achieve your desired profiling goals.
Similarly, if you are creating new profiles, set initial CF values to a relatively low setting, say 10 or 20, then monitor policy assignments to validate desired outcome. If the initial values are set too high, it may not be possible for other profiles with a potentially closer alignment to the actual endpoint to ever be applied based on CF calculation if the rules for one profile are set with inordinately high CF values relative to other policies.
For example, if an endpoint matches a single rule for custom Profile_A which increases CF to a value of 100, then the endpoint may never be assigned to Profile_B where it matches four rules that increase the CF by only 20 each. It is even possible that the rule in Profile_A is identical to a rule in Profile_B, but has disparate CF values assigned. Therefore, it is a general recommendation to use consistent CF ratings across policy rules.
Cisco Best Practice: As a general rule, it is recommended to keep the CF values at their default settings. If modification of default settings is required to ensure certain profile assignments take precedence, only increase the value of the rules in the preferred profile to minimal value to achieve the desired policy assignment.
If create custom profiles, it is a general best practice to set similar weightings (CF) to the same types of attributes. For example, CF of 10 for OUI match or CF of 20-30 for DHCP option matches. Maintaining a consistent logic for assigning weights will help maintain reasonable balance, facilitate new profile creation, and assist with troubleshooting. For profiles based on new attribute types, keep the initial values for CF relatively low, or commensurate with the weighting assigned to attributes of similar trustworthiness.
Exception and NMAP Actions
The two other possible actions for matching rules include Take Network Scan Action and Take Exception Action. Take Network Scan Action allows the Policy Service node to trigger an NMAP scan against the endpoint per the setting of the Network Scan (NMAP) Action field. This function is covered in greater detail in the section Profiling using Network Scan (NMAP) Probe.
Take Exception Action allows ISE to statically assign an endpoint to a policy based on the setting of the Exception Action field. This function is covered in greater detail in the Exception Actions section.
Both these actions can only be triggered if the endpoint matches the policy AND matches the specified condition. If the condition matches but the endpoint does not match the profile policy, action is not taken.
Also note that it is possible to match multiple rules in a policy such that multiple actions are taken. For example, it is possible to match a rule that increases the CF by 10 and match another rule such as Take Exception Action or Take Network Scan Action provided the policy is also matched.
Profiling Policy Hierarchy
The last criterion listed for matching a Profiling Policy is that the endpoint meets the minimum CF for the parent policy. This introduces the topic of hierarchy in the Profiling Policy. Unlike the Android profile which has Parent Policy set to NONE, as shown in the Figure 117, profiles such as the Apple-iPad and Apple-iPhone are child profiles with a parent profile of Apple-Device. To view the policy hierarchy, navigate to Work Centers > Profiler > Profiling Policies. Expand Profiling Policies from the LHS pane by clicking the right arrow symbol (►) before the label. This will reveal all of the first-level policies (Figure 117).
Right-arrows in front of specific entries indicate the presence of child policies for those profiles. Per the above graphic, the 2-Wire-Device policy has no children, whereas Apple-Device is a parent policy. Clicking the arrow reveals the child policies for Apple-Device.
The hierarchy is beneficial in organizing the display and management of policies. It also provides a method to define a set of common conditions for multiple child policies; matching a child policy implies a match to a parent without having to repeatedly define those higher-level conditions under the more granular rules.
A common use of the hierarchy is to match on OUI. For example, all Apple devices will have an OUI equal to Apple. Therefore, it is not necessary to repeat this condition for an iPad, iPod, iPhone, and so on. To match an Apple-iPhone profile requires that endpoint also have an Apple OUI. This is why use of the simple Firefox browser plugin named User Agent Switcher, which mimics other browser User-Agent strings alone, will not pass the profile conditions for an Apple iPhone. Without an Apple MAC address, the parent condition fails the test. As noted earlier in this guide, profiling is not positioned as an anti-spoofing solution, but there are features of the solution that naturally thwart certain spoof activity.
Procedure 77 Configure a Custom (User-Defined) Profiler Policy
In this procedure, a custom Profiler Policy will be created for the Cyber Switching PDU devices using the previously configured conditions.
Step 1 Go to Work Centers > Profiler > Profiling Policies and click Add from the menu of RHS pane. The Profiler Policy page appears (Figure 121).
Step 2 Complete the Profiler Policy form as follows:
a.Enter the profile Name as Cyber-Switching-Device. Names cannot contain spaces so dashes are used to separate words. The name must contain only alphanumeric, dashes, or underscore characters with a maximum length of 150.
b.Enter the optional Description. Example: Power Automation and Control policy for Cyber Switching devices.
c.Make sure policy is enabled and keep the Minimum Certainty Factor at its default value of 10.
d.Keep the default setting of NONE for Exception Action. A separate section of this guide covers the use of Exception Actions.
e.Change the Network Scan (NMAP) Action to SNMPPortsAndOS-scan. Often this setting is kept at the default value of NONE. However, in this example, we already know that the endpoint may be enabled for SNMP. If so, then this scan action will trigger an SNMP query to the device.
f. Keep the default setting of NONE for both Exception Action and Network Scan (NMAP) Action.
g.Under “Create an Identity Group for the policy”, select the radio button No, use existing Identity Group hierarchy instead of the default setting.
h.Keep the default setting of NONE and Global Settings for Parent Policy and Associated CoA Type, respectively.
i. Under the Rules section, click the plus (
j. Under Condition Name > Select Condition, select Cyber-Switching-Device-OUI-Check1. To quickly locate the desired condition, use the Search List field to filter conditions as shown in Figure 118.
| ⓘ | Note: In this Profiler Policy example, the Profiling Condition was created first as a separate task, and then selected from a list within the policy rule configuration. An equally valid option is to create the new condition from within the Profiling Policy itself using the option Create New Condition (Advance Option). Once created, the new condition would appear as a named condition in the policy rule. However, the condition defined inline is not visible under the Profiler Conditions page and is not accessible to other policies. |
k. Accept the default rule action Certainty Value Increases with the value of 10.
l. Add an additional rule to trigger an NMAP Scan Action by selecting the gear icon at the end of the first rule and choosing the option to Insert new rule above or Insert new rule below as shown in Figure 119. Either option is valid since rule order does not impact profiling; all rules will be evaluated.
m. Similar to process used to creation previous condition, click the plus (
n.Change the action (field after Then) from the default of Certainty Factor Increases to Take Network Scan Action as shown in Figure 120.
| ⓘ | Note: The condition used to trigger the NMAP Scan Action is the same condition used to match the profile. To execute an automated NMAP Scan Action, two criterions must be met:
1.The endpoint must match the profile policy where scan action is defined 2.The endpoint must satisfy the condition that triggers the scan action |
Figure 121 provides a Custom Profiler Policy example of the completed form.
Step 3 Click Submit to save changes, or Save to update changes to a previously saved policy.
Procedure 78 Configure a Custom (User-Defined) Profiler Policy – Child Profile
In this procedure, a second custom Profiler Policy will be created for the Cyber Switching PDU devices using the previously configured conditions. In this policy example, a new profile will be created as a child to the first “basic” profile. In order to match a child profile, the endpoint must match all parent policies.
Step 1 Go to Work Centers > Profiler > Profiling Policies and click Add from the menu of RHS pane. The Profiler Policy page appears (Figure 121).
Step 2 Complete the Profiler Policy form as follows:
a.Enter the profile Name as Cyber-Switching-Dualcom-PDU.
b.Enter the optional Description. Example: Power Automation and Control policy for Cyber Switching PDU devices.
c.Make sure the policy is Enabled.
d.Change the Minimum Certainty Factor from its default value of 10 to a value of 20.
e.Keep the default setting of NONE for both Exception Action and Network Scan (NMAP) Action. A separate section of this guide covers the use of Exception Actions.
f. Under “Create an Identity Group for the policy”, select the radio button No, use existing Identity Group hierarchy instead of the default setting.
g.Change the Parent Policy from the default of NONE to the profile created in the previous procedure, namely Cyber-Switching-Device. To jump to the desired profile, simply enter the first few characters of the profile name until it appears in the filtered.
h.Keep the default setting of Global Settings for Associated CoA Type.
i. Under the Rules section, click the plus (
j. Under Condition Name > Select Condition, select Cyber-Switching-Dualcom-PDU-SNMP-sysDescr-Check1.
k. For reference only: It is possible to have multiple conditions within a single Profiler Policy rule. After the first condition is added to the rule, use the gear icon to either Add Attribute/Value or Add Condition from Library, or else Delete the current condition. When two or more conditions are present in a rule, a new box appears to select the operator. Only one operator (AND/OR) can be applied to all conditions. Selecting AND means that all conditions must be met for the rule to match. Selecting OR means that any condition must be met for the rule to match. (Figure 122).
l. Keep the default rule action Certainty Value Increases, but change the value to 20.
Figure 123 provides an example of the completed form.
Step 3 Click Submit to save changes, or Save to update changes to an existing policy.
Procedure 79 Verify Custom Profiler Policies
Step 1 Go to Work Centers > Profiler > Profiling Policies.
Step 2 Use the Quick Filter in the upper right corner of the RHS pane to filter the list based on Profiling Policy Name (for example “Cyber-S”) and/or System Type of Administrator Created. The two newly created custom Profiling Policies should appear in the filtered list as shown in Figure 123.
| ⓘ | Note: Profiler Conditions and Policies can be one of three System Types:
If delete a Profiler Policy marked as Administrator Modified Cisco Provided, it will be replaced by the current Cisco Provided policy. |
Step 3 Verify the correct Parent-Child profile hierarchy by navigating to the Cyber-Switching policies in the LHS pane. The Cyber-Switching-Dualcom-PDU profile should appear as a subordinate to the Cyber-Switching-Device profile as shown in Figure 125.
Step 4 Verify the new profiles are working properly by returning to Work Centers > Profiler > Endpoint Classification. Filter the list by entering the OUI of the endpoints that originally appeared as Unknown (Cyber Switching Inc. in this example; Reference Figure 108: Unknown Endpoints Example). After creating the new profiles, the same endpoint list now appears as shown in Figure 126.
One endpoint is now profiled as Cyber-Switching-Device based on the basic OUI match. The other two endpoints matched the more specific profile Cyber-Switching-Dualcom-PDU based on the results of the triggered NMAP scan and a match on the SNMP sysDescr STARTSWITH Dualcom. (Reference Figure 109: Detailed Attributes from Unknown Endpoint Example)
Logical Profiles
Logical Profiles provide a method to group any number of profiles. Logical Profiles are typically used to simplify policy rules and visibility filters. The basis of the grouping can be arbitrary or based on common relationships such as “all mobile devices”, or all mobile devices of a certain type. Logical profiles can group endpoints that match a profile based on their function, location, governance, hardware platform, or operating system.
Endpoint Profiles can be a member of more than one Logical Profile, such that an endpoint that is profiled as an Amazon-Kindle could also be a member of a Logical Profile for “Android Devices”, another for “All e-Readers”, and yet another for “Education”.
ISE comes preconfigured with a number of Endpoint Profiles and Logical Profiles in its library for immediate use. Both types of profiles can be created, modified, or deleted to suit the particular deployment. Like Endpoint Profiles, Logical Profiles can be directly referenced in Authorization Policy Rule conditions and can drastically reduce the number of individual rule conditions needed to match many different device types with a common purpose or business function. For example, “If Logical_Profile = IP-Phones, then SGT = Voice and assign Voice-ACL permissions”. In this example, it was not necessary to match each and every type of vendor phone and model, but simply assign the individual profiles to the logical group and apply policy to the group.
Figure 127 highlights the phase in the profiling process where Logical Profiles may be considered to support Authorization Policy decisions.
Procedure 80 Configure a Logical Profile
In this procedure, a Logical Profile will be created for the Cyber Switching PDU devices to help organize devices used to manage and distribute power to the network infrastructure and other critical devices.
Step 1 Go to Work Centers > Profiler > Profiling Policies and then select Logical Profiles from the LHS pane. A list of current Logical Profiles appears in the RHS pane.
Step 2 Review the list of Logical Profiles. Like Profiler Policies, Logical Profiles are also classified as Cisco Provided, Administrator Created, and Administrator Modified. Select a Logical Profile such as IP-Phones and note how phone profiles for multiple models and from multiple vendors appear in the list of Assigned Policies. Any endpoint that matches any one of the Assigned Profiles will appear in the Endpoint in Logical Profile table.
Once finished with the review of existing Logical Profiles, click Logical Profiles from the LHS pane to return to the main list.
Step 3 Click Add from the menu in RHS pane. The Logical Profile configuration page appears (Figure 121).
a.Enter the Name as Power Management and Distribution
b.Enter an optional Description. For this example, use Logical Profile to group all devices providing power management and distribution.
c.Select from the list of Available Policies to populate the Assigned Policies. Add the following profiles by first selecting the profile from the Available Policies list and then clicking the 
- American-Power-Conversion-Device
- Cyber-Power-System-Device
- Cyber-Switching-Device
- Cyber-Switching-Dualcom-PDU
- TrippLite-Device
| ⓘ | Note: Multiple entries may be selected at once using the SHIFT key (contiguous entries) or the CTRL key (non-contiguous entries). As of the writing of this guide, there is no option to filter the list for selection or import Logical Profile entries. |
Figure 128 shows a Logical Profile Configuration sample of the completed form.
Step 4 Click Submit to commit the changes when finished.
Procedure 81 Verify Endpoints Match a Logical Profile
Step 1 Go to Work Centers > Profiler > Profiling Policies and then select Logical Profiles from the LHS pane.
Step 2 Select the newly created Logical Profile (Power Management and Distribution) from list on either LHS or RHS pane. Figure 129 shows sample output of the matching profiles and highlights the endpoints matching the newly created Profiler Policies.
Step 3 Go to Work Centers > Profiler > Endpoint Classification. Filter the list by entering the OUI of the endpoints that originally appeared as Unknown (Cyber Switching Inc. in this example; Reference Figure 108: Unknown Endpoints Example). The Logical Profile for these endpoints should now show Power Management and Distribution.
| ⓘ | Note: Multiple Logical Profile values may appear for a given endpoint based on its current Endpoint Profile policy, and that policy’s assignment to Logical Profiles. |
Endpoints grouped using Logical Profiles can now be viewed together as shown in Figure 129, as well as matched in policy conditions. Authorization Policy conditions based on Endpoint Profile, Logical Profile, and Endpoint Identity Group is covered later in this guide. Other policy tables such as Posture Policy and Client Provisioning can also leverage these conditions.
Profiles and Matching Endpoint Identity Groups
Original versions of Cisco ISE did not support the use of Endpoint Profile policies or Logical Profiles in Authorization Policy conditions. It was therefore necessary to map Endpoint Profiles to Endpoint Identity Groups before using it in an Authorization Policy Rule. This is no longer a requirement in current ISE versions, but you may still see references of policies based on the legacy Identity Groups created as a result of profiling.
Figure 131 highlights the phase in the profiling process where Endpoint Identity Groups may be considered to support Authorization Policy decisions.
Cisco Best Practice: The default setting in a new Profiler Policy is to create Matching Identity Groups. The general recommendation is to NOT create new Endpoint Identity Groups based on Endpoint Profiles. Endpoints can be a member of only one Endpoint Identity Group and different ISE services (for example, device registration in Hotspot, Guest and BYOD flows) may overwrite this group object. Therefore, to avoid conflicts with other ISE services and potential explosion of new Identity Groups, the best practice is to match policy conditions on the Endpoint Profile or a Logical Profile when a decision needs to be made based on device profile.
To map a Profiling Policy to an Endpoint Identity Group, select the radio button labeled Yes, create matching Identity Group. This is the default setting when creating a new Profiler Policy. Figure 132 is an example of a Profiler Policy provided by Cisco which uses this option.
Once enabled, ISE will create a new Endpoint Identity Group under the Profiled hierarchy. To view the Endpoint Identity Group hierarchy, go to Administration > Identity Management > Groups and click the arrow (►) to the left of Endpoint Identity Groups in the LHS pane to expand its contents as shown in Figure 133.
Static Versus Dynamic Endpoint Identity Groups
The most common Endpoint Identity Group in ISE is a Static Assignment. This is typically the result of adding endpoints to an Identity Group using the administrator interface, file import, or API. Endpoints can also become statically assigned by ISE services including device registration (Hotspot, CWA guest endpoint registration, BYOD, My Devices, Blacklisting, etc.).
An endpoint assigned to an Identity Group through profiling is a Dynamic Assignment. Static Assignments will override Dynamic Assignments. This is a key reason why the best practice is to match policy conditions directly to the Endpoint Profile or Logical Profile. Static Identity Group assignments do not impact Endpoint Profile or membership to Logical Profiles.
In the example shown in
Figure 133, Android is a dynamically created Endpoint Identity Group (highlighted in red). Changing the Profiler Policy setting to No, use existing Identity Group hierarchy will delete the dynamically-created Identity Group. Before changing this setting from “Yes” to “No”, always make sure there are no policies configured based on that Identity Group name!
The option to “use existing Identity Group hierarchy” will match the endpoint’s dynamic Identity Group assignment to the next highest Identity Group in the Profiling Policy hierarchy. In the Android example, then next highest parent in the hierarchy is “Profiled”.
Profiled and Unknown Identity Groups
The “Profiled” Identity Group is the default dynamic Identity Group assigned to profiled endpoints. “Profiled endpoints” are endpoints with some Profiler Policy match.
The “Unknown” Identity Group is the default dynamic Identity Group assigned to non-profiled endpoints. “Non-profiled endpoints” are endpoints that have yet to match any Profiler Policy. These default groups are highlighted in blue in
Figure 133.
Static Profiles Versus Dynamic Endpoint Profiles
Similar to the notion of Static and Dynamic Identity Group Assignments, it is also possible to have Static and Dynamic Endpoint Profile assignments. The profile that is the result of Profiler Policy rule matching is a Dynamic Profile Assignment. Under the endpoint’s detailed attribute list, the dynamic policy assignment is indicated by MatchedPolicy. If an endpoint has a static assignment, the MatchedPolicy may be different then the EndPointPolicy. The EndPointPolicy is the final Profiler Policy assignment. In the absence of static assignments, the EndPointPolicy = MatchedPolicy.
Figure 134 shows an example an endpoint with a static profile assignment of “Quarantined-Device”, but a dynamic profile assignment of “Linksys-Device”:
The final profile assignment of Quarantined-Device is listed at the top of the endpoint record (highlighted in orange).
The key values for Endpoint Policy and Identity Group are listed in the General Attributes section (highlighted in blue). You can quickly see that the endpoint has been statically assigned to the Endpoint Profile. It does not have a static assignment for Identity Group and has assumed the default dynamic group assignment of Profiled.
Some of the key attributes from the Other Attributes section are highlighted in red:
- EndPointPolicy = Quarantined-Device
- EndPointSource = GUI
- IdentityGroup = Profiled
- MatchedPolicy = Linksys-Device
- StaticAssignment = true
- StaticGroupAssignment = false
The static profile assignment was performed from the ISE administrator interface, so the EndPointSource is GUI. As called out in the General Attributes section, the EndpointPolicy is Quarantined-Device and the IdentityGroup is Profiled. The StaticAssignment attribute applies to the Endpoint Profile while StaticGroupAssignment applies to the Identity Group. The dynamically calculated Profiler Policy is the MatchedPolicy, namely Linksys-Device, and is different from the final policy.
Cisco Best Practice: Tools such as the Endpoint Analysis Tool (EAT) or the option to retrieve endpoint attributes from the ISE CLI can be used to compare the EndPointPolicy to the MatchedPolicy. This may help detect cases where a static assignment is not as intended. For example, a device that has been statically assigned to the Security-Badge-Readers policy is matching a dynamic policy of Windows10-Workstation, but the security readers are not based on Microsoft Windows. These tools are covered in a separate section of this guide.
Profiling and Authorization Policy
Authorization Policy defines the access permissions for endpoints that connect to the network based on matching rules. Authorization Policy rules specify the conditions that must be true for the endpoint before a specified permission is assigned. Three attributes that can be used to assign policy based on profiling results include:
- EndPoints:EndPointPolicy – The endpoint’s Profiler Policy assignment
- EndPoints:LogicalProfile – The logical group assignment that includes the EndPointPolicy
- IdentityGroup:Name – The name of matching Identity Group or matching parent Identity Group.
- EndPoints:<Custom_Attribute> - Custom attributes populated by the Profiler service.
Figure 135 highlights the Authorization Policy phase of the profiling configuration process.
As part of the overall flow, we started with probe configuration to collect endpoint data. This data is used to classify endpoints based on Profiler policies. The resulting Endpoint Profiles, Logical Profiles, and Identity Groups can then be leveraged in policy decisions. Although Authorization Policy is the primary focus here, other policy tables such as Posture and Client Provisioning can take advantage of these profiling results.
Custom Attributes are a special use case. They are not a profiling result, but can be populated through ISE Profiling Services, such as the pxGrid probe. It is possible to use these Custom Attributes in the creation of Profiler Policy used to classify endpoints, but it is also possible to reference the Custom Attribute values directly in ISE policy rules.
Using ISE Profiling Services to classify devices allows ISE to apply different policies to a non-authenticating endpoint such as a printer or IP phone using MAB, or to apply a different policy to an authenticated employee when connecting using a personal workstation versus a corporate workstation (Figure 136).
The sample Authorization Policy illustrates four examples of using profiling in policy conditions:
- Cisco IP Phones are matched against a default Logical Profile named IP-Phones.
- Employees (AD1:ExternalGroups = employees) connecting from Corporate Workstations are matched against a specific Endpoint Profile (Windows10-Workstation) and a Custom Attribute of the endpoint is checked to determine if it is a corporate asset (isManaged = true).
- Employees connecting from Personal Workstations are matched against the default Identity Group named Workstation that is based on the Profile Policy named Workstation (Create Matching Identity Group = Yes). The use of hierarchical policy allows all workstation types to match this policy regardless of profile match to a specific workstation platform.
Note that an alternative, preferred method would be to assign the workstation profiles to a Logical Profile to avoid potential conflicts with pre-existing Identity Group assignments. The use of the Identity Group named Workstation here is simply to illustrate its configuration as a method to match conditions based on profiler results.
The Authorization Policy also highlights the use of profiling to uniquely authorize users and non-user devices: Phones authenticated using MAB are authorized to access IP Phone networks; Employees who connect using a corporate/managed workstation are granted full access (Employee permissions) while those same employees connecting with a personal, unmanaged workstation are granted Internet-only access (Guest permissions).
Profile Transitions and Change of Authorization
Through the course of profiling, it is possible that an endpoint will transition from an Unknown profile to a specific profile (for example, Apple-iPad). The transition may occur in one update, but often the transition occurs in steps as new profile data is acquired from the network (for example, from Unknown to Apple-Device, and then from Apple-Device to Apple-iDevice, and finally to Apple-iPad). Although not as common, it is also possible for “negative” profiling data to be received for an endpoint that results in a transition from a more-specific profile to a less-specific parent profile, or a completely different profile altogether.
Regardless of the type of profile transition, a profile change may impact the Authorization Policy rule matched when the endpoint re-authenticates to the network. The challenge is how to affect a new authorization for an endpoint that is already authenticated and authorized to the network.
Figure 137 shows the configuration flow for profile transitions and Change of Authorization (CoA).
Change of Authorization (CoA)
CoA is a standards-based RADIUS feature (RFC 3576) that allows the RADIUS server (ISE) to initiate an unsolicited communication to the network access device (the RADIUS client) to update its access policy for an endpoint when certain state changes or policy changes occur. The update occurs without requiring that the endpoint initiate the reauthentication.
ISE Profiling Services initiate CoA based on Exception Actions—either Cisco-defined or user-defined.
Exception Actions
Exception Actions are the means by which ISE Profiling Services trigger a response to a profiling event or state change. By default, there are three predefined, nonconfigurable Exception Actions. Go to Work Centers > Profiler > Policy Elements > Exception Action to see the list of Exception Actions (Figure 138).
- AuthorizationChange sends a CoA when a profile transition results in a different authorization based on matching Authorization Policy rules.
- EndpointDelete sends a CoA when the endpoint is deleted or transitions from a Profiled profile to the Unknown profile (no Profiling Policy match).
- FirstTimeProfile generates a CoA when the endpoint transitions from the Unknown profile to a specific Profiling Policy assignment.
In addition to CoA, Exception Actions also have the ability to statically assign a new profile assignment to an endpoint. The system-defined Exception Actions do not change policy assignments; they only trigger CoA. Figure 139 shows the details for the AuthorizationChange Exception Action. Note that CoA will be forced but the Policy Assignment is set to NONE.
The default CoA Type sent for each of the system-defined Exception Actions is configured under global settings at Work Centers > Profiler > Settings > Profiler Settings (Figure 140).
Configuration of global profiling settings is covered in the Configure Global Profiling Settings section of this guide. The Port Bounce setting is reduced to the Reauth setting when multiple sessions are connected through the same switchport to minimize disruption to other sessions.
In addition to the global default behavior for Profiler CoA, it is also possible to configure the CoA type on a per profile basis. Each Profiler Policy allows a unique CoA type to apply to endpoints matching this profile—No CoA, Port Bounce, Reauth, and Global Settings. Global Settings is the default and instructs ISE to use the globally configured Profiler CoA setting. When explicitly set, per-profile CoA settings override global settings.
System-defined Exceptions Actions are not configurable and cannot be assigned as actions under the Profiling Policy. They are triggered automatically based on the defined transition. However, an administrator can define custom Exception Actions. These user-defined Exceptions can be used in a Profiling Policy to apply a static Profiling Policy assignment and specify if CoA is sent.
User-defined Exception Actions are appropriate for statically assigning endpoints to a preferred policy assignment once a specific condition is met and optionally for preventing a CoA being sent on policy assignment. An example use case would be a critical network device such as a process control endpoint in a manufacturing facility, or a networked medical device in a healthcare facility. In these examples, the administrator may want to statically assign the endpoint to a policy. A static assignment through exception can prevent the risk that spurious profile data reverts and endpoint’s profile and affects its network connectivity.
Procedure 82 Configure a Custom (User-Defined) Exception Action
In this procedure, an Exception Action is configured for a medical device to assign it to a static Profiling Policy once the specified conditions are matched. The example device is a Masimo SET Pulse Oximeter, a patient monitor that measures the oxygen levels in the blood. The profile used in this example was taken from the Cisco ISE Medical NAC Profile Library available on Cisco.com. Access to new and updated Profiling Policies is covered later in this guide.
| ⓘ | Note: Due to the inherent compliance factors involved with healthcare solutions, the goal of this example is strictly to illustrate the use of custom Exception Actions. It is not intended to validate the appropriateness of ISE Profiling Services as a method to secure network access for medical devices. |
Step 1 Go to Work Centers > Profiler > Profiling Policies. Assuming the Medical NAC Profile Library has been previously installed, select Masimo-SET-Pulse-Oximeter from the list. Remember that Quick and Advanced Filter can be used to quickly find profiles.
By default, this profile does not include a rule that references an Exception Action. Additionally, an Exception Action has not been defined (Figure 141).
Step 2 Create a new Exception Action.
a.Go to Work Centers > Profiler > Policy Elements.
b.Select Exception Actions from the LHS pane and then click Add from the menu in RHS pane.
c.Configure a new Exception Action using the values shown in Figure 142.
d.Click Submit to save the changes.
In this example, no additional CoA will be sent upon static policy assignment to the profile Masimo-SET-Pulse-Oximeter, the same profile viewed in the previous step.
Step 3 Return to the Profiler Policy for Masimo-SET-Pulse-Oximeter under Work Centers > Profiler > Profiling Policies and complete the following steps to define an Exception Action for the profile:
a.Set the Exception Action to Masimo-SET-Pulse-Oximeter.
b.Change the “Associated CoA Type” from the default setting of Global Settings to No CoA. Per-profile settings override global Profiler CoA settings.
c.Create a new rule with the identical conditions of the existing rule used to match the profile (Figure 143).
d.Change the action (Then) from default value, Certainty Factor Increases, to Take Exception Action. The resulting Profiler Policy should appear similar to the one in Figure 144.
Step 4 Save changes.
In this example policy, we have used the same criterion that was used to assign the policy to the endpoint to also statically assign the endpoint to the policy.
Procedure 83 Configure the Network Devices for CoA
Step 1 Configure a wired switch to support CoA. Use the aaa server radius dynamic-author command in global configuration mode as shown:
cat3750x(config)# aaa server radius dynamic-author
cat3750x(config-locsvr-da-radius)# client <ISE_PSN_IP_address> server-key <secret-key>
Add a separate client entry for each ISE Policy Service node (or load balancer Virtual IP address) that will communicate to the switch via RADIUS.
Step 2 Configure a wireless controller to support CoA.
a.Under the WLC web administration interface, go to Security > AAA > RADIUS > Authentication. Under the RADIUS Server definition, ensure Support for CoA (or Support for RFC 3576 in older releases) is enabled as shown in Figure 145.
b.Go to WLANs > (WLAN) > Edit > Advanced. For each WLAN to support CoA, set “Allow AAA Override” to Enabled and set the “NAC State” to ISE NAC (or RADIUS NAC in older AireOS releases), as shown in Figure 146.
Step 3 Save changes as appropriate for each platform.
Profiling Reports and Tools
This section provides an overview of the different resources available to monitor and troubleshoot ISE Profiling results. This section will also introduce invaluable tools to assist in the creation and tuning of ISE profiles. Some of the most useful resources include:
- Global Search
- Context Visibility
- Operational Reports
- Debug Logging
- CLI – Get All Endpoints
- Endpoint Analysis Tool (EAT)
Global Search
In the upper right corner of the ISE administrative interface is a magnifier icon that allows administrators to search for ISE endpoints and users by address or name. The input allows for partial data and the search engine will return all matching results as shown in Figure 147.
As illustrated in the example, a list of topics is presented based on the information collected about the device or user. The current profile is shown with key data points. If Click to view endpoint details >> for the specific endpoint entry, additional details are displayed as shown in Figure 148.
The results from the menu option Endpoint Details > Profiler are shown with the detailed profiling attributes learned about the endpoint. At the bottom right of each window is an option to Export Results in the form of text (.txt) or compressed (.zip) CSV file.
Cisco Best Practice: If Cisco or other support person requests the profiler or authentication details for an endpoint, the Export Results option under Global Search can provide a simple and comprehensive report without the need to take screen captures for the same.
Global Search provides an efficient method to quickly view profiling and other details information about device and users without navigating to a separate page or generating a special report.
Context Visibility
Context Visibility Services is one of the more popular landing pages for searching and viewing endpoint details and is the interface used throughout most of this guide when validating ISE Profiler results.
This guide has focused on the use of Work Centers and the specific page used is Work Centers > Profiler > Endpoint Classification. Additional views are available under the main Context Visibility menu. Figure 149 is an example of the Endpoint Classification view in Context Visibility.
Dashlets appear in the top half of the page which depict the top nine results (as a percentage of the total) in a circular chart. Each dashlet has submenus to view the chart results based on a different category. Simply clicking a slice in the ring will filter the table results in the bottom half of the page based on the selected subcategory. In the example, apple-iphone is highlighted. Upon clicking, only Apple iPhones will appear in the table.
The table columns can be rearranged by selecting a column header and using simple “drag and drop”. By default, the Quick Filter is displayed to allow quick entry of values to search within each column. The Advanced filter offer more complex filtering and also enabled custom filters to be saved for reuse.
The gear 
Although not present under Work Centers > Profiler, custom views can be defined under the main Context Visibility pages as shown in Figure 151. The red arrows highlight the additional menu items that present different views for endpoints, users, network devices, and applications.
A gear 
Cisco Best Practice: Changes are persistent for each admin user, but do not impact the default or customized views for other administrators. To ensure each ISE administrator has their own personalized views without impacting other administrators, create unique login accounts for each rather than share the same admin user account across multiple users
Table information for all or select endpoints can be exported using the Export option in the table menu. Note that the exportable attributes are limited to a subset of those available in Context Visibility tables and do not include raw profiling attributes. This section will cover other methods to extract these additional attributes from the ISE endpoint database.
Operational Reports
ISE provides a number of predefined reports for ISE services. Profiler-specific reports are available under Work Centers > Profiler > Reports. Select Reports > Profiler Reports from the LHS pane to view the list of common profiling reports. The most common reports used to verify profiling included Endpoint Profile Changes and Profiled Endpoints Summary.
Endpoint Profile Changes
The Endpoint Profile Changes Report provides a graphical depiction of before and after profiles as well as a list of all profile changes for the selected Time Range. Additional filters include Endpoint Profile, Endpoint ID, and ability to Show only changes due to Feed Services or Profile Changes (Figure 153)
In the above example, only updates in current day are selected for output. Since some profile changes do not always translate into an endpoint profile change, the filter to Show only Endpoints with changed profiles is also selected. Press Go to view the filtered table data as shown in Figure 154.
Clicking the Details 
Profiled Endpoints Summary
The Profiled Endpoints Summary Report lists all endpoints profiled in the selected time interval (Logged At) along with filters for Endpoint ID, Endpoint Profile, and Identity Group (Figure 155).
Clicking the Raw Log 

These reports can be most helpful to drill down on a specific endpoint and view profiling events for a specific time interval.
Debug Logging
Debug Logging is primarily used for troubleshooting purposes and not general reporting. It is enabled on a per-PSN basis to collect more details events locally on the node which can then be retrieved from the Primary PAN for analysis.
Procedure 84 Configure Profiler Debug Log Collection
Step 1 To initiate debug logging, go to Administration > System > Logging and select Debug Log Configuration from the LHS pane.
Step 2 Select the Policy Service Node (PSN) that is expected to collect the endpoint profile data from the list in the RHS pane. If multiple PSNs may be involved in profile data collection for the given endpoint(s), repeat this procedure for each participating PSN.
Step 3 Scroll down the list in the RHS pane and select Component Name profiler. Use the drop-down menu to select Log Level DEBUG, and be sure to commit change by clicking Save under the description (Figure 157).
Step 4 Run the operation that will trigger the profiling scenario of interest. When the operation is complete, be sure to set the Log Level back to INFO. You can also hit the Reset to Default link to reset log levels to factory default values.
| ⓘ | Note: Debug logging incurs a significant penalty in terms of ISE processor and disk resources. Therefore, it is critical to return log levels to their default settings after the necessary logs are captured to support the troubleshooting process. |
Procedure 85 Retrieve Profiler Debug Logs for Analysis
Once the debug logs have been captured, they must be retrieved for further analysis.
Step 1 Go to Operations > Troubleshoot > Download Logs and select the appropriate PSN from the LHS pane.
Step 2 Click Debug Logs from the menu in RHS pane and scroll down to Debug Log Type profiler.
Step 3 Profiler logs collected and batched over each day should appear in the list. Select profiler.log which is the most recent and active log for profiling events (Figure 158).
Step 4 Save the log file to a file system on your local computer. The file can be viewed using a standard text editor. The following is a short excerpt from a sample profiler.log debug file. The information is most commonly requested by Cisco’s Technical Assistance Center (TAC) for troubleshooting profiler issues.
2018-09-17 21:54:14,021 DEBUG [SNMPQueryEventHandler-25-thread-1][] cisco.profiler.probes.snmpquery.SNMPQueryEventHandler -:::- New query work is schedule for : 10.1.10.201
2018-09-17 21:54:14,021 DEBUG [forwarder-3][] cisco.profiler.infrastructure.probemgr.Forwarder -:5C:F9:38:DC:2F:4D:ProfilerCollection:- Processing endpoint:5C:F9:38:DC:2F:4D
2018-09-17 21:54:14,021 DEBUG [forwarder-3][] cisco.profiler.infrastructure.probemgr.Forwarder -:5C:F9:38:DC:2F:4D:ProfilerCollection:- Filtering:5C:F9:38:DC:2F:4D
2018-09-17 21:54:14,021 DEBUG [forwarder-3][] cisco.profiler.infrastructure.probemgr.Forwarder -:5C:F9:38:DC:2F:4D:ProfilerCollection:- Endpoint Attributes:
ID:null
Name:null
Attribute:BYODRegistration value:Unknown
Attribute:DeviceRegistrationStatus value:NotRegistered
Attribute:EndPointProfilerServer value:ise-psn3.company.com
Attribute:EndPointSource value:SNMPTrap Probe
Attribute:MACAddress value:5C:F9:38:DC:2F:4D
Attribute:MacStatus value:01
Attribute:NADAddress value:10.1.10.201
Attribute:NmapSubnetScanID value:0
Attribute:OUI value:Apple, Inc
Attribute:PolicyVersion value:0
Attribute:PortalUser value:
Attribute:Timestamp value:789867618
Attribute:Vlan value:8
Attribute:dot1dBasePort value:4
Attribute:SkipProfiling value:false
2018-09-17 21:54:14,022 DEBUG [forwarder-3][] cisco.profiler.infrastructure.cache.EndPointCache -:5C:F9:38:DC:2F:4D:ProfilerCollection:- Reading from DB end point with mac 5C:F9:38:DC:2F:4D
2018-09-17 21:54:14,024 DEBUG [forwarder-3][] cisco.profiler.infrastructure.cache.EndPointCache -:5C:F9:38:DC:2F:4D:ProfilerCollection:- Cannot find in DB end point with mac 5C:F9:38:DC:2F:4D
2018-09-17 21:54:14,025 DEBUG [forwarder-3][] cisco.profiler.infrastructure.cache.EndPointCache -:5C:F9:38:DC:2F:4D:ProfilerCollection:- Adding end point: mac - 5C:F9:38:DC:2F:4D
2018-09-17 21:54:14,026 DEBUG [forwarder-3][] profiler.infrastructure.probemgr.event.EndpointHandler -:5C:F9:38:DC:2F:4D:ProfilerCollection:- Adding to queue endpoint profiling event for mac: 5C:F9:38:DC:2F:4D EP 5C:F9:38:DC:2F:4D
2018-09-17 21:54:14,026 DEBUG [EndpointHandlerWorker-3-14-thread-1][] cisco.profiler.infrastructure.profiling.ProfilerManager -:5C:F9:38:DC:2F:4D:Profiling:- Classify hierarchy 5C:F9:38:DC:2F:4D
2018-09-17 21:54:14,044 DEBUG [EndpointHandlerWorker-3-14-thread-1][] cisco.profiler.infrastructure.profiling.ProfilerManager -:5C:F9:38:DC:2F:4D:Profiling:- Policy Apple-Device matched 5C:F9:38:DC:2F:4D (certainty 10)
2018-09-17 21:54:14,045 DEBUG [EndpointHandlerWorker-3-14-thread-1][] cisco.profiler.infrastructure.profiling.ProfilerManager -:5C:F9:38:DC:2F:4D:Profiling:- After analyzing policy hierarchy: Endpoint: 5C:F9:38:DC:2F:4D EndpointPolicy:Apple-Device for:10 ExceptionRuleMatched:false
2018-09-17 21:54:14,045 DEBUG [EndpointHandlerWorker-3-14-thread-1][] cisco.profiler.infrastructure.profiling.ProfilerManager -:5C:F9:38:DC:2F:4D:Profiling:- End point 5C:F9:38:DC:2F:4D got classified for the first time. Issuing a CoA
Step 5 Repeat the retrieval process for each PSN where debug logging was configured.
Procedure 86 Debug Logging for a Single Endpoint
Profiler troubleshooting often entails analysis of single endpoint, or a few endpoints representative of a broader issue. As seen in the previous two procedures, collection of profiler debug logs could involve multiple PSNs, making collection and retrieval more difficult and time consuming.
An alternative method is to perform Endpoint Debug Logging. This is a specific feature that allows all debug logs, not just profiler-related, to be collected for a given endpoint across all ISE PSNs. This simplifies collection across multiple nodes and can provide addition details that may be relevant to profiling.
Step 1 Go to Work Centers > Profiler > Troubleshoot and select EndPoint Debug from the LHS pane (Figure 159).
Step 2 Enter the MAC Address or IP address of the endpoint to be monitored. MAC address is generally preferred to ensure all events are captured independent of learning the IP address.
Step 3 Leave the default for Automatic disable after setting. This is a protective measure to ensure logging levels are returned to default levels across all PSNs for this specific troubleshooting event.
Step 4 Click Start to initiate the debug log collection process across all PSNs for the selected endpoint.
Step 5 Run through the steps needed to replicate the profiling issue for the selected endpoint. This may entail deleting the endpoint from ISE and reconnecting it to the network.
Step 6 Let the log capture run for one or two additional minutes after the steps are completed to ensure all relevant data is collected, and then click Stop.
Step 7 The new log file capture is added to the list along with file name, ISE server where log file is stored, date, and file size. Click the file name link, for example 00-16-c8-98-b6-ab, to download the debug log file.
An alternative and often useful method to trigger the endpoint debug process is directly from the ISE Authentication logs. Under Operations > RADIUS > Live Logs, select the icon next to the Endpoint ID of interest and select Endpoint Debug from the popup window as shown in Figure 160.
CLI – Get All Endpoints
Tools such as Global Search or Context Visibility are valuable to view the detailed attributes for a single endpoint, but are not very useful when you need to view the details across many endpoints at one time. Context Visibility allows export of endpoint data, but this is only a small subset of all data collected and does not include the raw profile attributes used to construct ISE Profiler Policies. Additionally, there are some attributes which are stored in the endpoint database record but not displayed in the ISE administrative interface.
Starting with ISE 2.0.1, it is possible to export all endpoint attributes to a comma separate value (CSV) file for further analysis using an option available from the ISE Command Line Interface (CLI). This option makes it possible to filter, sort, and search for endpoints that meet a specific criterion based on profile and other data. For example, find all endpoints where the MatchedPolicy = Unknown but have common traits to create new profiles. Tools such as Microsoft Excel make the manipulation of the data much easier to manage and spot useful patterns across numerous endpoints. By sorting on key attributes such as OUI, DHCP hostname, DHCP class-identifier, DHCP parameter-request-list, HTTP User-Agent, SNMP query results, and so on, it is then possible to determine the correlations needed to generate custom conditions and profiles.
Another advantage of this process is the discovery of attributes and patterns that are unique to a customer deployment. For example, DHCP host-name, RADIUS user-name, and DNS FQDN attributes are based on naming conventions which are often unique to a given organization. Therefore, generic profiles or profile policies that are valid in one deployment may not be relevant in another deployment with a completely different naming scheme. The ability to create profiles based on Custom Attributes is another example where the data retrieved from an asset management system or other external source may be customer specific.
Figure 161 shows a sample excerpt of this specialized ISE export function. Note that only a fraction of the available attributes is depicted in the sample report.
Procedure 87 Get All Endpoints
The method for extracting all of the endpoint attributes from ISE is made available from the ISE node’s CLI.
Step 1 Go to the console interface of the ISE Primary PAN.
Step 2 Enter application configure ise at the command prompt as shown in the example below.
ise-pan1/admin#
ise-pan1/admin# application configure ise
Selection configuration option
[1]Reset M&T Session Database
[2]Rebuild M&T Unusable Indexes
[3]Purge M&T Operational Data
[4]Reset M&T Database
[5]Refresh Database Statistics
[6]Display Profiler Statistics
[7]Export Internal CA Store
[8]Import Internal CA Store
[9]Create Missing Config Indexes
[10]Create Missing M&T Indexes
[11]Enable/Disable ACS Migration
[12]Generate Daily KPM Stats
[13]Generate KPM Stats for last 8 Weeks
[14]Enable/Disable Counter Attribute Collection
[15]View Admin Users
[16]Get all Endpoints
[17]Enable/Disable Wifi Setup
[18]Reset Config Wifi Setup
[19]Establish Trust with controller
[20]Reset Context Visibility
[21]Synchronize Context Visibility With Database
[22]Generate Heap Dump
[23]Generate Thread Dump
[24]Force Backup Cancellation
[0]Exit
16
Starting to generate All Endpoints report
Processing..........
Copying files to /localdisk
Completed generating All Endpoints report. You can find details in following files located under /localdisk
FullReport_31-Oct-2019.csv
Step 3 Select the option Get all Endpoints. Note that the actual number value corresponding to this command may differ across ISE versions.
Step 4 The report is generated and saved to the appliance’s local disk. Note the file name assigned to the report, FullReport_31-Oct-2019.csv in this example.
Step 5 Enter 0 to exit the utility.
Step 6 Use the dir command from the CLI to verify the files existence on the local disk.
Step 7 Copy the file to an external filesystem using one of the available options such as FTP, SCP, SFTP, or TFTP as shown in the example below.
ise-pan1/admin# copy disk:/FullReport_31-Oct-2019.csv ftp://10.1.100.100/
Username: ftp-username
Password: ftp-password
ise-pan1/admin#
The file is now ready for further review on the external filesystem.
Cisco Best Practice: Open the exported CSV file using a spreadsheet application (or else import into a database application for advanced manipulation). Once imported, rearrange the columns in an intuitive order and hide/delete extraneous columns that lack data or may offer little value in offline analysis. Use special colors or fonts for column headers to quickly identify attribute types and sources. Using a “Split View” can also help keep the headers and other critical data like MAC address static while scrolling through other rows and columns. Figure 162 illustrated one such example.
Once the data is optimized for viewing, leverage the spreadsheet tools to filter and sort on key attributes such as OUI, Endpoint Profile, DHCP options, FQDN, User-Agent, CDP/LLDP, AD data, Custom Attributes, and results from NMAP/SNMP scans. These tools can help call out critical patterns for tuning existing profiles or creating new ones. The Profiling Best Practices section can help with the selection of key attributes most useful to endpoint classification.
| ⓘ | Note: When cells for key profiling attributes lack data, it is possible that the probe is not applicable to the endpoint. For example, a statically addressed endpoint will not emit DHCP profiling data. However, empty values can be an indicator that probes are disabled, or that network devices and endpoints are not configured to support collection either due to omissions, misconfigurations, or connectivity issues. These endpoint reports can be invaluable in identifying gaps and misconfigurations in the end-to-end profiling configuration. |
Profile Updates
A large profile base is included with each ISE installation. However, the quantity and type of new devices that connect to the network is ever increasing. Consequently, the profiling system needs to be constantly updated to classify these never-before-seen endpoints when they first connect to the network and not require custom profiles for each and every new device. To help keep pace with the rapid proliferation of new devices, ISE offers a number of options to assist with the creation and maintenance of profiles. These options include:
- Cisco Profiler Feed Service
- Cisco Community Profiles
- EAT Public Profiles
- Export/Import of Custom Profiles
Cisco Profiler Feed Service
The Cisco Profiler Feed Service automates the delivery of new endpoint profiles and, just importantly, OUI updates.
OUI Updates
As explained earlier in this guide, the OUI, or Organizationally Unique Identifier, minimally includes the first three bytes of the MAC address. The IEEE is the authoritative body responsible for managing OUIs and assigning them to the manufacturer of networking interfaces. Manufacturers are responsible for assigning unique values to the remaining bytes of the MAC address. This ensures that no two MAC addresses connected to the network are the same, by default. As vendors build and ship new products, they may exhaust their existing allocations, and new vendors appear on the market that require their own OUI. The IEEE must allocate new OUIs to meet the demand. Once registered, the IEEE updates and publishes the current assignments.
In addition to maintaining new allocations, the IEEE periodically updates assignments and vendor names associated with address blocks as companies evolve and merge, separate, or cease. Consequently, there can be flux in both new assignments as well as existing assignments.
Ultimately, the manufacturer or associated vendor is a critical piece of knowledge in the profiling process. The MAC address is often the common data point learned for any network connected device. Although not a hard-fast rule, many devices can be identified by their MAC address alone. For example, a MAC address that matches a vendor OUI of “OTIS ELEVATOR COMPANY” is very likely an elevator or other device related to conveyance. Similarly, an endpoint with the OUI “Apple, Inc.” narrows down the types of devices. When combined with other attributes, the specific device platform can be determined.
The Cisco Profiler Feed Service provides two methods to obtain profile and OUI updates:
- Online Subscription Update
- Offline Manual Update
The Online Subscription provides scheduled and on-demand feed service updates directly from Cisco.com. This option requires that the active primary Administration node (PAN) has Internet access to the Cisco cloud service at ise.cisco.com.
The offline option makes Feed Updates available when Internet access is restricted due to highly-secured deployments or the need to conduct ISE lab testing, demos, or proof of concepts where Internet access is unavailable. In this scenario, the administrator downloads the feed update using a separate desktop computer with the necessary access to Cisco.com. Once downloaded, the administrator can either connect directly to the primary PAN, or else distribute the file to a desktop with access to the PAN.
Cisco Best Practice: Cisco supports both online and offline options to acquire profile and OUI updates from the Cisco Profile Feed Service. If the choice is to enable the online option, be sure to secure the connection from the ISE servers to the cloud service such a firewalls and secure DNS. ISE also supports proxy services to protect network connections initiated by the ISE servers.
The ISE Profiler Feed Service also provides a mechanism for customers and partners to submit new profiles to Cisco for review and incorporation into the feed service. Cisco profiles published by the Profiler Feed Service are fully tested and supported by Cisco.
Cisco Community Profiles
The Cisco Community is a forum for sharing information between Cisco and its network of partners and customers. It is through this network that Cisco and other community members post new profiles that can be downloaded and added to ISE.
While the Cisco Profiler Feed Service is the primary method to update profiles that are fully supported by Cisco, the Cisco Community offers a less formal method of sharing profiles. Not all profiles posted to the community are validated by Cisco and consequently are offered with best-effort support. The community profiles can also serve as a staging area to vet new profiles prior to incorporation into the Cisco Profiler Feed Service.
Another benefit of Cisco Community profiles is that it allows sharing of vertical-specific profiles that may not be of interest to all customers. For example, the Medical NAC Profile Library contains over 300 IoT healthcare-related profiles which may not apply to a financial customer. The Automation and Control Profile Library contains over 700 profiles related to IoT devices for manufacturing, building and home automation, finance and other verticals which may not apply to all customers. The higher the number of profiles, the higher the processing load to complete the profiling process. For customers with very large deployments containing hundreds of thousands of endpoints, the additional profiles can significantly contribute to the processing load and time to complete the profiling process.
| ⓘ | Note: As of the writing of this guide, ISE has a limit of 2000 profiles. This is not a hard limit, but the number that has been officially tested by Cisco. |
Once downloaded from the Community website, the profiles can be imported directly into ISE.
EAT Public Profiles
The Endpoint Analysis Tool (EAT) was discussed in the reporting section of this guide. The tool allows the user to create new profiles based on collected endpoint attributes. Profiles can be shared and Public Profiles (those created and posted by others) can be downloaded from EAT and imported into ISE.
Export/Import of Custom Profiles
Outside of the Cisco Feed Service, Cisco Community, and external tools, ISE offers the basic ability to export any new custom profiles created in one deployment and import them in a different deployment. This provides a simple method to share profiles with others with compatible ISE versions.
ISE Profiler Feed Version
Each profile has a version which indicates the minimum ISE version required to support the profile. As new probes and profiling features are added to ISE Profiler, it is possible to have profile conditions and policies that rely on these new capabilities to work. For example, profiles based on pxGrid probe attributes or Custom Attributes (features introduced in ISE 2.4) would not be applicable to earlier ISE versions. If unable to import a profile, it may be possible that there is a version mismatch.
Profiler Feed versions can be viewed by accessing the Offline Update Package from the ISE Feed Service portal at ise.cisco.com/partner. It is also possible to export and view the XML contents of profiler policies to see the version assigned to each policy. Figure 166 shows an excerpt from the contents of an Offline Feed Service package.
The Profiler Feed versions are highlighted and policies broken out into separate sections for each. Each profile will also show the profiler version. Table 12 maps the current Profiler Feed versions to minimum ISE versions.
|
Profiler Feed Version |
Minimum ISE Version |
| 1 | 1.2 |
| 2 | 1.3 |
| 3 | 2.1 |
| 4 | 2.7 Patch 3 / 3.0 |
| 5 | 3.3 |
| OUI updates | 1.2 |
Procedure 91 Update ISE Profiles Using the Online Feed Service
Step 1 Go to Work Centers > Profiler > Feeds and make sure Online Subscription Update tab is selected at the top of the form. Complete the form depicted in Figure 167 as follows:
a.Click the Test Feed Service Connection button and verify Test result displays Success.
b.If Failed, check the internet connection from the Primary PAN, firewall settings, proxy settings (as applicable), DNS configuration for ise.cisco.com, and potentially the certificates used to trust secure connections to Cisco cloud services.
c.If Success, continue with the steps.
d.Check Enable Online Subscription Update.
e.Verify the time and time zone for daily updates. Set a time that check and download updates during off-peak hours.
f. Optionally set a notification email address when updates occur. This option assumes that that SMTP has already been configured in ISE.
g.Optionally be a good Cisco citizen and enable the option to send anonymous data to Cisco. An administrator contact can also be added to the data. There are cases where it may be useful to have contact name on file in case Cisco needs to notify an administrator of Feed Service issues.
h.Click Save when finished making changes.
i. To trigger an on-demand update, click the Update Now button. Checks for new updates will automatically occur daily at the scheduled time.
j. Once the update is complete, the date and time of last update will appear at the bottom of the page.
To view the detailed event log for Feed updates, click Go to Update Report Page.
If updates resulted in undesirable changes to profiles and dependent policies, administrators have the option to roll back changes made by the last feed update by clicking Undo Latest.
Cisco Best Practice: While offering an automated and simple method to obtain new profiles and OUI updates, the general recommendation is to Disable automatic updates through the Online Subscription Update for an ISE deployment in production that relies on profiling for setting policy conditions.
During initial install or pre-production phase, the automated downloads will not present risk to the deployment. However, there is currently no mechanism to pre-approve Profiler Feed Service updates before they are applied. Both updates to OUIs and endpoint profiles resulting from the feed may have a direct impact on policy assignments (Example: Authorization Policy is based on profile matching generic device type, but feed update results in a more granular profile not currently captured by the policy conditions). Therefore, it is best to validate changes before they are applied to a production system. If no policies rely on profiling results, then the risk is minimized.
If possible, pre-deploy feed updates to a lab system that contains a current copy of the production configuration. Once changes have been validated in test system, it is then safe to apply the updates to production by temporarily enabling the online service and clicking Update Now, or applying the tested Feed version using the Offline Manual Update option. If online service temporarily enabled, be sure to disable after update completes.
If a lab/test server is not readily available, then recommendation is to apply the updates during off-peak hours and closely monitor profile changes (and policies based on those profiles) following the update. If issues are experienced, then corrective actions can be taken to minimize impact, or else invoke the Undo Latest option.
Whether using the Online Subscription Service or the Offline Manual Update option, the Feed Service portal should be leveraged to receive notification of when and which updates have occurred. This will assist in understanding the potential impact of any feed update.
Procedure 92 Update ISE Profiles Using Offline Manual Update
Be sure these steps are completed from a desktop computer with access to the Cisco cloud service at ise.partner.com/partner.
Step 1 Go to Work Centers > Profiler > Feeds and make sure Offline Manual Update tab is selected at the top of the form.
Step 2 Click Download Updated Profile Policies link. If this is the first time connecting to the Feed Portal, you are presented with a new browser tab or window as shown in Figure 168.
Step 3 Complete the one-time registration by reviewing the FAQ and Terms of Use. These links should help answer questions on portal usage. When ready to agree to the terms, check I agree to the Cisco’s Terms of Use and click Continue.
| ⓘ | Note: Registration is not immediate. The process may take a few hours until account is validated and authorized. An email will be sent to the address of the registrant to inform them of the approval status. |
Step 4 Once authorized, return to the page launched by Download Updated Profile Policies link.
| ⓘ | Note: It is possible to access the Feed Service Portal directly by navigating to ise.cisco.com/partner. |
Step 5 From the Feed Service Management portal, take the opportunity to configure feed notifications by selecting Offline Feed > E-Mail Preferences as shown in Figure 169.
Step 6 Verify and set notification preferences and then click Save (Figure 170).
Cisco Best Practice: It is recommended that Profiler Feed Service notifications are enabled to inform the ISE administrator when new OUI or profile updates are available on the Feed Server, even if manual updates are deployed.
Step 7 Select Offline Feed > Download Package and then click the Generate Package button to create the Offline Update package. The Generating Package… message appears while processing the request. When completed, a page similar to Figure 171 appears.
| ⓘ | Note: Under the Manage Content menu option in the Feed Service Management portal, it is possible to submit new profiles for review and incorporation into the Feed Service. |
Step 8 Selecting the Click here to view the Offline Update package contents link will display the report shown in Figure 166. Optionally view the contents and click Download Package to save the encrypted archive package to a local folder. If the admin client is different than the workstation used to download the package file, be sure to distribute the file to a location accessible to the ISE admin client workstation.
Step 9 From the original ISE page (Work Centers > Profiler > Feeds > Offline Manual Update), click Browse… and select the package file from its saved location, and then click Apply Update (Figure 172).
The ISE server decrypts and extracts the archived package file. The results are the same as if completed using the online process.
Procedure 93 Accessing Cisco Community Profiles
Cisco Community includes hundreds of new profiles that can augment the pre-installed profiles and the Feed Service profiles. Be careful not to exceed the maximum number of supported profiles for the version of ISE deployed. If exceed the supported number, it is important to monitor ISE performance to determine the impact. If performance is impacted, be sure to reduce the number of custom profiles through deletion, primarily those that may have little or no applicability to the deployment. Many of the profiles posted to the community such as the Medical NAC and the Automation and Control Profile Library include descriptions that can assist to determine applicability to your deployment.
| ⓘ | Note: “Cisco Provided” profiles (profiles that are pre-installed or delivered via Feed Service) cannot be individually deleted. When the number of top-level profiles exceeds 500, you will need to switch from Tree-View to List-View to navigate entries beyond the first 500. |
Step 1 From client browser, go to community.cisco.com/docs/DOC-66340. The Cisco Community page provides instructions for locating new ISE profiles posted to the community, as well as instructions for posting new custom profiles to the community.
Step 2 Once the community profile is downloaded to the admin client desktop, unzip the file if not already in XML file format.
Procedure 94 Importing ISE Profiles
Step 1 Go to Work Centers > Profiler > Profiling Policies and click Import from the menu on the RHS pane (Figure 173).
Step 2 Click Browse… to select the XML file downloaded from the Cisco Community and then click Submit.
The import process may take a few minutes depending on the number of profile policies contained in the file. Regardless of whether new profiles are imported by import of raw XML files or the Feed Service, the actual re-profiling process may take minutes or even hours depending on the number of total profiles and total number of endpoints in the ISE database.
Procedure 95 Exporting and Importing ISE Profiles
Once profile policies are exported, the XML files can be shared and imported into another ISE deployment provided the versions are compatible. Exports from older versions can be imported into newer ISE versions, but exports from newer ISE versions may fail in older ISE versions.
Step 1 Go to Work Centers > Profiler > Profiling Policies and click Export from the menu on the RHS pane as shown in Figure 174.
As depicted in the example, the list was filtered using the Advanced Filter and then the option to Export All is chosen to export only the filtered list. The other export options include:
- Export Selected
- Export Selected With Endpoints
Export Selected exports only the XML content needed for import into the same or another system.
Export Selected With Endpoints includes a dump of attributes from a sampling of devices matching the selected profile(s). This information can be useful in determining the reasons why an endpoint matched a specific profile or other information that could be useful in tuning the profile.
Step 2 Save the resulting XML file for future use, or distribute to the target system for import.
Profiling Design and Best Practices
The section discusses general profiling design and best practice recommendations for various deployments and use cases.
Profiling Design Considerations
When planning for ISE Profiling requirements, it is important to start with an understanding of the types of endpoints that require classification to support the network access policy. For example, if you know that a number of network devices of a particular type do not support 802.1X or web-based authentication, it is likely they may require MAB authentication with authorization based on device classification. It is important to list all the known device types that may require profiling for network access.
Profiling Known Device Types
During the ISE planning stage, identify endpoints requiring device classification (authorization based on profile attributes) and determine required attributes to profile these endpoints. If the type of devices requiring authorization is already known, the next step is to determine the attributes and associated probes required to adequately profile them.
Most popular endpoints have a prebuilt policy in the ISE Profile library. Determine attribute and probe requirements by reviewing these default ISE profiles. For example, knowing that Profile X contains conditions A, B, and C, you can deduce the required attributes and probes needed to collect that data. If there is no specific match in the Profile library, reference profiles for similar types of devices. Often the profiling requirements are similar for similar device types.
If there is no existing profile, probes can be temporarily enabled to collect attributes about an endpoint. Often by resetting the endpoint or disconnecting/reconnecting to the network, an administrator can capture the attributes available for the device upon normal startup. The attributes displayed in ISE often reveals the relevant attributes that can uniquely classify the endpoint. Some devices may require traffic analysis including packet capture to determine unique attributes for OUI, DHCP options, User Agent, TCP/UDP ports, or DNS naming.
The following example (Figure 175) shows how to look up attributes used to match on an Apple-iPad profile. It can be seen that this profile is based on either the DHCP attributes or User-Agent. Therefore, to profile Apple iPads, it is recommended that the DHCP and HTTP be used.
Looking at the Profile library (under Work Centers > Profiler > Profiling Policies) (Figure 175) and also reviewing the Profiler Conditions (under Work Centers > Profiler > Policy Elements) (Figure 176) can provide a reasonable understanding of the attributes used and probes required to profile those or similar endpoints.
Once the key profiling attributes are known, determine the best option from available probes and other collection methods to gather the required profile data. Refer to the individual sections on ISE probe configuration for details on specific requirements to support each probe type. Additional recommendations on probe selection best practices are provided at the end of this section.
Profiling Unknown Device Types
The list of endpoints to be profiled may include networked printers, fax machines, phones, cameras, storage appliances, or any number of IP-enabled endpoints. Sometimes the list of critical devices will be readily known - for example, in environments with a large IP telephony deployment. In other cases, there may be a wide variety of unknown hosts where it is necessary to discover the endpoints first. A phased ISE deployment is a general best practice, starting with Monitor Mode. This will allow administrators to learn the type of endpoints that connect to the network and that would have been denied network access if switchports were placed into an enforcement mode. Wireless does not have a “monitor mode,” but wireless profiling can still be used to classify endpoints that connect using 802.1X, Web Authentication, or MAC Filtering.
Cisco Best Practice: Be sure the Wireless controllers set the RADIUS Calling-Station-Id to be the MAC address to allow profiling of non-802.1X clients. This will ensure that ISE is able to add the endpoint to the database and associate other profile data received to this same endpoint based on known MAC address.
If possible, deploy ISE Profiling in the early stages of the deployment. ISE can profile wired endpoints without network authentication or authorization to begin the discovery process. This can offer huge benefits in terms of visibility and understanding the types of endpoints trying to connect to the network. During these early stages, the ISE Profiling Policy can begin to evolve if the specific endpoint types requiring profiling for network access are not already clear.
Once data is collected, take advantage of the CLI “Get All Endpoints” or the Endpoint Analysis Tool (EAT) to focus on Unknown or generically-profiled endpoints to determine gross patterns that will lead to more granular classification leading to explicit policy assignment.
Access Policy and Device Configuration Impact on Profiling
Profiling results may vary depending on the 802.1X deployment mode used (Open Authentication versus Closed Mode) and the order/priority of authentication methods configured on the access devices. For example, if the port is in Closed Mode, DHCP packets cannot be sent until port is authorized. If certain traffic is not sent, probes may not be able to collect the data needed to make a profiling decision. Use of Open Authentication (Monitor Mode and Low-Impact Mode) can allow certain traffic to pass prior to port authorization. Profiling can be accommodated in either scenario, but it is important to understand the implications of specific deployment modes on the ability and timing of attribute collection.
In the case of Flexible Authentication (FlexAuth), the order of authentication methods may also impact the timing of when attributes are collected and the profile assigned at the time of authorization. For example, if the order is set to perform MAB authentication first, 802.1X in Monitor or Low-Impact Modes, it is possible that ISE will have insufficient profile data to assign the desired policy upon initial connection. When the MAB lookup is performed, the endpoint profile may be still be Unknown. If the order is set to perform 802.1X first, it may be possible to collect DHCP and other profiling attributes before 802.1X times out. MAB lookup may then succeed with the correct profile based on the additional attributes collected during initial connection.
| ⓘ | Note: The impact to endpoint is typically only on first connection to network. Once an endpoint is profiled completely, ISE can use its profile assignment to make an immediate policy match on successive reconnections to the network. |
Another consideration is the overall access policy that is initially applied to the port or applied during intermediate or final authorization states. For example, when an endpoint first connects to the network, it may be granted access based on a port ACL, an initial VLAN, or Scalable Group Tag. If the endpoint is Unknown and hits a default policy of “Deny Access”, then the endpoint may never be sufficiently classified to allow it to move to a more specific policy based on its profile. Additionally, some endpoints may transition between different levels of network access; for example, redirected states for web authentication, compliance verification, device registration or client provisioning. If profiling relies on collecting certain data, that access must be allowed at various access states to properly profile the endpoint and apply the intended policy.
A simple use case is DHCP. If DHCP is not allowed, profiling that relies on data from DHCP probes may not be available. If Network Scan is used, but the port blocks access to the ports interrogated by the NMAP probe, again that information will not be available to make a profiling decision. This includes access to SNMP ports even if enabled on the endpoint. Additionally, the endpoint itself must allow the traffic. A common example is the use of NMAP to perform an OS scan. If a personal firewall blocks attempts to scan the endpoint, the probe will yield no results.
The use of the NetFlow probe can be particularly challenging because the endpoint must be allowed access to communicate on the network for NetFlow data to be collected. Therefore, policy must allow for the initial collection of data without assuming complete network access for any endpoint. One possible solution would be to profile endpoints in VLAN A, which disallows access to secured resources but does not block general access to the specified ports. Once profiled based on matching traffic, the endpoint can be reauthorized to VLAN B, which allows privileged access to the secured resources.
Another option is to initially allow the traffic but upon detection of uncharacteristic traffic, match a more specific profile that changes the port authorization. For example, if a process control endpoint communicates on an unexpected port, an Exception Action can be applied to assign the endpoint to a Quarantine Profile and restrict access. ISE Profiling is not targeted to be an anti-spoofing solution, but may be used to enforce policy based on anomalous traffic or other profiling attributes. In environments that include critical devices, these will often be locked down or access limited to a known list of endpoints. In these cases, the value of profiling may be for visibility to ensure that all endpoints that match a specific Profiling Policy display attributes consistent with those device types.
The use of Exception Actions can be a tool in cases where a static policy assignment needs to be made. Realize however, that once an endpoint is statically assigned to a profile, only an administrator can change that assignment.
Cisco Best Practice: A Default Authorization Policy Rule of Deny Access, or one that completely blocks all network access should generally be used only in environments that require the highest levels of security, or cases where every endpoint is accounted for and does not rely on the profiling process for access. A more common and recommended approach for most environments is to allow restricted access in the Default rule, even for Unknown endpoints. The restricted access may include access to DNS and DHCP services and ISE PSNs. Most profiling data can be acquired through these initial “pinholes”.
Probe Selection Best Practices
There are different probes that you can use for each deployment. This section focuses on the information made available by each probe and guides you in the probe selection process based on the type of deployment.
Probe Attributes
When determining which probes to enable in the network, it is helpful to understand which attributes can be collected by each probe. Table 13 summarizes the different probes, the key attributes collected, and the applicable use cases.
| Probe | Key Profiling Attributes | Common Endpoint Profiling Use Cases |
| RADIUS |
|
MAC Address > OUI = Indication of device vendor. Some endpoints can be profiled with this attribute alone if vendor only makes specific devices. Ex: Third-party IP phones, mobile devices, game consoles; MAC-to-IP bindings and probe support. NDG values for Location and Device Type may be used to classify based on connected NAD. |
| RADIUS w/Device Sensor |
|
See SNMP probe for CDP/LLDP info. See DHCP probe for DHCP info. See HTTP probe for User-Agent info. mDNS, H323, and SIP offer unique insight into endpoint type and applications. |
| RADIUS w/ACIDex |
|
Extremely useful for profiling remote access VPN clients including client UDID for correlating to ISE and MDM endpoints. See RADIUS probe for MAC info. Detailed OS, platform, and device type information as visible to local AnyConnect agent. |
| SNMP |
|
See RADIUS probe for MAC info. Valuable for any vendor that uses CDP/LLDP. For example, Cisco IP phones, cameras, access points, appliances. Polling of device ARP tables populates ISE MAC-to-IP bindings. |
| DHCP |
|
Unique vendor IDs for hardware and software. DHCP fingerprints for OS detection. Hostname/FQDN for common name patterns may indicate OS or device type. Customer-defined identifiers. Additionally, provides MAC-to-IP bindings to support other probes. |
| DNS |
|
Value will depend on whether common naming conventions used for hostname/DNS. |
| HTTP |
|
Operating system detection; some browsers like Chrome may mask actual OS. |
| NetFlow |
|
Good for detecting mission-specific endpoints with unique traffic patterns or use general purpose hardware/software.
May detect anomalous traffic for specific endpoints. |
| NMAP |
|
Operating system detection IF scanning not blocked by network/client FW.
Good for detecting endpoints that listen on well-known or specific UDP/TCP ports. Detect endpoints by running services, applications, and their version. Useful for Windows clients to collect domain and OS version data. Offers classification of endpoints that run SNMP agents like network printers and cameras. |
| AD |
|
Verification of managed AD hosts, domain, and OS details as known to Active Directory. |
| pxGrid |
|
IoT asset attributes learned from reliable sources able to collect data typically unavailable to other probes.
See Custom Attributes for additional info. |
| <Custom Attributes> |
|
Highly flexible custom classifications for virtually any attribute associated to endpoints—classification, role, compliance, threat, asset data, ownership, etc. |
Table 14 provides a more detailed list of key attributes per probe. Other attributes may also be available per probe, but the following list highlights the most common or useful attributes for typical deployments.
|
Probe |
Key Profiling Attributes |
| RADIUS |
|
| RADIUS w/Device Sensor |
|
| RADIUS w/ACIDex |
|
| SNMP Query |
|
| SNMP Trap |
|
| DHCP |
|
| DNS |
|
| HTTP |
|
| NetFlow |
|
| NMAP |
|
| AD |
|
| pxGrid |
|
| Other |
|
The Unofficial Guide to Probe Selection
As you consider which probe to select for particular use cases, it may be helpful to rate each probe based on generalized metrics that address the following questions:
- Which probes are the easiest or most difficult to deploy?
- Which probes have the least or highest impact to my network (in terms of traffic overhead, ISE server load, or additional components to support)?
- What is the general value that this probe adds to my ability to profile my endpoints?
Table 15 provides a legend for the metrics and ratings used in Table 16, Table 17, Table 18, and Table 19 to aid in probe selection for different use cases.
| Metric | Rating | |||
|
Name |
Description |
1 | 2 | 3 |
| DDI | Deployment Difficulty Index | Easy | Medium | Difficult |
| NII | Network Impact Index | Low Impact | Medium Impact | High Impact |
| PVI | Probe Value Index | High Value | Medium Value | Low Value |
Discovery Phase – Probe Best Practices
Table 16 provides recommended best practices and guidance for probe selection during the discovery phase of the ISE deployment. The assumption is that the network access devices have yet to be configured for RADIUS port authentication and authorization. Therefore, key probes such as the RADIUS probe will not be able to collect data related to network authentication.
These recommendations apply to other deployments that do not have RADIUS authentication enabled such as network discovery phase and visibility-only deployments.
| Probe (Method) | DDI | NII | PVI | Key Profiling Attributes | Notes |
| RADIUS | - | - | - |
|
Not applicable since ISE not in auth control plane. |
| RADIUS w/Device Sensor | 2 | 2 | 1 |
|
If network supports Device Sensor, you can use RADIUS accounting independent of auth control plane. Network impact generally low, but should also monitor NAD impact. |
| RADIUS w/ACIDex | - | - | - |
|
Not applicable since ISE not in auth control plane. |
| SNMPTrap | 1 | 1 | 1 |
|
Detect endpoints connections / trigger SNMPQuery probe. |
| SNMPQuery | 1 | 2 | 1 |
|
Polling of device ARP tables populates ISE MA- to-IP bindings. Be careful of high SNMP Query traffic triggered by excessive RADIUS accounting updates due to reauth or interim updates. |
| DHCP (Helper) | 2 | 2 | 1 |
|
Provides MAC-to-IP bindings. Network impact generally low, but be careful of low DHCP lease timers, re-DHCP due to network transitions, and DHCP Inform activity. |
| DHCP SPAN | 2 | 3 | 1 |
|
Provides MAC-to-IP bindings |
| DNS | 1 | 1 | 2 |
|
Value will depend on whether common naming conventions are used. |
| HTTP (Redirect) | - | - | - |
|
Not applicable since ISE not in auth control plane. |
| HTTP (SPAN) | 2 | 3 | 1 |
|
Consider SPAN of key HTTP chokepoints like server or Internet edge using intelligent SPAN/tap solutions and/or VACL Capture. |
| NetFlow | 3 | 3 | 2 |
|
Recommended only for specific use cases, not general profiling. |
| NMAP | 1 | 2 | 2 |
|
SNMP data assumes UDP/161 open and public string. Relative value of NMAP will depend on customer network and client configuration. OS results can be unreliable, but unique SMB and unique ports can help fill detection gaps. |
| AD | 1 | 1 | 1 |
|
Endpoint AD membership and OS details. Require ISE AD join. Contingent on acquiring host/machine name from DHCP or DNS. AD data accessible even if not used for ISE authentication. |
| pxGrid | 2 | 1 | 1 |
|
Requires external source that is pxGrid publisher. Custom attributes sent are determined by source, not ISE. Recommended for IoT devices and other sources of unique endpoint context. |
| Custom Attributes | 2 | 1 | 1 |
|
Requires population of endpoint attributes via import, API, pxGrid, or manual entry. Useful for IoT or any endpoint where user-defined attributes can be extracted from external source and contribute to classification, trust, and state. |
Wired Network – Probe Best Practices
Table 17 provides recommended best practices and guidance for probe deployed in a wired network configured for RADIUS authentication.
| Probe (Method) | DDI | NII | PVI | Key Profiling Attributes | Notes |
| RADIUS | 1 | 2 | 1 |
|
Fundamental probe for device detection and enabling other probes. |
| RADIUS w/Device Sensor | 2 | 2 | 1 |
|
If running Cisco Catalyst Switches with Device Sensor support, then this is ideal and optimized method to collect select attributes. |
| RADIUS w/ACIDex | - | - | - |
|
Not currently applicable to wired networks. |
| SNMPTrap | 1 | 2 | 3 |
|
Detect endpoints connections / trigger SNMP Query probe. Not required with RADIUS AAA. |
| SNMPQuery | 1 | 2 | 1 |
|
Polling of device ARP tables populates ISE MAC-to-IP bindings; Be careful of high SNMP Query traffic triggered by excessive RADIUS Accounting updates due to re-auth or Interim Updates. |
| DHCP (Helper) | 2 | 2 | 1 |
|
Provides MAC-to-IP Bindings; Be wary of low DHCP lease timers. |
| DHCP SPAN | 2 | 3 | 1 |
|
Provides MAC-to-IP Bindings |
| DNS | 1 | 1 | 2 |
|
Value will depend on whether common naming conventions used |
| HTTP (Redirect) | 2 | 1 | 1 |
|
Value will depend on relative importance of OS for wired access. |
| HTTP (SPAN) | 2 | 3 | 1 |
|
Consider SPAN of key HTTP chokepoints like Internet edge; Leverage smart SPAN solutions and VACL Capture if possible |
| NetFlow | 3 | 3 | 2 |
|
Recommended only for specific use cases, not general profiling |
| NMAP | 1 | 2 | 2 |
|
SNMP data assumes UDP/161 open and public string. Relative value of NMAP will depend on customer network and client configuration. OS results can be unreliable, but unique SMB and unique ports can help fill detection gaps. |
| AD | 1 | 1 | 1 |
|
Endpoint AD membership and OS details. Require ISE AD join. Contingent on acquiring host/machine name from DHCP or DNS. |
| pxGrid | 2 | 1 | 1 |
|
Requires external source that is pxGrid publisher. Custom attributes sent are determined by source, not ISE. Recommended for IoT devices and other sources of unique endpoint context. |
| Custom Attributes | 2 | 1 | 1 |
|
Requires population of endpoint attributes via import, API, pxGrid, or manual entry. Useful for IoT or any endpoint where user-defined attributes can be extracted from external source and contribute to classification, trust, and state. |
Wireless Network – Probe Best Practices
Table 18 provides recommended best practices and guidance for probe deployed in a wireless network configured for RADIUS authentication.
| Probe (Method) | EDI | NII | PVI | Key Profiling Attributes | Notes |
| RADIUS | 1 | 2 | 1 |
|
Fundamental probe for device detection and enabling other probes |
| RADIUS w/Device Sensor | 2 | 2 | 2 |
|
If running Wireless Controllers with Device Sensor support, then this is ideal and optimized method to collect select attributes. Value lower for wireless based on limited sensor data compared to wired at time guide was written. |
| RADIUS w/ACIDex | - | - | - |
|
Not currently applicable to wireless networks. |
| SNMPTrap | - | - | - |
|
SNMP traps from wireless devices not currently supported. |
| SNMPQuery | 1 | 2 | 1 |
|
Polling of device ARP tables populates ISE MAC-to-IP bindings. Be careful of high SNMP Query traffic triggered by excessive RADIUS accounting updates due to reauth or interim updates. |
| DHCP (Helper) | 2 | 1 | 1 |
|
Provides MAC-to-IP bindings. Be wary of low DHCP lease timers. |
| DHCP SPAN | 2 | 3 | 1 |
|
Provides MAC-to-IP bindings. |
| DNS | 1 | 1 | 2 |
|
Value will depend on whether common naming conventions used. |
| HTTP (Redirect) | 2 | 1 | 1 |
|
Value will depend on relative importance of OS for wired access. |
| HTTP (SPAN) | 2 | 3 | 2 |
|
Consider SPAN of key HTTP chokepoints like Internet edge. Use smart SPAN solutions and VACL Capture if possible. |
| NetFlow | 3 | 3 | 2 |
|
Recommended only for specific use cases, not general profiling. |
| NMAP | 1 | 2 | 2 |
|
SNMP data assumes UDP/161 open and public string. |
| AD | 1 | 1 | 1 |
|
Endpoint AD membership and OS details. Require ISE AD join. Contingent on acquiring host/machine name from DHCP or DNS. |
| pxGrid | 2 | 1 | 1 |
|
Requires external source that is pxGrid publisher. Custom attributes sent are determined by source, not ISE. Recommended for IoT devices and other sources of unique endpoint context. |
| Custom Attributes | 2 | 1 | 1 |
|
Requires population of endpoint attributes via import, API, pxGrid, or manual entry. Useful for IoT or any endpoint where user-defined attributes can be extracted from external source and contribute to classification, trust, and state. |
Remote Access VPN Network – Probe Best Practices
Table 19 provides recommended best practices and guidance for probe deployed in a wireless network configured for RADIUS authentication.
| Probe (Method) | DDI | NII | PVI | Key Profiling Attributes | Notes |
| RADIUS | 1 | 2 | 1 |
|
Fundamental probe for device detection and enabling other probes |
| RADIUS w/Device Sensor | - | - | - |
|
Device Sensor not currently supported over VPN. |
| RADIUS w/ACIDex | 2 | 1 | 1 |
|
Needed for profiling of remote access VPN clients and correlation of remote clients to ISE endpoint database. Requires AnyConnect VPN clients connected to ASA. |
| SNMPTrap | - | - | - |
|
|
| SNMPQuery | - | - | - |
|
|
| DHCP (Helper) | - | - | - |
|
Generally, not supported due to lack of helper/relay support to ISE by VPN gateway. |
| DHCP SPAN | 3 | 3 | 1 |
|
Provides DHCP attributes for VPN, but not client MAC. SPAN is possible on VPN gateways configured for DHCP Proxy to external DHCP server. RADIUS with ACIDex is recommended option. |
| DNS | 1 | 1 | 3 |
|
Value will depend on whether common naming conventions are used. Lower likelihood DNS entries applicable to VPN clients. |
| HTTP (Redirect) | 2 | 1 | 2 |
|
Flows such as MDM rely on redirect as well as ACIDex. RADIUS with ACIDex is recommended option. |
| HTTP (SPAN) | 2 | 3 | 3 |
|
Consider SPAN of key HTTP chokepoints like server or Internet edge using intelligent SPAN/tap solutions and/or VACL Capture. RADIUS with ACIDex is recommended option. |
| NetFlow | 3 | 3 | 2 |
|
Recommended only for specific use cases, not general profiling. |
| NMAP | 1 | 2 | 3 |
|
SNMP data assumes UDP/161 open and public string. Relative value of NMAP will depend on customer network and client configuration. OS results can be unreliable, but unique SMB and unique ports can help fill detection gaps. Low probe value due to low likelihood of NMAP traffic over VPN and correlation to endpoint. RADIUS with ACIDex is recommended option. |
Profiling Plan
After reviewing the different types of endpoints that require device classification—for either visibility or network access based on device type—and agreeing on the best probes to collect the required data, the next step is to document the profiling plan. At a minimum, this plan should include all the devices to be profiled and how that profiling data will be used to authorize network access. The plan should also include the list of unique attributes required to classify each endpoint, the probe or method used to capture those attributes, and the specifics of the collection method. For example, will Device Sensor or IP Helper be used to capture DHCP? Where will the data be captured? Which network devices require configuration? Which PSNs will receive the data? Another critical aspect of the plan is how scalability and redundancy will be deployed.
Table 20 shows a basic profiling plan for a sample company.
| Device Profile | Where Used in Auth Policy Rules? |
Unique Attributes | Probes Used | Collection Method |
| Cisco IP Phone | Cisco-IP-Phones (MAB) | OUI | RADIUS | RADIUS Authentication |
| CDP | SNMP Query | Triggered by RADIUS Start | ||
| IP Camera | Cisco-IP-Cameras (MAB) | OUI | RADIUS | RADIUS Authentication |
| LLDP | SNMP Query | Triggered by RADIUS Start | ||
| Printer | Printers (MAB) | OUI | RADIUS | RADIUS Authentication |
| DHCP Class Identifier | DHCP | IP Helper from local Layer 3 switch SVI | ||
| SNMP hrDeviceDescr/sysDescr | NMAP | Triggered NMAP based on OUI | ||
| Point of Sale (PoS) Station (static IP) |
POS (MAB) | MAC Address | RADIUS (MAC Address discovery) | RADIUS Authentication |
| ARP Cache for MAC-to-IP mapping | SNMP Query | Triggered by RADIUS Start | ||
| FQDN | DNS | Triggered by IP Discovery | ||
| Employee Workstations | Employee_Managed (802.1X/MAB) | DHCP Class Identifier
Browser User Agent |
RADIUS w/Device Sensor | RADIUS Accounting |
| AD host/Operating System | AD | Triggered by DHCP host-name | ||
| Mobile Devices | Employee_Personal (802.1X/CWA) |
OUI | RADIUS | RADIUS Authentication |
| Browser User Agent | HTTP | Authorization Policy posture redirect to central Policy Service node cluster | ||
| DHCP Class Identifier and MAC-to-IP mapping | DHCP | IP Helper from local Layer 3 switch SVI | ||
| Device X | Critical_Device_X (MAB) |
MAC Address | RADIUS (MAC Address discovery) | RADIUS Authentication |
| Asset Database Attributes | pxGrid | One PSN in each data center subscribe to Asset Topic. | ||
| Optional to acquire ARP Cache for MAC-to-IP mapping | SNMP Query | Triggered by RADIUS Accounting Start |
Profiling Scale and High Availability
ISE Profiling scale can be increased by distributing the Profiling service load across multiple PSNs. However, the addition of additional PSNs increases the chances that profiling data for a single endpoint can be received by multiple PSNs. When multiple PSNs receive data for the same endpoint, replication must occur between nodes to ensure they maintain consistent data. Furthermore, redundancy requirements demand that other PSNs can assume the load if one PSN fails. High availability may therefore create a situation where the same data is sent to multiple PSNs. The challenge is to provide scale and redundancy across multiple PSNs while limiting the number of recipients for the same data, and when possible, send data for a given endpoint to the same PSN.
Various technologies and features may be used to distribute profiling load across multiple PSNs. The two most common include:
- Load Balancing
- Anycast
Load Balancing Profiler Services
Load balancers offer a popular solution to cluster server resources behind a single addressable target. Senders are configured with a virtual IP address (VIP) of the load-balanced cluster and the load balancer handles the distribution of load to the real servers (PSNs in this case) on the backend. One of the key benefits of using load balancers with ISE services is that network access devices do not require reconfiguration each time a PSN is added or removed from the cluster, or if the PSNs require address changes. The load balancer centrally maintains access to the server resources.
In the case of ISE Profiling, many of the probes can leverage load balancing, including:
- RADIUS – The NAD is configured with the VIP address as the target for RADIUS AAA. Since Device Sensor is based on the RADIUS probe, RADIUS load balancing implicitly supports Device Sensor. To maintain communications to the same PSN, load balancer persistence or stickiness is often based on the RADIUS Calling-Station-Id (typically MAC address) or NAD source IP address.
- DHCP – The “ip helper” or relay target for DHCP is set to a VIP. The source of communications originates from the endpoint’s Layer 3 gateway interface. Load balancer persistence can be based on simple source IP, but may result in RADIUS sessions and DHCP being sent to different PSNs. Some load balancers offer advanced logic to maintain persistence across services.
- SNMP Traps –The SNMP host target for traps is set to the VIP. By maintaining a consistent source for SNMP traps from the NAD, the load balancer persistence can be set to source IP.
- HTTP (URL Redirection) – By default, URL redirection for web services such as Hotspot, CWA, BYOD, Posture, Client Provisioning, and MDM follow the RADIUS server. By implementing RADIUS load balancing, redirected web services are implicitly load balanced.
- NetFlow – The export target is set to the VIP. It is recommended that the VIP, in turn, points to separate, dedicated interfaces on each PSN. Load balancers can have multiple server pools that point to the same set of ISE appliances, but different interfaces, as required.
In each of the above examples, the ISE PSNs are the target for the profiling data. Probes that initiate the communication (SNMP Query, Active Directory, pxGrid, NMAP) do not utilize load balancing services
| ⓘ | Note: The load balancer VIP is often limited to a single data center or campus. In these cases, other methods such as Anycast may be required to support redundancy across geographic locations. |
Anycast and Profiler Services
Anycast is based on a simple premise of assigning two or more hosts with the same IP address and allowing routing determine the most appropriate target to receive the data. Similar to the load balancer use cases to provide a single target for profiling data (RADIUS, DHCP relay, SNMP traps, and NetFlow), Anycast allows the sources to be configured with a single IP target to avoid sending the same data to multiple destinations.
The Anycast IP address can be assigned to a real PSN interface IP address or load balancer VIP address to support redundancy across data centers. When assigned to the PSN, the interface must not be the management interface (GigabitEthernet0). The management interface must be a unique IP. The interface used for Anycast must be a dedicated interface used by the Profiler probe. The same requirement does not apply when the Anycast IP address is the load balancer VIP. This is due to the load balancer’s ability to map the Anycast IP to a different, real IP address on the backend, including the management interface.
| ⓘ | Note: Regardless of which entities are assigned the Anycast address for an ISE service, the most critical requirement is that the result is a consistent, singular target under normal operating conditions. For example, equal cost load balancing (ECLB) should be avoided if data for the same communication can be split across targets. Route flaps can also result in issues for maintaining a single target for Profiler communications. |
Optimizing Data Replication
Other methods to increase ISE Profiler scale is to optimize data replication. Two methods to scale replication include:
- Endpoint Attribute Filter
- Node Groups
Endpoint Attribute Filter
The Endpoint Attribute Filter restricts profile data collection and replication to attributes needed to support device classification as well as maintenance of the endpoint in the database. The filter is sometimes referred to as the “Whitelist” filter. Additional details on the Endpoint Attribute Filter configuration are covered under Profiling Services Global Configuration.
Node Groups
Node Groups are used by ISE to localize replication to a set of PSNs that have high-speed interconnectivity. When profile changes to a whitelisted attribute occurs, the ownership and replication of the endpoint attributes stays local to the node group. All changes to a whitelist attribute that occur outside the ownership of a node group member requires replication through the Primary PAN. It is recommended that all PSNs in the same campus network be added to the same node group. Members of the same load balancer cluster should always be in the same node group, although load balancing is not a prerequisite for creating node groups.
Summary of Profiling Best Practices and Recommendations
The following summarizes general best practice recommendations for ISE Profiling:
- Use Device Sensors when possible to optimize data collection.
- Configure node groups such that all PSNs in the same campus network (LAN speed connections) are in the same node group. This will reduce replication through the Primary PAN to nodes in the same campus.
- Enable the Endpoint Attribute (Whitelist) Filter in production deployments to reduce the number of extraneous attributes that must be replicated.
- Avoid the collection of duplicate profile data. For example, if Device Sensor is already collecting DHCP attributes for a given switch or segment, collection of the same data via IP helper only creates additional network configuration and load on the network and ISE.
- When possible, ensure profile data for a given endpoint is sent to the same Policy Service node. If not sent to the same PSN, attempt to send to the same node group. Otherwise, there is a potential for excessive updates of endpoint data and contention by multiple PSNs.
In many cases, ISE handles this automatically:- SNMP Queries will be issued by the same PSN that receives the RADIUS Accounting Start or SNMP trap packet.
- HTTP traffic resulting from URL redirection is sent to the PSN that is handling the RADIUS session.
- DHCP Helper can be sent to more than one PSN, so recommendation is to send to same PSNs as configured for RADIUS for particular access device. This can be achieved through the use of Device Sensor, load balancers with persistence logic to bind DHCP requests to RADIUS sessions, or Anycast.
- DNS queries are sent by the same PSN that learns the IP address. This PSN is typically the one that handles the RADIUS session and receives the IP address from either the Framed-IP-Address from RADIUS Accounting, DHCP, or SNMP Query.
- Triggered NMAP Scans are sourced by the same PSN that receives the profiling data resulting in a policy rule match. For example, if an NMAP Scan Action is assigned to a profile rule condition based on OUI match, then the first PSN that receives the endpoint MAC address via RADIUS, DHCP, or another probe will be the one that sources the NMAP scan.
- In other cases, such as using DHCP SPAN, HTTP SPAN, SNMP Query (polled mode), NetFlow, or pxGrid probe, it is not always possible to ensure traffic reaches the same PSN in a distributed deployment.
RADIUS Probe:
- Ensure RADIUS timers are set to reasonable values to avoid excessive reauthentications that will correspond to higher load on ISE Profiling. In general, set:
- Minimum RADIUS authentication session/reauth timer = 2 hours (8 hours or longer is often sufficient, although load balancer persistence may require shorter interval than 8 hours)
- Minimum idle/inactivity timer = 1 hour (use of IP phones or hubs lacking a way to signal endpoint disconnects may force shorter timers)
- Minimum RADIUS accounting update timer = 1 day (leverage NAD options for limiting updates to critical changes only)
- Implement ISE failed authentication and accounting suppression to drop excessive requests.
HTTP Probe:
- Use Device Sensor when available for capturing the User-Agent. If Device Sensor is not available, leverage URL redirection instead of SPAN to centralize collection and reduce traffic load related to SPAN/RSPAN.
- In general, try to avoid data collection using HTTP SPAN. If used:
- Look for key traffic chokepoints such as the Internet edge or wireless controller connection
- Use intelligent SPAN/tap options or VACL Capture to limit amount of data sent to IS.
- It can be difficult to provide high availability for SPAN without an intelligent network tap infrastructure.
DHCP Probe:
- Use Device Sensor when available for capturing DHCP attributes.
- One exception is Cisco Wireless LAN Controllers (WLCs) that are only capable of sending limited DHCP attributes. If possible, use DHCP Relay (WLC Bridged mode for DHCP) to capture additional attributes. Otherwise, use WLC’s Device Sensor for profiling if controller cannot be switched from Proxy mode for DHCP.
- If Device Sensor cannot be used, DHCP Relays (IP Helpers) are preferred over SPAN. In general, try to avoid data collection using DHCP SPAN. If used, make sure probe captures traffic to central DHCP server
- It can be difficult to provide high availability for SPAN without an intelligent network tap infrastructure.
- Be aware that layer 3 devices serving DHCP will not relay DHCP for same network.
- Low DHCP lease timers will result in higher PSN load. Lease timers of one day to one week are typically sufficient. Avoid lease timers less than 4 hours.
SNMP Probe:
- Use Device Sensor when available to collect attributes normally available through SNMP.
- Be careful of high SNMP traffic due to triggered RADIUS accounting updates as a result of high re-authentication (low session/re-auth timers) or frequent interim accounting updates.
- For polled queries, be careful not to set polling interval too low. Recommended minimum poll period is 28800 seconds (8 hours). Be sure to set optimal PSN for polling in ISE network device configuration.
- Disable SNMP polling for NADs that are sporadically connected such as remote teleworkers.
- SNMP Traps are primarily useful for non-RADIUS deployments or pre-AAA deployment phase to gain network visibility, not for a network already using RADIUS-based authentication and authorization.
NetFlow Probe:
- Use only for specific use cases. NetFlow has the potential for high load on network devices and PSN.
pxGrid Probe:
- Limit the number of PSNs configured for this probe to avoid collection of duplicate data that must be replicated and reconciled across the deployment.
- Recommend a maximum of two PSNs enabled for pxGrid probe to provide redundancy in event of single node failure or network outage.
Custom Attributes:
- When not used for profiling, disable global settings for Custom Attributes. To instantiate and leverage these attributes for profiling requires additional resources to maintain and replicate these fields, so recommend only enable if required.
- If external sources (asset managers, service ticketing, device managers) contain valuable data to support the profiling process, determine if the data can be made accessible via CSV file, API, or pxGrid. If so, define relevant Endpoint Custom Attributes in ISE to contain this data for the purposes of visibility and device classification.
Custom Profiles:
- Take advantage of the CLI “Get All Endpoints” or Endpoint Analysis Tool (EAT) to generate reports to highlight opportunities for new profiles and identify gaps in profile data collection.
- Review naming standards used inside the organization that may be used to support custom profiles that are unique to the organization. Examples include device names and host names found in DHCP, DNS, CDP, LLDP, SMB, and AD.
- Review addressing standards used inside the organization that may be used to support custom profiles that are unique to the organization. Examples include private MAC addresses (also known as Locally Administered Addresses) and IP addressing schemes that are reserved for specific device types or functions.
Authorization Policy:
- Ensure sufficient access is granted to complete the profiling process. If access is based on profile, access will need to be granted at some stage of onboarding process to ensure ISE can collect the needed attributes to sufficiently classify the device to match a more specific policy with increased access privileges.
- When possible, leverage Logical Profiles to create policy conditions based on profiling results. Avoid the creation and use of Identity Groups in ISE Profiles since these objects are limited to one per endpoint and often used for other purposes.
Appendix A: ISE Menu Navigation Maps
There are often multiple navigation paths to configure or view the same data in ISE. Work Centers were introduced in ISE to consolidate virtually all configuration, monitoring, and troubleshooting components for a specific feature or function under a single menu to facilitate workflows and management. The Profiler Work Centers consolidates all profiling items from the original menu structure under a single menu under Work Centers > Profiler.
It is perfectly valid to use either navigation path to suit the personal choice of each administrator. Since Work Centers are intended to make management simpler, more intuitive, and efficient, this guide on ISE Profiler best practices emphasizes the use of Work Centers. Table 21 provides a mapping between Work Center menus and traditional menus.
| Work Center Navigation | Traditional Navigation |
| Work Centers > Profiler > Overview | <Not Applicable> |
| Work Centers > Profiler > Ext Id Sources | Administration > Identity Management > External Identity Sources |
| Work Centers > Profiler > Network Devices | Administration > Network Resources > Network Devices |
| Work Centers > Profiler > Endpoint Classification | Context Visibility > Endpoints > Endpoint Classification |
| Work Centers > Profiler > Node Config | Administration > System > Deployment |
| Work Centers > Profiler > Feeds | Administration > Feed Service > Profiler |
| Work Centers > Profiler > Manual Scans | <Not Applicable> |
| Work Centers > Profiler > Policy Elements | Policy > Policy Elements > Conditions > Profiling
Policy > Policy Elements > Results > Profiling |
| Work Centers > Profiler > Profiling Policies | Policy > Profiling |
| Work Centers > Profiler > Policy Sets | Policy > Policy Sets |
| Work Centers > Profiler > Troubleshoot | Operations > Troubleshot > Diagnostic Tools > General Tools |
| Work Centers > Profiler > Reports | Operations > Reports |
| Work Centers > Profiler > Settings | Administration > System > Settings > Profiling |
| Work Centers > Profiler > Settings | Policy > Policy Elements > Dictionaries |
Appendix B: Probe Frequencies
Most probes are triggered by a specific event. However, there may be cases where the triggers could result in excessive queries or updates to endpoints, network devices, ISE PSNs, or external servers. To help ensure systems are not overloaded, some events and updates may be governed to help ensure overall system heath and stability. Table 22 summarizes the different thresholds imposed on various probes.
| Probe/Event | Profiler Threshold | Comments |
| RADIUS | None | ISE Profiler services does not impose thresholds on the profiling of RADIUS events, but ISE AAA services support RADIUS authentication and accounting suppression mechanisms to prevent an overload of RADIUS being sent to PSNs. Furthermore, network devices can be configured for longer reauthentication intervals and reduced RADIUS accounting updates. |
| SNMP Triggered Query | Maximum one query per 24 hours for a given endpoint (not configurable) |
ISE Profiler limits SNMP interface queries to once a day for same endpoint. |
| SNMP Polled Query | Once per 8 hours (28800 seconds) by default | Network Device configuration governs PSN profiling interval. Range 600 to 86400 seconds (10 minutes to 1 day). |
| DHCP | None | DHCP lease times can be increased to reduce renewals. |
| DNS | Once per hour for a given IP (not configurable) |
|
| HTTP | None | |
| NetFlow | None | NetFlow Exporter can be configured to send less granular updates. Sampled exports does reduce flows, but may also miss critical flow data. |
| NMAP | - Once for Unknown endpoint - Once for Triggered Network Scan Action - Once per Manual Scan |
NMAP triggered automatically once for Unknowns and once per triggered NMAP Scan Action matched in specific profile policy. All other NMAP scanning is manual. |
| AD | Maximum one AD lookup per 24 hours, by default (days configurable) |
Valid range is 1 – 31 days. |
| pxGrid | - Update on changes only - Bulk query on service restarts, new publisher, out-of-sync |
Typically, a bulk download will occur on initial connection to pxGrid be each PSN configured for the pxGrid probe. Only delta changes get sent following bulk update. |
Appendix C: SNMPv3 Configuration Example
The SNMP probe performs two basic types of queries to network access devices (NADs). The first type is a polled query to the NAD for all ports. The second is a query for a specific interface that is triggered by a RADIUS Accounting Start or SNMP Trap. The general configuration for polled queries is generally straight-forward for Cisco wired switches. However, the generic configuration that works for polled queries may fail with triggered queries for SNMPv3. This section provides a sample SNMPv3 configuration to support SNMP probe triggered interface queries.
The interface query attempts to collect per-VLAN table information from the Bridge MIB. To support these queries using SNMPv3 may require the addition of SNMPv3 context to the switch configuration. Context is a collection of management information accessible by the SNMP agent.
The following Cisco switch CLI configuration example illustrates the inclusion of SNMPv3 context to support per-VLAN Bridge-MIB queries with ISE SNMP probe.
snmp-server group snmpv3group v3 auth read iseview write iseview notify iseview
snmp-server group snmpv3group v3 auth context vlan- match prefix read iseview
snmp-server view iseview iso included
snmp-server trap-source GigabitEthernet1/0/24
snmp-server enable traps snmp linkdown linkup
snmp-server enable traps mac-notification change move
snmp-server host 10.1.100.8 version 3 auth snmpv3user mac-notification snmp
snmp-server user snmpv3user snmpv3group v3 auth md5 snmpv3pass
Additional SNMPv3 Usage Notes:
- The last command defining the user does not display in running-config
- Useful commands to verify the SNMPv3 configuration:
- show snmp user
- show snmp view
- show snmp group
- If a read view is not specified, then agent assumes full object access
- If write or notify views are not specified, then agent assumes no object access
- The write view is not required; only read access is required for ISE SNMP probe queries.
- The notify view is used to support SNMP traps and would be required by the SNMP Trap probe. However, if RADIUS Accounting is used to detect new endpoints and trigger SNMP queries, then SNMP traps are required or recommended.
The example view shown in this particular example provides full access starting at iso tree level in MIB. For higher security, identify more specific MIB objects to be allowed, or else specify excluded MIB objects.
Figure 177 shows a sample ISE Network Device configuration to support the previous switch configuration using SNMPv3.
Questions or Comments?
Please submit your questions or comments about this document to the ISE Community.
Find answers to your questions by entering keywords or phrases in the Search bar above. New here? Use these resources to familiarize yourself with the community:
