- Cisco Community
- Technology and Support
- Security
- Security Knowledge Base
- TrustSec Troubleshooting Guide
- Subscribe to RSS Feed
- Mark as New
- Mark as Read
- Bookmark
- Subscribe
- Printer Friendly Page
- Report Inappropriate Content
- Subscribe to RSS Feed
- Mark as New
- Mark as Read
- Bookmark
- Subscribe
- Printer Friendly Page
- Report Inappropriate Content
09-07-2016 03:17 AM - edited 07-24-2024 01:43 AM
- Best Practices
- Hardware and Software Support
- SXP Scalability
- Release Notes
- Configuration Guides
- Info collection
- Debugging
- TrustSec Fundamentals
- CLI differences between IOS and NX-OS
- How to add and check the credentials / Device-ID on IOS and NX-OS?
- What is a CTS PAC and how to check if it is installed?
- How to install the PAC into the ASA
- What is the CTS environment-data and where to find it?
- How to clear the Credentials?
- How to clear the PAC information?
- How to refresh the Environment-data?
- How to check if RADIUS is operational from the switch?
- Symptom / Possible Causes / Verification and Solution
- Classification
- How to see the authenticated sessions in my switch and associated SGTs?
- How can I see all the classification entries in my switch?
- How can I see what classification entries have been received over SXP?
- Why is my VLAN-SGT Mapping not working (IP Device Tracking)?
- Is there a priority list when configuring different classification types on IOS?
- Is there a priority list when configuring different classification types on NX-OS?
- Propagation
- SXP
- Inline Tagging
- Enforcement
- How to check if enforcement is enabled?
- How to check role-based policy on the switches?
- How to check the SGACL's on the switches?
- How to refresh the policy on network devices?
- What SGACL Entries (ACE's) are Supported Per Platform?
- How to check the enforcement counters?
- N7k Specific Information
- N5k Specific Information
- 'Clear' commands missing from CLI in N5k
- How to verify that the SGT value, trust mode and propagate SGT are configured correctly?
- How to check if the N5k VLANs are enforced?
- Capture PPF (Policy Propagation Facility) output for offline analysis
- How to check historic TrustSec events on the N5k?
- N1kv Specific Information
- How to Check if Device Tracking is Enabled?
- How to Check SGT Assignment in the N1kv?
- 3850 Specific Information
- Cat9300/9400 Specific Information
- ASR1k Specific Information
- ISR Specific Information
- How to debug inline tagging?
- ASA Specific Information
- Cat3k Specific Information
- How to show IP, MAC, VLAN and interface for a given SGT:
- How to show the VLAN and SGT for a given interface:
- How to show SGACL programming:
- How to show detailed counters:
- Cat4k Specific Information
- How to see the FIB programming of SGT with IP, VRF, Port and VLAN?
- How to Check if Destination Mapping Can be Derived from an IP Address?
- Cat6k Specific Information
- How to Check Device Tracking Information on the Cat6k?
- How to check TCAM on the 6500
- How to monitor Inline Tagging on Cat6k Sup2T?
- How to troubleshoot/trace SGT and SGACL behavior on a 6500?
- IE4k/5k Specific Information
- Check and set the right SDM Template
- ISE Specific Information
- ISE monitoring and troubleshooting guide
- Using TCP Dump on ISE
- How to monitor ISE-ACI message exchange
Best Practices
Hardware and Software Support
Some functions of TrustSec, in particular inline tagging and SGACL enforcement, require hardware support. Other TrustSec functions like classification and SXP are supported in software. Ensure that the hardware and software installed in your network supports the functions that you are trying to deploy. The TrustSec solution team executes validation cycles on the latest hardware and software, and the validated list can be found at the following link:
http://www.cisco.com/c/en/us/solutions/enterprise-networks/trustsec/trustsec_matrix.html
Bear in mind that this is a solution validation matrix. New functionality may be released by different Cisco Business Units and be supported by TAC but may not have yet gone through a solution validation cycle.
SXP Scalability
If deploying SXP then ensure the limits per platform are not exceeded.
SXP scalability limits are published in the TrustSec system/product bulletins near the bottom of the CCO TrustSec page:
http://www.cisco.com/go/trustsec
Release Notes
Refer to the Release Notes of the products involved. http://www.cisco.com/c/en/us/support/index.html
Cisco Support - Software Downloads, Product Documentation, Support Tools, and Support Cases - Cisco
Configuration Guides
Refer to the latest TrustSec quick-start configuration guide for the basics:
For User to DC Access, see the following document on CCO:
For Data Center segmentation, refer to the latest guide provided on CCO:
For campus/branch segmentation, refer to the following guide:
Info collection
If an escalation is necessary then adequate information needs to be collected and forwarded in able for the problem to be investigated.
While this list is in no way complete, it gives some suggestions for initial capture:
show version
show running-config
show inventory
show module
show log (relevant entries)
show tech-support (show tech-support cts for NX-OS)
show command output as suggested throughout this document
debugs as suggested below
Debugging
As always, use debug commands with caution. Enabling debugging can disrupt operation of the device when networks are experiencing high load conditions.
Before debugging, look at your CPU load with the show processes cpu command. Verify that you have ample CPU available before you begin the debugs.
Remember that it may be possible to enable Conditionally Triggered Debugs for packets entering or leaving a device for a specific interface.
In most cases, you can use the no debug all or undebug all commands in order to stop the debugs.
Check the particular debug functionality provided on the platform in question, not all commands are available on every product.
Below is a list of debug commands suggested for troubleshooting certain scenarios. Debugs are given for IOS, IOS-XE, NX-OS and ASA-OS.
Mix and match these debug commands as required and as requested by support.
| 6500 | 3850 | ASR1k | N7k | N5k | ASA | ||
| General | debug cts all | ✓ | ✓ | ✓ | ✓ | ✓ | ✓ |
| debug cts condition level detail | ✓ | ||||||
| debug cts messages | ✓ | ✓ | |||||
| debug cts packets | ✓ | ✓ | |||||
| PAC Failure | debug cts provision events | ✓ | ✓ | ✓ | |||
| debug cts provision packet | ✓ | ✓ | ✓ | ||||
| debug cts ifc events | ✓ | ✓ | ✓ | ||||
| AAA | debug radius | ✓ | ✓ | ✓ | ✓ | ||
| debug radius all | ✓ | ✓ | ✓ | ||||
| debug cts aaa | ✓ | ✓ | ✓ | ||||
| debug cts ifc events | ✓ | ✓ | ✓ | ||||
| debug eap events | ✓ | ✓ | ✓ | ✓ | |||
| debug eap errors | ✓ | ✓ | ✓ | ✓ | |||
| debug authen event | ✓ | ✓ | ✓ | ||||
| debug authen error | ✓ | ✓ | ✓ | ||||
| debug dot1x all | ✓ | ✓ | ✓ | ✓ | ✓ | ||
| debug authen feature all | ✓ | ✓ | ✓ | ||||
| debug mab all | ✓ | ✓ | |||||
| 6500 | 3850 | ASR1k | N7k | N5k | ASA | ||
| CTS Auth | debug cts authen details | ✓ | ✓ | ✓ | |||
| debug cts authe | ✓ | ✓ | |||||
| debug dot1x events | ✓ | ✓ | ✓ | ✓ | ✓ | ||
| debug dot1x packets | ✓ | ✓ | ✓ | ✓ | ✓ | ||
| debug dot1x errors | ✓ | ✓ | ✓ | ✓ | ✓ | ||
| debug cts ifc events | ✓ | ✓ | ✓ | ||||
| Policy dnload | debug cts author even | ✓ | ✓ | ✓ | |||
| debug cts autho | ✓ | ✓ | ✓ | ✓ | ✓ | ||
| debug cts author aaa | ✓ | ✓ | ✓ | ||||
| debug cts aaa | ✓ | ✓ | ✓ | ||||
| debug cts ifc events | ✓ | ✓ | ✓ | ||||
| Policy install | debug cts author event | ✓ | ✓ | ✓ | |||
| debug cts autho | ✓ | ✓ | ✓ | ✓ | ✓ | ||
| debug cts author aaa | ✓ | ✓ | ✓ | ||||
| debug cts author rbacl | ✓ | ✓ | ✓ | ||||
| debug rbm | ✓ | ✓ | ✓ | ||||
| debug rbm policy | ✓ | ✓ | ✓ | ||||
| debug rbm binding | ✓ | ✓ | ✓ | ||||
| debug rbm api | ✓ | ✓ | ✓ | ||||
| debug rbm platform | ✓ | ✓ | ✓ | ||||
| debug cts ifc events | ✓ | ✓ | ✓ | ||||
| 6500 | 3850 | ASR1k | N7k | N5k | ASA | ||
| Env data | debug cts environment-data all | ✓ | ✓ | ✓ | |||
| debug cts env | ✓ | ✓ | ✓ | ✓ | |||
| debug cts aaa | ✓ | ✓ | ✓ | ||||
| debug radius | ✓ | ✓ | ✓ | ✓ | |||
| debug cts ifc events | ✓ | ✓ | ✓ | ||||
| debug cts authe | ✓ | ✓ | |||||
| debug cts autho | ✓ | ✓ | ✓ | ✓ | ✓ | ||
| L3IF & Mapping | debug rbm bindings | ✓ | ✓ | ✓ | |||
| debug cts ifc events | ✓ | ✓ | ✓ | ||||
| debug cts sgt-map | ✓ | ||||||
| SAP | debug cts sap events | ✓ | ✓ | ✓ | |||
| debug cts ifc events | ✓ | ✓ | ✓ | ||||
| debug cts errors | ✓ | ✓ | ✓ | ✓ | ✓ | ||
| debug cts sap packets | ✓ | ✓ | ✓ | ||||
| debug macsec events | ✓ | ||||||
| debug cts sap pakdump | ✓ | ✓ | ✓ | ||||
| debug cts dp info | ✓ | ✓ | ✓ | ||||
| debug cts dp error | ✓ | ✓ | ✓ | ||||
| debug macsec | ✓ | ||||||
| debug cts sap | ✓ | ✓ | |||||
| 6500 | 3850 | ASR1k | N7k | N5k | ASA | ||
| cache | debug cts ifc events | ✓ | ✓ | ✓ | |||
| debug cts cache | ✓ | ✓ | ✓ | ||||
| HW path | debug platform cts dp api | ✓ | |||||
| debug platform cts dp event | ✓ | ||||||
| debug platform cts dp error | ✓ | ||||||
| debug platform cts dp redundancy | ✓ | ||||||
| HA/Sync | debug cts ha core | ✓ | ✓ | ✓ | |||
| debug cts ha config | ✓ | ✓ | ✓ | ||||
| debug cts ha infra | ✓ | ✓ | ✓ | ||||
| debug cts err | ✓ | ✓ | ✓ | ✓ | ✓ | ||
| debug cts ifc ev | ✓ | ✓ | ✓ | ||||
| debug cts cluster | ✓ | ||||||
| debug cts ha | ✓ | ||||||
| SGT cache | debug rbm bindings | ✓ | ✓ | ✓ | |||
| debug rbm api | ✓ | ✓ | ✓ | ||||
| debug fm rbacl caching packets | ✓ | ||||||
| debug fm rbacl caching events | ✓ | ||||||
| debug fm rbacl all | ✓ | ||||||
| debug fm rbacl monitoring | ✓ | ||||||
| debug cts sgt-caching | ✓ | ||||||
| 6500 | 3850 | ASR1k | N7k | N5k | ASA | ||
| SXP | debug cts sxp connection | ✓ | ✓ | ✓ | ✓ | ||
| debug cts sxp errors | ✓ | ✓ | ✓ | ||||
| debug cts sxp all | ✓ | ||||||
| debug cts sxp | ✓ | ✓ | |||||
| debug cts sxp internal | ✓ | ✓ | ✓ | ||||
| debug cts sxp mdb | ✓ | ✓ | ✓ | ||||
| debug cts sxp message | ✓ | ✓ | ✓ | ✓ | |||
| debug ip tcp trans | ✓ | ✓ | ✓ | ||||
| debug ip tcp packet | ✓ | ✓ | ✓ | ||||
| IPv6 | debug ipv6 snooping binding | ✓ | ✓ | ✓ | |||
| debug ipv6 snooping fsm | ✓ | ✓ | ✓ | ||||
| debug epm all | ✓ | ✓ | ✓ | ||||
| debug epm events session details | ✓ | ✓ | ✓ | ||||
| debug epm events session | ✓ | ✓ | ✓ | ||||
| debug epm plugin cts error | ✓ | ✓ | ✓ | ||||
| debug epm plugin cts event | ✓ | ✓ | ✓ | ||||
| debug rbm all | ✓ | ✓ | ✓ | ||||
| 6500 | 3850 | ASR1k | N7k | N5k | ASA | ||
| CoA | debug cts coa event | ✓ | ✓ | ✓ | |||
| debug aaa coa | ✓ | ✓ | ✓ | ||||
| debug radius dynamic-authorization | ✓ | ||||||
| NX-OS specific | show tech-support cts | ✓ | ✓ | ||||
| show tech-support forwarding l3 unicast detail | ✓ | ✓ | |||||
| show tech module <mod #> | ✓ | ✓ | |||||
| show tech-support routing ip unicast | ✓ | ✓ | |||||
TrustSec Fundamentals
CLI differences between IOS and NX-OS
There are some slight differences between IOS and NX-OS when it comes to configuring and displaying information.
Some differences are displayed in the table below and further explanation may be found in the rest of this document.
| Function | IOS | NX-OS |
| Enable cts | no cts enable command | (config)# cts enable |
| Add credentials | cts credentials id Kernow-6500 password <password> | (config)# cts device-id Kernow-N7k password <password> |
| Show SXP connections | show cts sxp connections brief | show cts sxp connection (no brief) |
| Show mappings | show cts role-based sgt-map all | show cts role-based sgt-map (no all) |
| Show RBACL | show cts rbacl | show cts role-based access-list |
| show policy | show cts role-based permissions | show cts role-based policy |
| Show specific policy | show cts role-based permissions from 10 to 20 | show cts role-based policy sgt 10 dgt 20 |
| Configure static policy | (config)#cts role-based permissions from 10 to 20 <RBACL_name> | (config)# cts role-based sgt 10 dgt 20 access-list <RBACL_name> |
| Show counters | show cts role-based counters from 10 to 20 | show cts role-based counters sgt 10 dgt 20 |
| Configure static RBACL | (config)#ip access-list role-based <name> | (config)# cts role-based access-list <name> |
How to add and check the credentials / Device-ID on IOS and NX-OS?
Credentials (or Device ID) is needed on network devices for secure communications with ISE.
Remember that cts credentials (or Device-ID) is only needed on devices that need to download SGT's and policy for enforcement. SGACL's are not supported on routers until later in 2016 so you will not see credentials on routers in software versions prior to that.
Adding credentials in IOS and NX-OS is slightly different.
In IOS, credentials are added in executive mode i.e. you do not go into Global Configuration Mode. This OS uses the 'cts credentials id' command.
In NX-OS, credentials are added in Global Configuration Mode. This OS uses the 'cts device-id' command.
Prompt-6500#cts credentials id Kernow-6500 password <password>
Prompt-N7k(config)# cts device-id Kernow-N7k password <password>
The username and password configured in the network device MUST match up with the credentials added into ISE under Administration > Network Resources > Network Devices > Device_Name > Advanced TrustSec Settings:
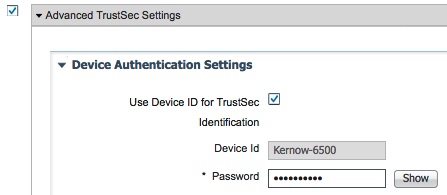
Use 'show cts' or 'show cts credentials' to display the information:
Prompt-6500#show cts
Global Dot1x feature: Disabled
CTS device identity: "Kernow-6500" <----- CTS credentials
CTS caching support: disabled
Number of CTS interfaces in DOT1X mode: 0, MANUAL mode: 0
Number of CTS interfaces in LAYER3 TrustSec mode: 0
Number of CTS interfaces in corresponding IFC state
INIT state: 0
AUTHENTICATING state: 0
AUTHORIZING state: 0
SAP_NEGOTIATING state: 0
OPEN state: 0
HELD state: 0
DISCONNECTING state: 0
INVALID state: 0
CTS events statistics:
authentication success: 0
authentication reject : 0
authentication failure: 0
authentication logoff : 0
authentication no resp: 0
authorization success : 0
authorization failure : 0
sap success : 0
sap failure : 0
port auth failure : 0
Prompt-6500#show cts credentials
CTS password is defined in keystore, device-id = Kernow-6500 <----- CTS credentials
Prompt-N7k# show cts
CTS Global Configuration
==============================
CTS support : enabled
CTS device identity : Kernow-N7k <----- CTS credentials
SGT : 2(TrustSec_Devices)
CTS policy caching support : enabled
Number of CTS interfaces in
DOT1X mode : 0
Manual mode : 1
Prompt-N7k# show cts credentials
Device id = Kernow-N7k <----- CTS credentials
What is a CTS PAC and how to check if it is installed?
A PAC is a 'Protected Access Credential' which is a unique shared EAP-FAST credential used to mutually authenticate client (eg switch) and server (eg ISE).
Secure RADIUS uses automatic PAC provisioning for the switches when the switches first communicate with ISE.
Later versions of ISE have TLS 1.0 disabled by default for general security reasons. However, if using a PAC for SGT purposes then TLS 1.0 needs to be enabled (up to ISE 3.0 Patch 5 where TLS 1.2 is supported). Navigate to Administration > System > Settings > Security Settings, select Allow TLS 1.0, and Save. PLEASE NOTE: This action will reload the ISE application. With enhancement CSCvz48491 first built into ISE 3.0 Patch 5, CTS now supports TLS 1.2 for switching in IOS-XE 17.1 and routing in IOS-XE 17.6.
The ASA cannot download the PAC inline for automatic PAC provisioning. For the ASA, the PAC needs to be manually generated in ISE, downloaded and installed into the ASA.
Prompt-4500X#show cts pacs
AID: D69282EF930F60EC9EA66AF0A252AD4E
PAC-Info:
PAC-type = Cisco Trustsec
AID: D69282EF930F60EC9EA66AF0A252AD4E
I-ID: 4500X
A-ID-Info: Identity Services Engine
Credential Lifetime: 15:49:36 UTC Jun 22 2016
PAC-Opaque: 000200B00003000100040010D69282EF930F60EC9EA66AF0A252AD4E00060094000301001D7EFDD6D9AC833756BD9FA8E22CA5DD0000001356F2A3810009
3A802996DBC957FC7134B6A5A8AE508BC2F74EFECDB5E086AE4D6293EB146573F6D6D0B459BA6A558887A03AD21E2AD7B865763A9D8B8EE3D12D22EBE2E0
D669D8B17D303669FD12F8C8261D9B88168874E9A802D291A05E17D770AB11301335FE93B573160AEB4C121191DC6CE0700E4648793F489C
Refresh timer is set for 12w0d
If the PAC is not installed, the output of 'show cts pacs' will be empty.
To install the PAC, ensure the 'cts credentials' are provisioned and lines similar to the following are configured on the switch:
aaa new-model
!
aaa authentication dot1x default group radius
aaa authorization network default group radius
aaa authorization network auth-list-name group radius
aaa accounting dot1x default start-stop group radius
!
cts authorization list auth-list-name
!
!
radius-server vsa send authentication <----- may be default configuration, check with 'show run all'
radius server <server-name>
address ipv4 <server IP address> auth-port 1812 acct-port 1813
pac key <password>
Once the 'pac key <password>' has been entered under the radius server, and exit/end has been entered, the switch prints the following event:
Request successfully sent to PAC Provisioning driver.
If there is a problem with downloading the PAC then the following event will be generated:
%CTS-3-PAC_PROVI_FAIL: PAC Provisioning failed for <server-IP>
Check that ISE is reachable, the credentials are provisioned and the switch is configured as above.
How to install the PAC into the ASA
As mentioned above, the ASA cannot download and provision the PAC automatically inline.
To provision the PAC, firstly generate the PAC from the bottom of the ISE Network Device screen of the ASA:

The PAC file can then be saved and transferred to the ASA disk and the PAC can be imported from there:
Prompt-ASA(config)#cts import pac disk0:/pac123.pac password <password>
What is the CTS environment-data and where to find it?
The CTS environment-data is initial data downloaded from ISE to the switch after the PAC has been installed.
Prompt-3850#show cts environment-data
CTS Environment Data
====================
Current state = COMPLETE
Last status = Successful
Local Device SGT:
SGT tag = 2-00:TrustSec_Devices <----- Device SGT assigned in ISE under TrustSec / Policy / Network Device Authorization
Server List Info: <----- Specified in ISE under TrustSec / Components / TrustSec AAA Servers
Installed list: CTSServerList1-0003, 1 server(s):
*Server: 10.1.101.5, port 1812, A-ID 07E800455F590B8BF0906365359428BF
Status = ALIVE
auto-test = TRUE, keywrap-enable = FALSE, idle-time = 60 mins, deadtime = 20 secs
Multicast Group SGT Table:
Security Group Name Table: <----- List of SGT's downloaded from ISE
0-00:Unknown
2-00:TrustSec_Devices
3-00:Network_Services
4-00:Employees
5-00:Contractors
6-00:Guests
255-00:Quarantined_Systems
Environment Data Lifetime = 86400 secs
Last update time = 07:44:44 UTC Tue Mar 29 2016
Env-data expires in 0:23:59:25 (dd:hr:mm:sec)
Env-data refreshes in 0:23:59:25 (dd:hr:mm:sec)
Cache data applied = NONE
State Machine is running
ISE server information can also be displayed using the following command:
Prompt-3850#show cts server-list
CTS Server Radius Load Balance = DISABLED
Server Group Deadtime = 20 secs (default)
Global Server Liveness Automated Test Deadtime = 20 secs
Global Server Liveness Automated Test Idle Time = 60 mins
Global Server Liveness Automated Test = ENABLED (default)
Installed list: CTSServerList1-0003, 1 server(s):
*Server: 10.1.101.5, port 1812, A-ID 07E800455F590B8BF0906365359428BF
Status = ALIVE
auto-test = TRUE, keywrap-enable = FALSE, idle-time = 60 mins, deadtime = 20 secs
How to clear the Credentials?
The credentials can be cleared from the device if needed:
Prompt-3850#clear cts credentials
This device will no longer be able to join the CTS network.
Are you sure you want to delete all CTS credentials and PACs? [confirm]
How to clear the PAC information?
The PAC can be cleared from the device if that is required:
Prompt-3850#clear cts pac ?
A-ID Specify A-ID of a PAC to be removed from the key store
all Clear all PACs on the device
When executed, take note of the following warning:
This may disrupt connectivity on your CTS links.
Are you sure you want to delete all PACs? [confirm]
Once cleared, a PAC provisioning request may have to be forced. To accomplish this, re-provision the pac key under the radius server:
radius server <server name>
pac key <password>
Once exit/end is entered, the following event is generated:
Request successfully sent to PAC Provisioning driver.
How to refresh the Environment-data?
Environment-data information can be refreshed using CLI.
Prompt-3850#cts refresh environment-data
Environment data download in progress
How to check if RADIUS is operational from the switch?
Can check the status as displayed by the CLI using commands like the following:
Prompt-3850#show aaa servers
RADIUS: id 1, priority 1, host 10.1.101.5, auth-port 1812, acct-port 1813
State: current UP, duration 2348s, previous duration 0s <----- The state UP means it is operational
Dead: total time 0s, count 2
Quarantined: No
Authen: request 13, timeouts 6, failover 0, retransmission 5 <----- See counters below for authc, authz and acctg
Response: accept 1, reject 0, challenge 6
Response: unexpected 0, server error 0, incorrect 0, time 285ms
Transaction: success 7, failure 1
Throttled: transaction 0, timeout 0, failure 0
Author: request 24, timeouts 20, failover 0, retransmission 15
Response: accept 4, reject 0, challenge 0
Response: unexpected 0, server error 0, incorrect 0, time 10ms
Transaction: success 4, failure 5
Throttled: transaction 0, timeout 0, failure 0
Account: request 1, timeouts 0, failover 0, retransmission 0
Request: start 1, interim 0, stop 0
Response: start 1, interim 0, stop 0
Response: unexpected 0, server error 0, incorrect 0, time 10ms
Transaction: success 1, failure 0
Throttled: transaction 0, timeout 0, failure 0
Elapsed time since counters last cleared: 40m
Estimated Outstanding Access Transactions: 0
Estimated Outstanding Accounting Transactions: 0
Estimated Throttled Access Transactions: 0
Estimated Throttled Accounting Transactions: 0
Maximum Throttled Transactions: access 0, accounting 0
Requests per minute past 24 hours:
high - 0 hours, 39 minutes ago: 15
low - 0 hours, 38 minutes ago: 0
average: 0
Prompt-3850#show radius server-group all
Server group radius
Sharecount = 1 sg_unconfigured = FALSE
Type = standard Memlocks = 1
Server(10.1.101.5:1812,1813) Transactions:
Authen: 7 Author: 24 Acct: 1
Server_auto_test_enabled: FALSE
Keywrap enabled: FALSE
Server group private_sg-0
Server(10.1.101.5:1812,1646) Successful Transactions:
Authen: 0 Author: 3 Acct: 0
Server_auto_test_enabled: TRUE
Keywrap enabled: FALSE
You can also test the aaa operation by using the CLI to send a RADIUS request:
Prompt-3850#test aaa group radius tseng1 <password> new-code
User successfully authenticated
USER ATTRIBUTES
username 0 "tseng1"
Message-Authenticato 0 <hidden>
security-group-tag 0 "1111-1" <----- Some devices like this 3850 display the returned SGT, DEC 4369 here
Symptom / Possible Causes / Verification and Solution
| Symptom | Possible Causes | Verification and Solution |
|---|---|---|
ISE Event: 5400 Authentication failed, Failure Reason: 12852 Cryptographic processing of received buffer failed |
There may be credentials missing from the access switch. | Check with ‘show cts credentials’. |
ISE Event: 5400 Authentication failed, Failure Reason: 22056 Subject not found in the applicable identity store(s) |
In the ISE Livelog details, check Username received with entries in the identity stores. If this is for CTS start-up then the ID or password in the switch cts credentials may not match what is configured in the Device ID field of Advanced TrustSec Settings in ISE under Administration / Network Resources / Network Devices for that device. | Ensure the username and password match between the switch and ISE. |
ISE Event: 5400 Authentication failed, Failure Reason: 24206 User disabled |
User exists in the identity store but is disabled. | In ISE, navigate to Identity Management > Identity > Users and enable the particular user entry. |
ISE Event: 5405 RADIUS Request dropped, Failure Reason: 11302 Received Secure RADIUS request without a cts-pac-opaque cisco-av-pair attribute |
Switch is sending requests to ISE and the switch has no PAC installed. |
Check switch and ISE configuration, check username and password credentials match between switch and ISE. Force a new PAC provisioning request by configuring: radius server <server name> pac key <password> exit |
ISE Event: 5417 Dynamic Authorization failed, Failure Reason: 11213 No response received from Network Access Device after sending a Dynamic Authorization request |
Either lack of connectivity or CoA is not enabled on the switch. |
Enable CoA on the switch: aaa server radius dynamic-author client <ISE IP> server-key <password> |
ISE Event: 5420 TrustSec Data Download Failed, Failure Reason: 11304 Could not retrieve requested Security Group Tag |
A switch is requesting an update for a SGT which does not exist in ISE. In the ISE Livelog details, CiscoAVPair shows the SGT in question, e.g. cts-rbacl-source-list=0064 (which is hex for SGT 100). |
Check the static classifications configured on the access switch. |
Classification
Classification maps an IP to a SGT. This is accomplished dynamically where possible and statically otherwise.
Dynamic classification is done through 802.1x, MAB, WebAuth or Remote Access.
Static classification is done though IP-SGT mapping, VLAN-SGT mapping, Subnet-SGT mapping, L2/L3 Port Mapping and Port Profiling Mapping.
How to see the authenticated sessions in my switch and associated SGTs?
Use the following commands to check the authenticated session on an access switch:
Prompt-3850#show authentication sessions
Interface MAC Address Method Domain Status Fg Session ID
Gi1/0/2 0050.5694.d054 dot1x DATA Auth 0A04010300000FB00003640C
Session count = 1
Key to Session Events Blocked Status Flags:
A - Applying Policy (multi-line status for details)
D - Awaiting Deletion
F - Final Removal in progress
I - Awaiting IIF ID allocation
N - Waiting for AAA to come up
P - Pushed Session
R - Removing User Profile (multi-line status for details)
U - Applying User Profile (multi-line status for details)
X - Unknown Blocker
Prompt-3850#show authentication sessions mac 0050.5694.d054 details <----- Can use interface instead of mac
Interface: GigabitEthernet1/0/2
IIF-ID: 0x100CBC000000088
MAC Address: 0050.5694.d054
IPv6 Address: Unknown
IPv4 Address: 10.4.1.11
User-Name: tseng1
Status: Authorized
Domain: DATA
Oper host mode: multi-auth
Oper control dir: both
Session timeout: N/A
Restart timeout: N/A
Session Uptime: 28127s
Common Session ID: 0A04010300000FB00003640C
Acct Session ID: 0x00000FA5
Handle: 0x98000003
Current Policy: POLICY_Gi1/0/2
Local Policies:
Service Template: DEFAULT_LINKSEC_POLICY_SHOULD_SECURE (priority 150)
Server Policies:
SGT Value: 4369 <----- SGT dynamically assigned by ISE
Method status list:
Method State
dot1x Authc Success
How can I see all the classification entries in my switch?
Prompt-3850#show cts role-based sgt-map all
Active IPv4-SGT Bindings Information
IP Address SGT Source
============================================
5.6.7.8 100 VLAN <----- VLAN-SGT statically assigned
10.1.1.1 2 INTERNAL
10.2.2.10 10 CLI <----- IP-SGT statically assigned
10.252.10.1 2 INTERNAL
10.252.10.10 3 LOCAL <----- Has been dynamically assigned, perhaps through 802.1x
10.252.100.1 2 INTERNAL
20.10.10.0/24 200 CLI <----- Subnet-SGT statically assigned
172.26.208.31 2 INTERNAL
192.168.1.10 1234 SXP <----- IP-SGT learned via SXP
IP-SGT Active Bindings Summary
============================================
Total number of VLAN bindings = 1
Total number of CLI bindings = 2
Total number of SXP bindings = 1
Total number of LOCAL bindings = 1
Total number of INTERNAL bindings = 4
Total number of active bindings = 9
Note that SGT mappings are VRF aware so if mappings are within a VRF then use the following command:
Prompt-3850#show cts role-based sgt-map vrf x all
How can I see what classification entries have been received over SXP?
As well as using the command above, the SXP entries can be displayed using the following command:
Prompt-4500X#show cts sxp sgt-map brief
SXP Node ID(generated):0x0A34E879(10.52.232.121)
IP-SGT Mappings as follows:
IPv4,SGT: <10.10.52.51 , 20:UC_Endpoints>
IPv4,SGT: <10.10.102.50 , 21:Employee_Mgd_Asset>
Total number of IP-SGT Mappings: 2
Why is my VLAN-SGT Mapping not working (IP Device Tracking)?
Ensure IP Device Tracking is enabled:
Prompt-3850#show ip device tracking all
Global IP Device Tracking for clients = Enabled
Global IP Device Tracking Probe Count = 3
Global IP Device Tracking Probe Interval = 30
Global IP Device Tracking Probe Delay Interval = 0
-----------------------------------------------------------------------------------------------
IP Address MAC Address Vlan Interface Probe-Timeout State Source
-----------------------------------------------------------------------------------------------
10.4.1.11 0050.5694.d054 10 GigabitEthernet1/0/2 30 ACTIVE ARP
10.4.1.10 000c.295e.4932 10 GigabitEthernet1/0/1 30 ACTIVE ARP
10.4.1.1 e8b7.487e.5a16 10 GigabitEthernet1/0/48 30 ACTIVE ARP
Total number interfaces enabled: 3
Enabled interfaces:
Vl10, Gi1/0/1, Gi1/0/2
Is there a priority list when configuring different classification types on IOS?
Yes, TrustSec resolves conflicts among IP-SGT binding sources with a strict priority scheme.
The current priority enforcement order for IOS, from lowest (1) to highest (8), is as follows:
1. VLAN—Bindings learned from snooped ARP packets on a VLAN that has VLAN-SGT mapping configured.
2. CLI— Address bindings configured using the IP-SGT form of the cts role-based sgt-map global configuration command.
3. Layer 3 Interface—(L3IF) Bindings added due to FIB forwarding entries that have paths through one or more interfaces with consistent L3IF-SGT mapping or Identity Port Mapping on routed ports.
4. SXP—Bindings learned from SXP peers.
5. IP_ARP—Bindings learned when tagged ARP packets are received on a CTS capable link.
6. LOCAL—Bindings of authenticated hosts which are learned via EPM and device tracking. This type of binding also include individual hosts that are learned via ARP snooping on L2 [I]PM configured ports.
7. SGT CACHING — Bindings learned through the SGT Caching feature by gleaning the inline SGT in the packet.
8. INTERNAL—Bindings between locally configured IP addresses and the device own SGT.
The highest (implict) precedence is inline tagging with CMD (even if SGT 0/Unknown)
Is there a priority list when configuring different classification types on NX-OS?
Yes, TrustSec resolves conflicts among IP-SGT binding sources with a strict priority scheme.
The current priority enforcement order for NX-OS, from lowest (1) to highest (6), is as follows:
1.VLAN—Bindings learned from snooped ARP packets on a VLAN that has VLAN-SGT mapping configured.
2.SGT Caching — IP/SGT learned via the SGT caching feature
3.SXP—Bindings learned from SXP peers.
4.Interface (LOCAL) —Bindings of authenticated hosts which are learned via EPM and device tracking. This type of binding also include individual hosts that are learned via ARP snooping on L2 [I]PM configured ports.
5.CLI— Address bindings configured using the IP-SGT form of the ctsrole-based sgt-map global configuration command
6.INTERNAL—Bindings between locally configured IP addresses and the device own SGT.
Propagation
SXP
How to tell the state of SXP connections and the highest SXP version supported by a product.
Prompt-4500X#show cts sxp connections brief
SXP : Enabled <----- SXP needs to be enabled with the 'cts sxp enable' command
Highest Version Supported: 4 <----- Highest SXP Version supported
Default Password : Set <----- A default password to be used by SXP connections can be set with 'cts sxp default password <password>'
Default Source IP: Not Set <----- A default source IP to be used by SXP connections can be set with 'cts sxp default source-ip <IP>'
Connection retry open period: 120 secs
Reconcile period: 120 secs
Retry open timer is not running
----------------------------------------------------------------------------------------------------------------------------------
Peer_IP Source_IP Conn Status Duration
----------------------------------------------------------------------------------------------------------------------------------
10.10.2.2 10.10.2.1 On 5:01:50:38 (dd:hr:mm:sec)
Total num of SXP Connections = 1
What is supported in the different versions of SXP
| SXP Version | Supported |
|---|---|
| SXP Version 1 | Initial SXP version supporting IPv4 binding propagation. |
| SXP Version 2 | Includes support for IPv6 binding propagation and version negotiation. |
| SXP Version 3 |
Adds support for Subnet-SGT binding propagation. If speaking to a lower version then the subnet will be expanded to individual IP-SGT entries. N.B. Subnet expansion needs to be enabled by the use of "cts sxp mapping network-map x" where x is the maximum number of host expansions and x=0 means no expansion |
| SXP Version 4 | Loop detection and prevention, capability exchange and built-in keep-alive mechanism. |
Why are my SGT Subnet SXP bindings not being propagated?
You need to check the SXP version supported on the SXP destination device. Subnet binding was introduced in SXPv3. If the SXP destination device does not support SXPv3 then the Subnet binding will not be propagated to that device.
The source SXP device can however, be configured to expand that Subnet and send individual IP-SGT mappings to the destination. The default number of expanded mappings is zero.
If you have a Subnet binding on a device which supports at least SXPv3 (this is on an ASR1k which supports SXPv4):
Prompt-ASR(config)#cts role-based sgt-map 19.20.21.16/28 sgt 1234
This binding is shown up on the ASR1k as a Subnet binding:
Prompt-ASR#show cts role-based sgt-map all
Active IPv4-SGT Bindings Information
IP Address SGT Source
============================================
19.20.21.16/28 1234 CLI
However, with an SXP connection to a N7k running release 7.2 (only supports SXPv1), no mappings show up within that subnet range.
On the ASR1k then, we have to expand the Subnet such that individual IP-SGT mappings can be sent to the N7K. The number of expanded mappings can be specified up to 65535 entries. On the ASR1k:
Prompt-ASR(config)#cts sxp mapping network-map 16
On the N7k, these mappings are now received:
Prompt-N7k# show cts role-based sgt-map
IP ADDRESS SGT VRF/VLAN SGT CONFIGURATION
19.20.21.17 1234 vrf:1 Learnt from SXP peer:10.3.4.2
19.20.21.18 1234 vrf:1 Learnt from SXP peer:10.3.4.2
19.20.21.19 1234 vrf:1 Learnt from SXP peer:10.3.4.2
19.20.21.20 1234 vrf:1 Learnt from SXP peer:10.3.4.2
19.20.21.21 1234 vrf:1 Learnt from SXP peer:10.3.4.2
19.20.21.22 1234 vrf:1 Learnt from SXP peer:10.3.4.2
19.20.21.23 1234 vrf:1 Learnt from SXP peer:10.3.4.2
19.20.21.24 1234 vrf:1 Learnt from SXP peer:10.3.4.2
19.20.21.25 1234 vrf:1 Learnt from SXP peer:10.3.4.2
19.20.21.26 1234 vrf:1 Learnt from SXP peer:10.3.4.2
19.20.21.27 1234 vrf:1 Learnt from SXP peer:10.3.4.2
19.20.21.28 1234 vrf:1 Learnt from SXP peer:10.3.4.2
19.20.21.29 1234 vrf:1 Learnt from SXP peer:10.3.4.2
19.20.21.30 1234 vrf:1 Learnt from SXP peer:10.3.4.2
Inline Tagging
How to check the status of CTS links?
Prompt-4500X#show cts interface
Global Dot1x feature is Disabled
Interface TenGigabitEthernet1/1:
CTS is enabled, mode: MANUAL <----- 'cts manual' mode rather than 'cts dot1x'
IFC state: OPEN <----- IFC purely means Interface
Interface Active for 1w0d
Authentication Status: NOT APPLICABLE <----- N/A for 'cts manual' setup
Peer identity: "unknown" <----- Unknown as 'cts manual' and not negotiating
Peer's advertised capabilities: ""
Authorization Status: SUCCEEDED
Peer SGT: 2:TSDevices
Peer SGT assignment: Trusted
SAP Status: NOT APPLICABLE <----- SAP key exchange not configured
Propagate SGT: Enabled <----- Default config (vs 'no propagate sgt')
Cache Info: <----- N/A for 'cts manual' with 'cts dot1x' config with 'cts cache enable'
Expiration : N/A
Cache applied to link : NONE
Critical-Authentication: Disabled <----- N/A with 'cts manual'
Peer SGT: 0
Peer SGT assignment: Untrusted
Default PMK: Not Configured
Default SGACL:
Fail-Open: Enabled
Statistics:
authc success: 0
authc reject: 0
authc failure: 0
authc no response: 0
authc logoff: 0
sap success: 0
sap fail: 0
authz success: 1
authz fail: 0
port auth fail: 0
L3 IPM: disabled. <----- Identity Port Mapping (set with 'cts manual -> policy dynamic identity <name>' where <name> is the identity of the peer which allows the switch to download policy for that peer.
How to use Netflow to monitor inline tagging?
Netflow is configured slightly differently on different platforms.
How to configure Netflow is the topic for another document but many of the Cisco products now support exporting SGT information in the flow records.
Example configuration just showing the SGT information for the 3850 is shown here:
flow record Kernow_record_output
match flow cts source group-tag <----- Configures the CTS source group as a key field
match flow cts destination group-tag <----- Configures the CTS destination group as a key field
!
flow exporter Kernow_exporter
destination 10.1.110.3
!
flow monitor Kernow_monitor_output
exporter Kernow_exporter
record Kernow_record_output
!
interface GigabitEthernet1/0/48
ip flow monitor Kernow_monitor_output output <----- Enable on interface
You don't have to have a netflow collector to see the SGT information. You can check out the netflow cache on the platform:
Prompt-3850#show flow monitor Kernow_monitor_output cache
Cache type: Normal (Platform cache)
Cache size: Unknown
Current entries: 2
Flows added: 1912
Flows aged: 1909
- Active timeout ( 60 secs) 83
- Inactive timeout ( 15 secs) 1826
IPV4 SOURCE ADDRESS: 10.4.1.3
IPV4 DESTINATION ADDRESS: 10.1.110.3
TRNS SOURCE PORT: 59559
TRNS DESTINATION PORT: 2055
INTERFACE OUTPUT: Gi1/0/48
FLOW DIRECTION: Output
FLOW CTS SOURCE GROUP TAG: 2 <----- This flow has SGT 2
FLOW CTS DESTINATION GROUP TAG: 0
IP TOS: 0x00
IP PROTOCOL: 17
IP TTL: 254
tcp flags: 0x00
counter bytes long: 566
counter packets long: 2
timestamp abs first: 02:20:51.723
timestamp abs last: 02:21:09.723
IPV4 SOURCE ADDRESS: 10.4.1.10
IPV4 DESTINATION ADDRESS: 10.4.1.255
TRNS SOURCE PORT: 137
TRNS DESTINATION PORT: 137
INTERFACE OUTPUT: Gi1/0/48
FLOW DIRECTION: Output
FLOW CTS SOURCE GROUP TAG: 4369 <----- This flow has SGT 4369
FLOW CTS DESTINATION GROUP TAG: 0
IP TOS: 0x00
IP PROTOCOL: 17
IP TTL: 128
tcp flags: 0x00
counter bytes long: 1170
counter packets long: 15
timestamp abs first: 02:20:08.723
timestamp abs last: 02:20:55.723
ASA: How to capture inline tag information?
capture capturename type inline-tag 17 interface outside real-time <----- 17 being the SGT to be displayed
N.B.
Warning: using this option with a slow console connection may
result in an excessive amount of non-displayed packets
due to performance limitations.
1: 06:35:04.867157 INLINE-TAG 17 10.4.1.10.60808 > 10.1.100.2.53: udp 35
2: 06:35:05.820300 INLINE-TAG 17 10.4.1.10.64639 > 10.1.100.2.53: udp 44
3: 06:35:09.843355 INLINE-TAG 17 10.4.1.10.63261 > 10.1.100.2.53: udp 35
How to monitor inline tagging on the 3850 or Cat9k platforms?
The 'monitor capture' command is very useful on the 3850 and Cat9k platforms, see the operation at the following link:
Link to 'monitor capture' details
How to capture inline tag information on the N1kv?
Documentation of how to use vempkt is here:
Basically, these are the steps:
"Vempkt size capture 1600"
Need to find the port-channel ltl number . Execute “vemcmd show port vlans”, will list the ltl number corresponding to the port-channel.
Set vempkt to capture the packets on the uplink . “vempkt capture egress ltl <port-channel ltll>”
Start vempkt capture “vempkt start”.
“vempkt show info” will list the number of packets captured.
To stop the capture “vempkt stop”
The packet capture can be exported to a pcap file "vempkt pcap export cts”. This will create a file cts.pcap.
How to capture inline tag information on the Sup2T?
This is explained in the Sup2T section of this document:
How to check if inline tags are successfully being transmitted or received by the ASR?
This is written up in the ASR section of this document:
How to check the presence of inline tags on the ASR by using caching?
This is written up in the ASR section of this document:
Enforcement
How to check if enforcement is enabled?
On the switch check that enforcement is globally enabled for TrustSec-enabled Layer 3 interfaces: 'cts role-based enforcement'
The 'cts role-based enforcement vlan-list x' command must be issued to enable SGACL enforcement on VLANs.
On ISE, under Administration > Network Resources > Network Devices, ensure the device is entered using the settings below as an example:

CLI to check enforcement is very platform specific, for example on the N7k:
Prompt-N7k# show cts role-based enable
vrf:1
On the 3850:
Prompt-3850#show platform sgacl
Global Enforcement: On <----- Enforcement status
================= DGID Table ==========================================
Entry DGT SGT DGID hash
=======================================================================
0x51690e70 4369 1 17
LEID Table:
============== LEID Table ===============================================
Entry SGT DGT LE ID Ref Count hash
=========================================================================
0x4ec30330 4369 4369 1 2 0 0x4ec30268 -1 -1 2 2 0
=================== H/W LEID Table ============================================
Entry SGT DGT DGID v4lbl v6lbl handle hash
===============================================================================
0x619c8030 4369 4369 1 4 0 0x619c8248 3
======== SGHASH TCAM (asic 0) =========
Printing entries for region SGT_DGT (244)
========================================================
HashTable 4 Left bucket 693 Index 0 Valid
Mask 00000000:00000000:000000
Key 00f00000:01000011:110000
AD1 40040000:00000000
AD2 00000000:00000000
Total entries printed: 1
======== SGHASH TCAM (asic 1) =========
Printing entries for region SGT_DGT (244)
========================================================
HashTable 4 Left bucket 693 Index 0 Valid
Mask 00000000:00000000:000000
Key 00f00000:01000011:110000
AD1 40040000:00000000
AD2 00000000:00000000
Total entries printed: 1
How to check role-based policy on the switches?
Most switches use the term 'permissions' in the CLI:
Prompt-3850#show cts role-based permissions
IPv4 Role-based permissions default:
Permit IP-00
IPv4 Role-based permissions from group 4369:Four369 to group 4369:Four369:
Deny_ip-14
RBACL Monitor All for Dynamic Policies : FALSE
RBACL Monitor All for Configured Policies : FALSE
The N7k uses the term 'policy' in the CLI:
Prompt-N7k# show cts role-based policy
sgt:17(TSengineering)
dgt:19(19_Prod_Srvr) rbacl:Deny_ip
deny ip
sgt:4369(Four369)
dgt:4369(Four369) rbacl:Deny_ip
deny ip
sgt:4369(Four369)
dgt:1001(OneThousandandOne) rbacl:Deny_ip
deny ip
sgt:any
dgt:any rbacl:Permit IP
permit ip
How to check the SGACL's on the switches?
Most switches use the term 'cts rbacl' in the CLI:
Prompt-3850#show cts rbacl <----- NOT displayed if enforcement is disabled!
CTS RBACL Policy
================
RBACL IP Version Supported: IPv4
name = Deny_ip-14
IP protocol version = IPV4
refcnt = 2
flag = 0x41000000
stale = FALSE
RBACL ACEs:
deny ip
name = Permit IP-00
IP protocol version = IPV4
refcnt = 2
flag = 0x41000000
stale = FALSE
RBACL ACEs:
permit ip
The N7k uses the term 'cts role-based access-list':
Prompt-N7k# show cts role-based access-list
rbacl:Deny_ip
deny ip
rbacl:Permit IP
permit ip
How to refresh the policy on network devices?
IOS/XE devices support the following commands to request a policy download from ISE:
Prompt-3850#cts refresh policy ?
peer Peer policy refresh
sgt SGT policy refresh
<cr> <cr>Prompt-3850#cts refresh policy
Policy refresh in progress
Prompt-3850#
The N7k commands are slightly different and allows specific RBACL refresh as well:
Prompt-N7k# cts refresh ?
environment-data Refresh CTS environment data
role-based-access-list Refresh CTS role-based access-lists (RBACLs)
role-based-policy Refresh CTS role-based policiesPrompt-N7k# cts refresh role-based-policy
Prompt-N7k#
What SGACL Entries (ACE's) are Supported Per Platform?
There is very little difference between IOS and IOS-XE when it comes to SGACL entry definition. However, there is quite a difference when it comes to NX-OS. These differences must be understood if the same policy is being shared with different platform types.
A spreadsheet has been created to show these differences:
TrustSec SGACLs across IOS, XE and NXOS.xlsx
How to check the enforcement counters?
Ensure that counters are enabled:
cts role-based counters enable
Most switches use the following command to check the counters:
Prompt-N7k# show cts role-based counters
RBACL policy counters enabled
Counters last cleared: Never
sgt:17(TSengineering) dgt:19(19_Prod_Srvr) [12] <----- Shows hit number
rbacl:Deny_ip
deny ip [12] <----- Shows hit number
sgt:4369(Four369) dgt:4369(Four369) [0]
rbacl:Deny_ip
deny ip [0]
sgt:4369(Four369) dgt:1001(OneThousandandOne) [6826]
rbacl:Deny_ip
deny ip [6826]
Prompt-6500#show cts role-based counters
Role-based IPv4 counters
From To SW-Denied HW-Denied SW-Permitted HW-Permitted
* * 0 0 785 3760
17 24 0 37 0 0
50 900 0 2481 0 0
50 4369 0 0 0 0
The normal counters command is broken on the 3850 and 3650 (fixed in 16.6.1), see the following section in this document for 3850 counters:
https://communities.cisco.com/docs/DOC-69479#jive_content_id_Counters_on_the_3850_and_3650
N7k Specific Information
Refer to the TrustSec N7k Troubleshooting page.
N5k Specific Information
'Clear' commands missing from CLI in N5k
The following 'clear' commands are missing from the N5k CLI:
Prompt-N7k# clear cts credentials
Prompt-N7k# clear cts pac all
Prompt-N7k# clear cts environment-data
Prompt-N7k# clear cts server
Currently investigating the supported way to clear this information.
How to verify that the SGT value, trust mode and propagate SGT are configured correctly?
Use the following command to check the FWM (Forwarding Manager) programming. Lif is 'Logical Interface'.
Prompt-N5K# show platform fwm info lif ethernet 1/3 | i cts
Eth1/3: misc cfg - CTS sgt:0x2, cts_edge:0, prop_sgt:1 cts_enable:1, cts_default_cfg:0
Eth1/3 pd gatos info: gatos cts_sgt ifacl_label rbacl_label qos_label
NOTE: sgt:0x2 is the SGT value assigned
cts_edge:0 is the trust mode, 0 is trusted.
prop_sgt:1 means the SGT is being propagated
cts_enable:1 means the config is valid and active
How to check if the N5k VLANs are enforced?
Use the following command to check the FWM (Forwarding Manager) programming:
Prompt-N5K# show platform fwm info vlan 20 | i cts
vlan 1.20: pi vlan cts_en: 1 <----- VLAN 20, cts_en: 1 means it is enforced
Capture PPF (Policy Propagation Facility) output for offline analysis
PPF (Policy Propagation Facility) is a common database, which is independent of any Application/Architecture. Mostly it’s used for client-server interaction.
For troubleshooting issues with policies not getting updated in hardware, the following command can be issued and the output forwarded as part of an escalation:
Prompt-N5K# show cts internal ppf
CTS PPF Information:
DDB version ddb_delhi_4_11_11.
db_name cts db_type 1
uuid 542 0x21e sap 400 0x190 usr_id 0xff01021e
vdc 1 init_flgs 0x139 nid_sz 4 usr_grp 0 pid 3589
db_state 0x4 ndsets 1 dbg_flags 0xff 0
etc
How to check historic TrustSec events on the N5k?
This is very similar as documented on this site for the N7k. Some options are not available like host-tracking and sgtmap, otherwise the function is the same.
Use the following link to take you to the N7k information documenting the command use:
N1kv Specific Information
See the N1kv Troubleshooting Guide (includes a section on TrustSec):
See the following section for capturing inline tag information on the N1kv:
How to Check if Device Tracking is Enabled?
Prompt-N1kv# show cts device tracking
Enabled
How to Check SGT Assignment in the N1kv?
Prompt-N1kv# show cts ipsgt entries
Interface SGT IP ADDRESS VRF/VLAN Learnt
-------------- ------ ------------ ---------- ---------
Vethernet2 11 10.10.6.20 vlan:60 Device Tracking
Vethernet3 14 10.10.6.21 vlan:60 Device Tracking
Vethernet4 19 10.10.5.22 vlan:50 Device Tracking
- 2 1.1.1.1 management SXP peer: 10.10.4.1
- 11 10.1.100.3 management SXP peer: 10.10.4.1
- 14 10.1.100.4 management SXP peer: 10.10.4.1
- 19 10.1.140.2 management SXP peer: 10.10.4.1
- 2 10.3.1.2 management SXP peer: 10.10.4.1
- 2 10.3.2.2 management SXP peer: 10.10.4.1
- 2 10.3.4.2 management SXP peer: 10.10.4.1
- 2 10.3.5.1 management SXP peer: 10.10.4.1
- 2 10.4.1.1 management SXP peer: 10.10.4.1
- 16 10.4.1.11 management SXP peer: 10.10.4.1
- 2 10.5.1.1 management SXP peer: 10.10.4.1
- 2 10.5.3.1 management SXP peer: 10.10.4.1
- 2 10.6.1.1 management SXP peer: 10.10.4.1
- 2 10.7.1.1 management SXP peer: 10.10.4.1
- 2 10.8.1.1 management SXP peer: 10.10.4.1
- 2 10.9.1.1 management SXP peer: 10.10.4.1
- 2 10.10.1.1 management SXP peer: 10.10.4.1
- 17 10.11.3.20 management SXP peer: 10.10.4.1
3850 Specific Information
Refer to the TrustSec 3850 troubleshooting page.
Cat9300/9400 Specific Information
Refer to the TrustSec Cat9300/9400 Troubleshooting page.
ASR1k Specific Information
Refer to the TrustSec ASR1k troubleshooting page.
ISR Specific Information
How to debug inline tagging?
The command to debug inline tagging on an ISR is 'debug cts platform l2-sgt rx|tx'.
The debug creates a packet dump for valid received frames.
Software release 15.5(3)M4 added an enhancement to the debug such that a received malformed packet also creates a packet dump.
Prompt-ISR#debug cts platform l2-sgt rx
CTS L2SGT RX debugging is on
Prompt-ISR#
Dec 22 15:35:56.035: cts-l2sgt_rx:cts_ether_cmd_process_receive_packet:
[in=GigabitEthernet0/3:pak=238E4EC0:size=60
Dec 22 15:35:56.035: cts-l2sgt_rx:cts_ether_cmd_process_receive_packet:
[in=GigabitEthernet0/3:pak=238E4EC0:size=60
Dec 22 15:35:56.142: cts-l2sgt_rx:cts_ether_cmd_process_receive_packet:
[in=GigabitEthernet0/0.92:pak=238E44E0:size=82
Dec 22 15:35:56.142: cts-l2sgt_rx:cts_cmd_get_pre_encap_size:[4]
Dec 22 15:35:56.142: cts-l2sgt_rx:L2CTS-RxSGT:[in=GigabitEthernet0/0.92 src=c471.fe88.2380:dst=381c.1a20.3e5c] Received SGT Assign [pak=238E44E0:flag=0x1:psgt=2]
Dec 22 15:35:56.142: cmd_dump_rx_packet:[idb=GigabitEthernet0/0.92 pak=238E44E0 size=82]
Dec 22 15:35:56.142: CMD:STARTPKTDUMP
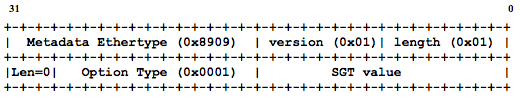
Dec 22 15:35:56.142: CMD>ver:0x01 len:0x01 len_opt:0x0001 sgt:0x0002(2) etype_or_len:0x0800 size=82
10194200: C471FE88 2380381C 1A203E5C 8100C05C Dq~.#.8.. >\..@\
10194210: 89090101 00010002 080045C0 0038640B [email protected].
10194220: 0000FF01 DE0A0A66 32120A66 32110303 ....^..f2..f2...
10194230: 2B +
Dec 22 15:35:56.142: ENDPKTDUMP
The text marked in red above can be matched to the format of the CMD header from the spec:
ASA Specific Information
Refer to the TrustSec ASA Troubleshooting page.
Cat3k Specific Information
How to show IP, MAC, VLAN and interface for a given SGT:
Prompt-3560cx#show platform cts client sgt 4369
Printing client info for sgt : 4369
-----------------------------------------------------------------------
IP Address MAC Address Vlan Interface
-----------------------------------------------------------------------
10.11.1.20 0050.5694.6365 10 GigabitEthernet1/0/1
How to show the VLAN and SGT for a given interface:
Prompt-3560cx#show platform cts vlan-sgt-info interface g1/0/1
Port number : GigabitEthernet1/0/1
----------------------------------------------------------------------------------------
VLAN SGT
----------------------------------------------------------------------------------------
10 4369
How to show SGACL programming:
Prompt-3560cx#show platform cts sgacl sgacl-label
3 1 Permit IP-00
sgacl-label sgt dgt iflabel portlabel programmed
=========== === === ======= ========= ==========
3 - 1 0 1 0 N
3 - 1 0 1 0 N
3 - 1 0 1 0 N
3 - 1 0 1 0 N
3 - 1 0 1 0 N
3 - 1 0 1 0 N
3 - 1 0 1 0 N
3 - 1 0 1 0 N
3 - 1 0 1 0 N
3 - 1 0 1 0 N
3 - 1 0 1 0 N
3 - 1 0 1 0 N
3 - 1 0 1 0 N
3 - 1 0 1 0 N
3 - 1 0 1 0 N
3 - 1 0 1 0 N
3 - 1 0 1 0 N
3 - 1 0 1 0 N
6 1 Deny_ip-14
sgacl-label sgt dgt iflabel portlabel programmed
=========== === === ======= ========= ==========
6 4369 4369 62 0 Y
How to show detailed counters:
Prompt-3560cx#show platform cts sgacl stats
-----------------------
Usage stats for policy 0xC4C3274
Policy in use by(-1, -1)
Drop : 0
Log Drop : 0
Permit : 1440
Log Permit : 0
-----------------------
Usage stats for policy 0xC4C2794
Policy in use by(4369, 4369)
Drop : 0
Log Drop : 0
Permit : 0
Log Permit : 0
-----------------------
Usage stats for policy 0xC4C23F4
Policy in use by(4369, 11)
Drop : 0
Log Drop : 0
Permit : 0
Log Permit : 0
Cat4k Specific Information
How to see the FIB programming of SGT with IP, VRF, Port and VLAN?
Prompt-4500X#show platform hardware ip route ipv4 host 10.10.52.51
-----------------------------------------------------------
Block: 0 En: true EntryMap: LSB Width: 80-Bit Type: Dst
----------------------------------------------------------- <----- Start of Destination Information (towards this IP)
000027: v4 10.10.52.51/32 --> vrf: Global Routing Table (0) <----- IP and VRF displayed
adjStats: true fwdSel: 2 Dug: 20 mrpf: 0 (None) fwdIdx: 0 ts: 0 <----- Dug 20 is the 'Destination User Group' (SGT)
adjIndex: 12 vlan: 52 port: Te1/3 (58) <----- VLAN and port displayed
fwdCtrl: 5 cpucode: 3 sifact4: FwdToCpu sifact6: FwdToCpu
sa: 74:A2:E6:8C:37:3F da: 24:01:C7:3D:A8:F4
-----------------------------------------------------------
Block: 2 En: true EntryMap: LSB Width: 80-Bit Type: Src
----------------------------------------------------------- <----- Start of Source Information (from this IP)
008245: v4 10.10.52.51/32 * --> vrf: Global Routing Table (0) <----- IP and VRF displayed
defaultRoute: false (None)
L2 SrcIndexCheckAction: 0; L2SrcIndex: 20 sugValid: true Sug: 20 ts: 0 <----- Sug 20 is the 'Source User Group' (SGT)
How to Check if Destination Mapping Can be Derived from an IP Address?
Remember that we can only have 2000 IP-SGT mappings for DGT derivation for switched traffic on the Cat4k (no such limit exists for routed traffic).
If the output is as below then the DGT can be derived for this IP:
Prompt-4500x#show platform hardware acl input entries lookup rolebased sw-allocated | inc Dst
IP Dst : 1.1.1.1 / 255.255.255.255
IP Dst : 1.1.1.4 / 255.255.255.255
IP Dst : 10.9.2.1 / 255.255.255.255
IP Dst : 10.3.1.2 / 255.255.255.255
IP Dst : 10.3.2.2 / 255.255.255.255
IP Dst : 10.3.4.2 / 255.255.255.255
IP Dst : 10.3.5.1 / 255.255.255.255
Cat6k Specific Information
If you need further information on ingress and egress mode on the Cat6k, see here:
How to Check Device Tracking Information on the Cat6k?
Prompt-6500#show device-tracking database
Binding Table has 1 entries, 1 dynamic
Codes: L - Local, S - Static, ND - Neighbor Discovery, DH - DHCP, PKT - Other Packet, API - API created
Preflevel flags (prlvl):
0001:MAC and LLA match 0002:Orig trunk 0004:Orig access
0008:Orig trusted trunk 0010:Orig trusted access 0020:DHCP assigned
0040:Cga authenticated 0080:Cert authenticated 0100:Statically assigned
Network Layer Address Link Layer Address Interface vlan prlvl age state Time left
ARP 10.8.1.20 0050.568f.01af Gi4/24 10 0005 5s REACHABLE 299 s
Prompt-6500#show device-tracking events
[Wed Sep 07 16:16:24.000] SSID 0 FSM Binding table running for event VALIDATE_LLA in state REACHABLE
[Wed Sep 07 16:16:24.000] SSID 0 FSM Binding table running for event LLA_RCV in state REACHABLE
[Wed Sep 07 16:16:25.000] SSID 0 FSM Binding table running for event VALIDATE_LLA in state REACHABLE
[Wed Sep 07 16:16:25.000] SSID 0 FSM Binding table running for event LLA_RCV in state REACHABLE
How to check TCAM on the 6500
Prompt-6500#show platform hardware cpacity acl
Classification Mgr Tcam Resources
Key: Ttlent - Total TCAM entries, QoSent - QoS TCAM entries, LOU - LOUs,
RBLent - RBACL TCAM entries, Lbl - Labels, TCP - TCP Flags,
Dstbl - Destinfo Table, Ethcam - Ethertype Cam Table,
ACTtbl - Accounting Table, V6ext - V6 Extn Hdr Table
Module Ttlent QoSent RBLent Lbl LOU TCP Dstbl Ethcam ACTtbl V6ext
1 27% 7% 0% 1% 1% 0% 2% 0% 0% 0%
3 27% 7% 0% 1% 1% 0% 1% 0% 0% 0%
4 27% 7% 0% 1% 1% 0% 2% 0% 0% 0%
How to monitor Inline Tagging on Cat6k Sup2T?
The NetDriver debugging tool can be used to display the inline tags being used on the Sup2T:
Prompt-6500#debug netdr capture source-ip-address 10.11.2.20
Prompt-6500#show netdr captured-packets
A total of 5 packets have been captured
The capture buffer wrapped 0 times
Total capture capacity: 4096 packets
------- dump of incoming inband packet -------
l2idb NULL, l3idb Te3/2, routine inband_process_rx_packet, timestamp 12:29:54.111 <----- Shows interface
dbus info: src_vlan 0x3F4(1012), src_indx 0x81(129), len 0x4E(78)
bpdu 0, index_dir 0, flood 0, dont_lrn 0, dest_indx 0x7FAD(32685), CoS 0
cap1 0, cap2 0
A0020900 03F40400 00810000 4E000000 1E000434 23000004 11110000 7FAD1B0E <----- SGT displayed here, HEX 1111 = DEC 4369
destmac 00.06.F6.EB.55.40, srcmac C8.00.84.74.F9.41, shim ethertype CCF0
earl 8 shim header IS present:
version 0, control 64(0x40), lif 16402(0x4012), mark_enable 1,
feature_index 0, group_id 0(0x0), acos 0(0x0),
ttl 15, dti 4, dti_value 2(0x2)
10080248 0003C080 0002
ethertype 0800
protocol ip: version 0x04, hlen 0x05, tos 0x00, totlen 48, identifier 13268
df 1, mf 0, fo 0, ttl 127, src 10.11.2.20, dst 54.243.157.108
tcp src 55621, dst 80, seq 507964637, ack 0, win 8192 off 7 checksum 0x9DE7 syn
Prompt-6500#no debug netdr capture
Prompt-6500#debug netdr clear-capture
Prompt-6500#debug netdr capture destination-ip-address 10.11.2.20
Prompt-6500#show netdr captured-packets
A total of 7 packets have been captured
The capture buffer wrapped 0 times
Total capture capacity: 4096 packets
------- dump of outgoing inband packet -------
l2idb NULL, l3idb Te3/2, routine etsec_tx_pak, timestamp 12:47:39.506 <----- Shows interface
dbus info: src_vlan 0x3F4(1012), src_indx 0x380(896), len 0x56(86)
bpdu 0, index_dir 0, flood 0, dont_lrn 0, dest_indx 0x0(0), CoS 0
cap1 0, cap2 0
00020000 03F4A800 03800000 56000000 00000000 00000000 00020000 00000000 <----- SGT displayed here, HEX 2 = DEC 2
destmac C8.00.84.74.F9.41, srcmac 00.06.F6.EB.55.40, shim ethertype CCF0
earl 8 shim header IS present:
version 0, control 0(0x0), lif 16391(0x4007), mark_enable 0,
feature_index 0, group_id 0(0x0), acos 0(0x0),
ttl 15, dti 0, dti_value 557074(0x88012)
000800E0 0003C008 8012
ethertype 0800
protocol ip: version 0x04, hlen 0x05, tos 0x00, totlen 56, identifier 11800
df 0, mf 0, fo 0, ttl 255, src 10.11.1.1, dst 10.11.2.20
icmp type 3, code 1
Prompt-6500#no debug netdr capture
Prompt-6500#debug netdr clear-capture
How to troubleshoot/trace SGT and SGACL behavior on a 6500?
The following command can be used to determine the behaviour of certain SGT's and SGACL's.
As well as icmp, IP protocol number, udp or tcp can be selected using different ports.
Prompt-6500#cts role-based policy trace ipv4 icmp host 10.11.2.20 host 10.1.100.3
Input Qualifiers:
====================
Packet Parameters:
=====================
Protocol : ICMP
Source IP Address : 10.11.2.20
Destination IP Address : 10.1.100.3
Result:
==========
Source IP: 10.11.2.20 SGT: 4369 Source:SXP <----- Displays Source IP and relevant SGT
Destination IP: 10.1.100.3 SGT: 11 Source:CLI <----- Displays Destination IP and relevant SGT
For <SGT, DGT> pair <4369, 11> :
Applicable RBACL : Deny_ICMP-10 <----- Displays associated SGACL
IE4k/5k Specific Information
Check and set the right SDM Template
For enforcement to operate, the SDM template cannot be the default template, it needs to be 'routing'.
To check template: Prompt-IE4K#show sdm prefer
To set template: Prompt-IE4K(config)#sdm prefer routing
Note: after changing the template, a reload is required.
ISE Specific Information
ISE monitoring and troubleshooting guide
See the following links for ISE monitoring and troubleshooting guide.
ISE 2.0:
IS 2.1:
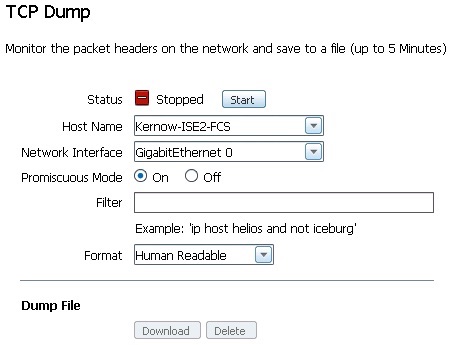
Using TCP Dump on ISE
The Diagnostic Troubleshooting Tools found at Operations > Troubleshoot > Diagnostic Tools are explained in the document links above.
One tool is 'TCP Dump' which is very useful to capture information entering and exiting the ISE interface.
Data can be captured to be read by Wireshark or can be captured to be human readable:
Once started, ISE displays the growing file size:
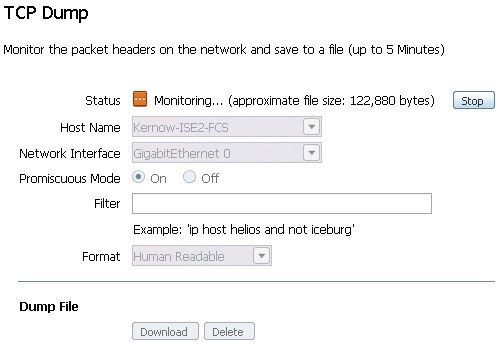
Once the capture is stopped, it can be displayed on the screen if captured in human readable format.
An example RADIUS Access Request and Access Accept is displayed below:
17:40:15.734268 IP (tos 0x0, ttl 252, id 2935, offset 0, flags [none], proto UDP (17), length 583)
10.4.1.3.datametrics > Kernow-ISE2-FCS.radius: RADIUS, length: 555
Access Request (1), id: 0x20, Authenticator: 13a8c51fdbc02e88cc3b20ebe043a62b <----- Access Request received by ISE
Vendor Specific Attribute (26), length: 211, Value: Vendor: Cisco (9)
Vendor Attribute: 1, Length: 203, Value: cts-pac-opaque=...............E_Y....ce5.(..........k7.........$.......V.....:€....d.v(L"`-.2/.n.l..2........l....\.&.'.%......;.:....W.]..7...D.....Xs.........W.......v../..f....w...........;RqYZ..J,...
Username Attribute (1), length: 19, Value: [email protected] <----- Username
Service Type Attribute (6), length: 6, Value: Framed
Vendor Specific Attribute (26), length: 27, Value: Vendor: Cisco (9)
Vendor Attribute: 1, Length: 19, Value: service-type=Framed
Framed MTU Attribute (12), length: 6, Value: 1500
Called Station Attribute (30), length: 19, Value: 20-BB-C0-A2-02-81 <----- Called MAC i.e. access switch MAC
Calling Station Attribute (31), length: 19, Value: 00-0C-29-5E-49-32 <----- Calling MAC i.e. client MAC
EAP Message Attribute (79), length: 8, Value: ..
Message Authentication Attribute (80), length: 18, Value: .}P&...}......0V
Unknown Attribute (102), length: 2, Value:
Vendor Specific Attribute (26), length: 49, Value: Vendor: Cisco (9)
Vendor Attribute: 1, Length: 41, Value: audit-session-id=0A04010300000FAD000344D6
Vendor Specific Attribute (26), length: 20, Value: Vendor: Cisco (9)
Vendor Attribute: 1, Length: 12, Value: method=dot1x
Framed IP Address Attribute (8), length: 6, Value: 10.4.1.10 <----- Client IP
NAS IP Address Attribute (4), length: 6, Value: 10.4.1.3 <----- NAS IP
NAS Port ID Attribute (87), length: 22, Value: GigabitEthernet1/0/1 <----- NAS port the client is connected to
NAS Port Type Attribute (61), length: 6, Value: Ethernet
NAS Port Attribute (5), length: 6, Value: 50101
State Attribute (24), length: 85, Value: 37CPMSessionID=0A04010300000FAD000344D6;40SessionID=Kernow-ISE2-FCS/247952818/1687;
17:40:15.777548 IP (tos 0x0, ttl 64, id 0, offset 0, flags [DF], proto UDP (17), length 402)
Kernow-ISE2-FCS.radius > 10.4.1.3.datametrics: RADIUS, length: 374
Access Accept (2), id: 0x20, Authenticator: 1b8e0e0857195bcde1b358f29c753d6a <----- Access Accept sent by ISE
Username Attribute (1), length: 8, Value: tseng1 <----- Username
State Attribute (24), length: 40, Value: ReauthSession:0A04010300000FAD000344D6
Class Attribute (25), length: 62, Value: CACS:0A04010300000FAD000344D6:Kernow-ISE2-FCS/247952818/1687
EAP Message Attribute (79), length: 6, Value: ..
Message Authentication Attribute (80), length: 18, Value: G...8.........~.
Unknown Attribute (102), length: 67, Value:
Vendor Specific Attribute (26), length: 37, Value: Vendor: Cisco (9)
Vendor Attribute: 1, Length: 29, Value: cts:security-group-tag=1111-1 <----- SGT assigned in hex 1111 hex = 4369 dec
Vendor Specific Attribute (26), length: 58, Value: Vendor: Microsoft (311)
Vendor Attribute: 16, Length: 50, Value: .4..x ..,..+.GD."&.Gj€.WI&.<........6.{....5Qe.a..
Vendor Specific Attribute (26), length: 58, Value: Vendor: Microsoft (311)
Vendor Attribute: 17, Length: 50, Value: .o...H.C.......$....r...J.........c.@#YZC.\Y..:R,.
How to monitor ISE-ACI message exchange
The following ACI report in ISE is very useful: Operations > Reports > TrustSec > TrustSec ACI:

- Mark as Read
- Mark as New
- Bookmark
- Permalink
- Report Inappropriate Content
This is indeed a good Doc!
I appreciate a lot with lots of Kiddos.
- Mark as Read
- Mark as New
- Bookmark
- Permalink
- Report Inappropriate Content
Hello, seems like the link is broken:
[email protected] wrote:The normal counters command is broken on the 3850 and 3650 (fixed in 16.6.1), see the following section in this document for 3850 counters:
https://communities.cisco.com/docs/DOC-69479#jive_content_id_Counters_on_the_3850_and_3650
The above link does not work. The correct link is:
TrustSec 3850 Specific Troubleshooting Information
Find answers to your questions by entering keywords or phrases in the Search bar above. New here? Use these resources to familiarize yourself with the community: