- Cisco Community
- Technology and Support
- Security
- Security Knowledge Base
- Cisco Vulnerability Management APIs to Query Connector Run Details
- Subscribe to RSS Feed
- Mark as New
- Mark as Read
- Bookmark
- Subscribe
- Printer Friendly Page
- Report Inappropriate Content
- Subscribe to RSS Feed
- Mark as New
- Mark as Read
- Bookmark
- Subscribe
- Printer Friendly Page
- Report Inappropriate Content
on
02-01-2023
11:08 AM
- edited on
05-04-2023
03:21 PM
by
Katie Kolon
![]()
The Cisco Vulnerability Management APIs provide our customers with a lot of flexibility and many possibilities for interacting with the Cisco Vulnerability Management platform. The Cisco Vulnerability Management API documentation page is a good starting point, even if you have minimal coding experience.
Tools such as Postman can help you quickly start interacting with the platform. We’ve also made this easier to use by providing a Postman collection, which, if nothing else, saves you loads of typing. If all this still sounds too complex, the API docs page allows you to test and pull information directly from the browser, as shown in the included videos.
This article will review the endpoints available under “Connector Runs” on our API Page. For those of you heavy API users, you may or may not have noticed the API endpoints for querying connector run details. These endpoints are important because they provide much more detail than what’s available in the UI.
Getting your API Key
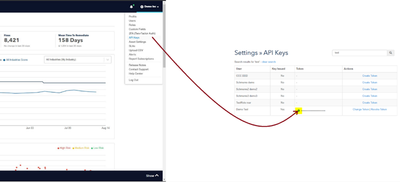
Cisco Vulnerability Management Admins can create, manage, and copy API keys by following the steps below. If you are not an Admin, please get in touch with one of yourCisco Vulnerability Management Admins to request a key. API Keys are available only for our standard user roles. API keys may only be copied the first time they are created. If you, or someone else, lost a key, the key will need to be regenerated. Read more about API Key Generation and Permissions here.
Copy an API Key
From the Cisco Vulnerability Management Platform, go to Settings > API Keys
Best Practices for Using your API Key
We recommend changing/revoking your API key after you are done with your testing. Do not share your key with other people. It is personal, and actions taken with this key will be logged to the user of the key.
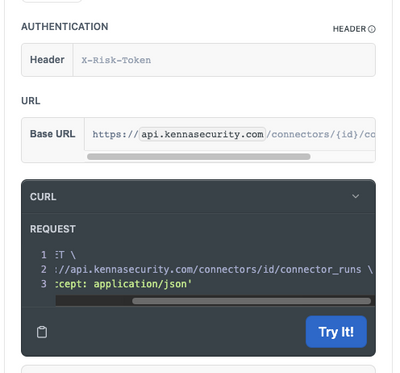
After getting your hands on an API key, you can go to the Cisco Vulnerability Management API webpage and start running commands. You will need to add your API key to the header in the box under “Authentication.” Any of the below commands can be done directly on the Cisco Vulnerability Management API page using the “Try It” button. Alternatively, you can copy the curl command using the clipboard icon in the Try It box.
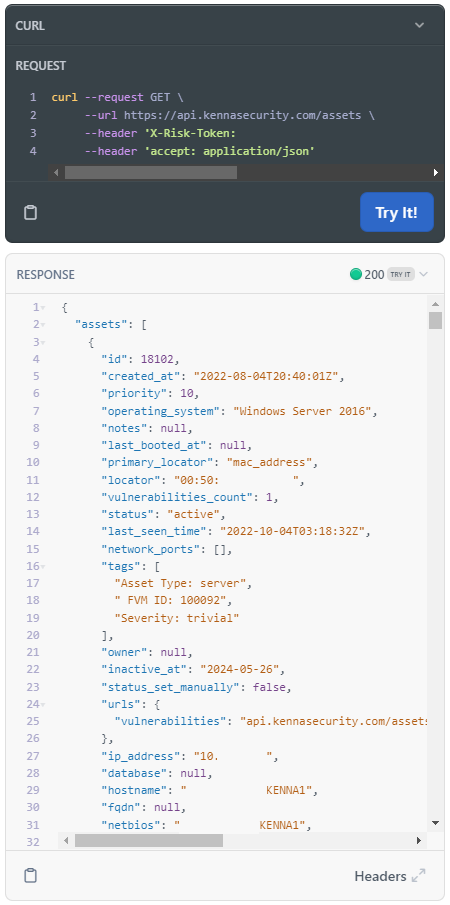
When using the "Try It!" bottom on the API page, you can receive great information about any of your searches. Here is one that I ran against the Assets > List Assets endpoint:
CAUTION: If you use an endpoint to delete/remove/add/update information, and the API key has the required write permissions, it will be reflected in your environment. The Cisco Vulnerability Management API webpage is not a test instance; it directly interacts with your company’s instance.
Using the Connector Endpoints
List Connectors
The first endpoint that will be discussed is the List Connectors endpoint. This endpoint will give you a list of all the connectors you have configured in your environment. The only thing you need to run this query is your API Key.
curl --request GET \
     --url https://api.kennasecurity.com/connectors \
     --header 'X-Risk-Token: ADD TOKEN HERE' \
     --header ‘accept: application/json’
List Connector Runs
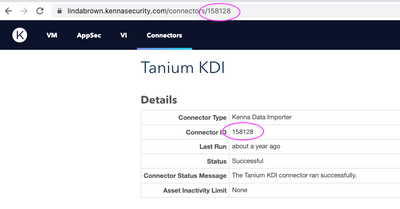
Using the List Connector Runs endpoint, you can find details on all the connector runs, including the Connector Run ID. To list the connector runs of a particular connector, you will need a Connector ID. In the above List Connectors endpoint response, you will see the Connector ID next to each connector in your environment. You can also find this ID on any connector detail page in the platform.
NOTE: If you do not see the Connector tab at the top of the page, you do not have permission and will need to contact your admin to give you access or the Connector ID information.
Grab the ID and replace it in the curl command below, replacing the ‘id’ with the Connector ID you want to query. The command will return details on every connector run related to that Connector ID used.
curl --request GET \
     --url https://api.kennasecurity.com/connectors/id/connector_runs \
     --header 'X-Risk-Token: ADD TOKEN HERE' \
     --header ‘accept: application/json’
Show Connector Run
If you are interested in a specific run and already have the Connector Run ID you can use the Show Connector Run endpoint to receive details on only one specific connector run. The List Connector Runs endpoint lists all runs with run IDs and details, but this may be overwhelming to sort through. You can grab just the Connector Run ID you want to investigate and use it with the Show Connector Run endpoint. If you do not know which run is the one you need, contact support or your Customer Success Team to find it for you. They will need some refining details such as time and type of connector.
You will need both the Connector ID and the Connector Run ID to run this curl command. Replace ‘connector_id’ and ‘connector_run_id’ with those two numbers in the curl command below. This will return details on the specific connector run only.
curl --request GET \
     --url https://api.kennasecurity.com/connectors/connector_id/connector_runs/connector_run_id \
     --header 'X-Risk-Token: ADD TOKEN HERE' \
     --header ‘accept: application/json’
Understanding Connector Run Details
WOW! Now we have lots of data, but what does it all mean? The chart below explains each field.
| Field Name | Explanation |
| Start Time | When the connector run started – all times in UTC |
| End Time | When the connector run ended – all times in UTC |
| Success | True or False > Failed connector runs can still update vuln data stored in Cisco Vulnerability Management. Once published, it is stored. |
| Total Payload Count | The count of payloads created as a result of the connector run. This is an interface document. It is usually an asset with 0 or more vulns. Payloads with no asset data will cause the payload to be rejected. |
| Processed Payload Count | After a worker picks up the payload, it is considered “processed”. Deduplication happens during “processing”. This typically matches the “Total Payload Count”. |
| Failed Payload Count | Number of failed payloads. |
| Failed Payload Percentage | From the total payloads, this one shows the failed percentage. |
| Processed Assets Count | This is generally a result of deduplication and will be less than the payload count. |
| Assets with Tag Reset | The count of assets affected by tag reset on a connector. This is a connector-run configuration. |
| Processed Scanner Vulnerabilities | Aggregated vulnerabilities found within the total payload. |
| Scanner Vulnerabilities Created Scanner Vulnerabilities Updated Scanner Vulnerabilities Closed Scanner Vulnerabilities Autoclosed Scanner Vulnerabilities Reopened |
Change metrics tallied from the connector run. For the first full run, most figures are generally 0. Upon subsequent connector runs, the various metrics are incremented depending on the vulns found in the run. |
| Vulnerability Reopened | Aggregation of the “Scanner Vulnerabilities”? |
| Vulnerability Autoclosed | Aggregation of the “Scanner Vulnerabilities”? |
We hope this provided more detail into how a lot of information can be obtained on the status of your connector runs, as well as guide those that may just be starting out with the use of APIs in general with a soft introduction into the power of these APIs, and how they can be used. For more information on the Cisco Vulnerability Management APIs check out the Cisco Vulnerability Management Security API Blogs!
- Mark as Read
- Mark as New
- Bookmark
- Permalink
- Report Inappropriate Content
Other Connector posts:
Find answers to your questions by entering keywords or phrases in the Search bar above. New here? Use these resources to familiarize yourself with the community:


