- Cisco Community
- Technology and Support
- Security
- Security Knowledge Base
- Troubleshooting VPN issues on ASR - where to start.
- Subscribe to RSS Feed
- Mark as New
- Mark as Read
- Bookmark
- Subscribe
- Printer Friendly Page
- Report Inappropriate Content
- Subscribe to RSS Feed
- Mark as New
- Mark as Read
- Bookmark
- Subscribe
- Printer Friendly Page
- Report Inappropriate Content
04-21-2011 04:14 AM - edited 08-29-2017 02:36 AM
- 1. About this document.
- 2. Agenda.
- 3. Control plane.
- 4 Data plane.
- Further reading:
- Feedback/comments/flames?
Disclaimer: This is a work in progress and may contain mistakes/typos. Corrections will be added as feedback is received.
1. About this document.
This document will attempt to give a bird's eye view on troubleshooting ASR 1000 VPN issues.
It contains what you can collect before opening a TAC case to troubleshoot VPN problems on ASR1k, which will speed up time to resolution.
2. Agenda.
In this document we will discuss data and control plane aspects.
This document is not intended to explain architecture or performance considerations, but rather to provide tips on narrowing down the problem.
If you're interested in information about VPN performance or throughput of devices please go to:
3. Control plane.
Control plane is everything that is related to establishing, keeping up and tearing down the actual IPsec tunnel.
ASR, at a certain level, is using same IKE (v1 and v2) implementation as all other routers in our portfolio.
It's a bit different due to the way it interacts with architecture of the device.
For the most part the usual IKE debugs are the same and are helpful
debug crypto isakmp
debug crypto ipsec
debug crypto kmi
! And for getvpn
debug crypto gdoi
Same "show" commands apply.
show crypto isa sa
show crypto ipsec sa
show crypto map
! And for getvpn
show crypto gdoi
However what you need to be aware of is that show commands counters, especially the ones showing forwarding (show crypto ipsec sa for example) are not read in real time from data plane. Those counters are either not refreshed or refreshed periodically.
Part of control plane mechanism programing the data plane is POLO (as in POlicy LOader) and IKEA (IKE-A, not the furniture manufacturer).
Debugging and show commands for policy loader and IKEA are hidden and are to be enabled by TAC or development.
4 Data plane.
Data plane is everything related to forwarding. The tunnel is already up and we want to send packets trough the tunnel.
The data plane on ASR1k is created to provide fast throughput and neatly divided, however in many cases similar to other platforms.
Following components are used (high level, does not fully reflect actual architecture)
Nitrox hardware chips. Which receive packets for encryption from ->
-> QPF and ESP (ASR's data plane and switching processor), which in turn is being programmed by ->
-> IOSd/RP/CPU/control plane (multiple names exists used in different contexts)
4.1 QFP statistics.
4.1.1 General information about packet drop on QFP
If you're suspecting problem on data plane (i.e. with passing traffic through the box) the first step you need to do is collect drop statistics from the dataplane:
ASR#show plat hard qfp act stat drop [clear]
-------------------------------------------------------------------------
Global Drop Stats                         Packets                  Octets
-------------------------------------------------------------------------
Icmp                                            1                      58
IpFormatErr                                     2                     699
IpTtlExceeded                                8238                  600162
IpsecTailDrop                               36135                 4051194
Ipv4NoAdj                                     813                   55131
Ipv4NoRoute                                 12637                 2031706
Ipv4Null0                                     309                   32063
TailDrop                                  1168859              1569972556
TcpBadfrag                                    122                    7808
UnconfiguredIpv4Fia                         15708                 1461622
In this particular case, by executing the command a few times in a row you will find that IpsecTailDrop and TailDrop are increasing. Which means there is a queue overflowing.
Let's have a look at another case:
ASR#sh plat hard qfp act stat drop | e _0_
----------------------------------------------------------------
Global Drop Stats                         Octets         Packets
----------------------------------------------------------------
  IpsecInput                          38848546           29749
What you are looking most of the time in case of IPsec packet drop is anything containing phrase "Ipsec".
4.1.2 IPsec drops
If you're trying to understand drops specific to ipsec feature you should investigate following output )
ASR#sh pl ha qf ac fe ipsec data drop [clear]------------------------------------------------------------------------
Drop Type  Name                                     Packets
------------------------------------------------------------------------
       30  IN_V4_POST_INPUT_POLICY_FAIL                                8
What we get from above output is how many packets were dropped (8) and with what reason.
Unfortunately there is no comprehensive guide with drop reasons, but TAC engineers very often leave notes about drop reasons inside bug notes.
It's a good method to start, but not always 100% accurate.
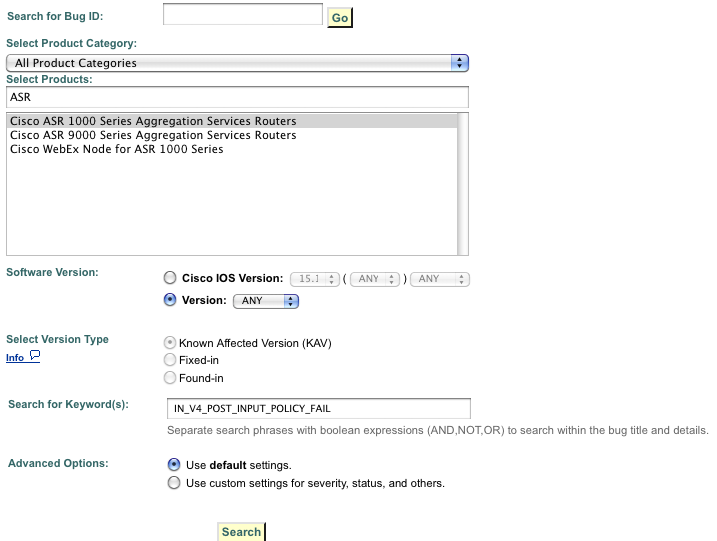
So I've done following test. I took the drop type and put it into Cisco Bug toolkit's search engine and found a bug.
Cisco bug toolkit is available at: http://tools.cisco.com/Support/BugToolKit/action.do?hdnAction=searchBugs
How I searched (image)
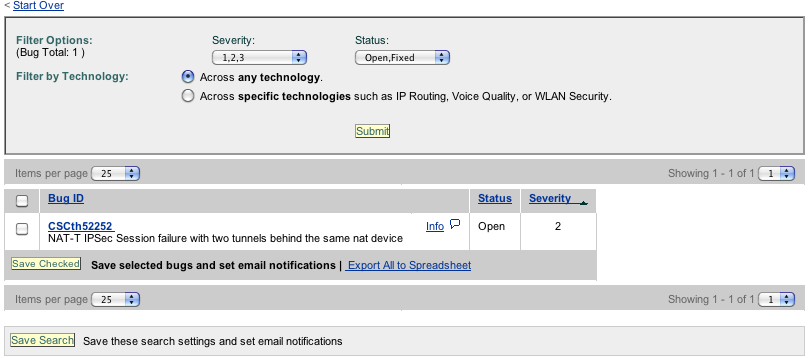
And here is the reult I got (image)
4.1.3 Aggregate interface drops.
Following command will show you aggregate per-interface drops count:
ASR#show platform hardware qfp active interface all statistics drop_summary [clear_drop] [detail]
----------------------------------------------------------------
Drop Stats Summary:
note: 1) these drop stats are only updated when PAL
         reads the interface stats.
      2) the interface stats include the subinterface

Interface                                       Rx Pkts             Tx Pkts
---------------------------------------------------------------------------
GigabitEthernet0/0/0                                352                   0
Tunnel1                                              17                   0
4.2 Hardware accelerator.
As with every interface the connection between QFP and nitrox chip can be polled for information.
By now you probably have seen that accelerator in ASR behaves a bit differently than on other platforms:
ASR#show cry eli
Hardware Encryption : ACTIVE
Number of hardware crypto engines = 1
CryptoEngine ASR1000-ESP(14) details: state = Active
Capability : DES, 3DES, AES, RSA, IPv6, GDOI, FAILCLOSE
IKE-Session : 0 active, 9999 max, 0 failed
DH : 0 active, 9999 max, 0 failed
IPSec-Session : 0 active, 19998 max, 0 failed
ASR#sh cry engine configuration
crypto engine name: Cisco VPN Software Implementation
crypto engine type: software
serial number: A7F94089
crypto engine state: installed
crypto engine in slot: N/A
platform: Cisco Software Crypto Engine
crypto lib version: 20.0.0
You can have a look at following output, which should give you information about interface between nitrox and QFP
ASR#show plat hard qfp act infrastructure bqs queue output default interface internal0/0/crypto:0
What you're interested here is to see whether "tail drops" (too many packets in buffer) and "total enqs" (emount of packets sent to crypto interface) are increasing.
You can also try to understand the statistics of accelerator itself by doing:
ASR# show plat soft ipsec fp act encryption-processor stati
or (depending on version)
ASR#sho plat hardware crypto-device statistics
However, those commands will be typically taken by TAC and interpreted by development.
Let's have a look at a example:
ASR#show plat soft ipsec fp act encryption-processor stati
Forwarding Manager Encryption-processor Statistics

(P) - # of packets; (B) - # of bytes

STX1 enabled
ENABLED_CORES    : 0x000007
AVAILABLE_CORES  : 0x000005
OK SPI1 RX(P)    :              2304818, OK SPI1 RX(B)    :           1539969323
ERR SPI1 RX(P)   :                    0
DROP SPI1 RX(P)  :                    0, DROP SPI1 RX(B)  :                    0
OK PCI RX(P)     :              3270661, OK PCI RX(B)     :            234547278
PROCESSED(P)     :              5575454, PROCESSED(B)     :           9057469179
ENCRYPTED(P)     :              1176591, ENCRYPTED(B)     :            818667979
DECRYPTED(P)     :              1128203, DECRYPTED(B)     :            702855736
GEN. PURPOSE(P)  :              3270661, GEN. PURPOSE(B)  :            208381990
PASS-THR(P)      :                    0, DECR PASS-THR(P) :                    0
SPI1 TX(P)       :              2304620, SPI1 TX(B)       :           1543946214
L2/3 DROPPED(P)  :                    0
FWD ERR DOS(P)   :                    0, FWD ERR N-DOS(P) :                    0
POM_COUNT        :                  198
POM_ROBQ_EMPTY   : 0xffffffff
POM_INQ_EMPTY    : 0xffffffff
POM_TX1_OUTQ_EMPTY : 0x01ffff
MEM_MBE          :        0
MEM_SBE          :        0
MEM_FAILURE_ADDR : 00000000
The key information to take from this output is:
1) Are there cores available to process traffic?
2) Is the engine actually encrypting and decrypting traffic.
(The relevant parts are in bold)
Further reading:
ASR product page:
http://www.cisco.com/en/US/partner/products/ps9343/tsd_products_support_series_home.html
ASR 3S configuration guide for VPNs:
Feedback/comments/flames?
Leave a comment.
- Mark as Read
- Mark as New
- Bookmark
- Permalink
- Report Inappropriate Content
Excellent document. I just forwared it to my cust.
Regards
- Mark as Read
- Mark as New
- Bookmark
- Permalink
- Report Inappropriate Content
thanks for the document. good one
Find answers to your questions by entering keywords or phrases in the Search bar above. New here? Use these resources to familiarize yourself with the community: