- Cisco Community
- Technology and Support
- Service Providers
- Service Providers Knowledge Base
- ASR9000/XR: Local Packet Transport Services (LPTS) CoPP
- Subscribe to RSS Feed
- Mark as New
- Mark as Read
- Bookmark
- Subscribe
- Printer Friendly Page
- Report Inappropriate Content
- Subscribe to RSS Feed
- Mark as New
- Mark as Read
- Bookmark
- Subscribe
- Printer Friendly Page
- Report Inappropriate Content
on 02-28-2012 05:58 AM
Introduction
IOS devices have the concept of control plane policing. IOS-XR doesn't use that concept but instead uses a very comprehensive and powerful Local Packet Transport Services. In this document it is explained how LPTS works and how you can work with it, monitor and verify it.
Core Issue
LPTS is the concept of reflexive ACL's, punt policers and has an "internal" FIB or iFIB that directs certain packets to various nodes. IOS-XR can handle certain traffic on the linecard (such as BFD, Netflow and ARP) and these packets are instructed by LPTS to be handled by the local CPU rather then the RSP CPU.
At the same time, there are ACL's in place that allow for instance the punting of Telnet traffic and then per host if configured so, but another component of LPTS called MPP, the Management Plane Protection.
Generally, the default values for LPTS provide the level of protection you are after. However there are some rare circumstances whereby you want to tune the values of LPTS in order to get the service levels you need. LPTS is very dynamic in nature and pierces holes into the protection system as particular items are configured.
The LPTS policers work on a per NP basis. So if the LPTS police value is set to 1000pps that means that every NP on the LC can punt with 1000pps to the RSP CPU or LC CPU. This is something to take into consideration when evaluating the A9K-8T-x cards who have 8 NPU's per LC.
Take extreme care when changing the LPTS policer values.
High level overview
From a birds eye view, LPTS looks like this:
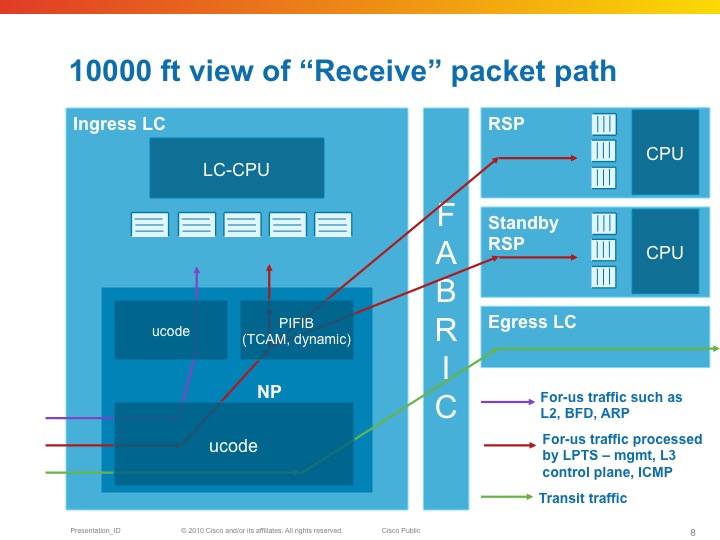
The NPU has a table that tells it where to send packet to (LC or RSP) as part of the "internal FIB" or iFIB. These packets are punted at a pre-defined rate, they can be tuned in XR release 4.x and later. Also in the TCAM which is used in the ASR9K for ACLs (amongst others), are lists that define which packets we want to allow and not. This will be discussed in the MPP section of this document.
| LPTS is composed of a (set of) dynamic ACL's (which are created as part of user configuration dynamically, or automitcally inserted as peerings establish), an internal "routing table" (iFIB) and a set of policers for different punt reasons. |
|---|
LPTS Characteristics
So for-me packets are undergoing the Pre iFIB classification and policing upon which they are directed by the iFIB, which is the second level of filtering to the destination node.
LPTS Firewalling
One of the great strenghts with LPTS is the dynamic ACL creation. This is configuration driven and no user intervention is required.
In addition to that, LPTS has different flow categories based on the state of the protocol. For instance, BGP has 3 different states:
- Unknown
- Configured
- Established
Unknown is the flow whereby we have TCP port 179 traffic, but we have no neighbor configured from that source. Policed very heavily.
Configured is the entry whereby we know the source address of the peer, but the session is not yet established (no known source port from the peer), Policed moderately.
Established is where we have all the L3 and L4 data from the session. Lightly policed.
The entries for configured is driven by the configuration of the neighbor statement under the router BGP section.
Established is dynamically inserted when the peer establishes.
You could theoretically police the unknown to a rate of zero.
Example:
Router bgp
neighbor 192.168.1.1
…
!
The following table can be seen with the output of the command:
show lpts pifib hardware entry brief loc 0/3/cpu0 | i 179
| Local | Port | Remote | Port | Rate | State |
|---|---|---|---|---|---|
| any | 179 | ANY | ANY | 100 | unknown |
| any | 179 | 192.168.1.1 | ANY | 1,000 | configured |
| 192.168.1.2 | 179 | 192.168.1.1 | 2223 | 10,000 | established |
If you use the command
RP/0/RSP0/CPU0:A9K-TOP#show lpts pifib hardware entry location 0/3/CPU0 | be 33.33.1
You can check the detailed entry of the PiFIB (policer)
Source IP : 33.33.1.1 the remote address
Is Fragment : 0 fragments allowed
Interface : any expected source interface
M/L/T/F : 0/IPv4_STACK/0/BGP-known
DestNode : 48 where the packets are sent to
DestAddr : 48
L4 Protocol : TCP
TCP flag byte : any additional security checks at TCP level
Source port : Port:179
Destination Port : 11293
Accepted/Dropped : 117866/0 packets accepted and denied
# of TCAM entries : 1 number of tcam entries burnt for this PiFIB entry
HPo/HAr/HBu/Cir : 1924676/2500pps/2500ms/2500pps
State : Entry in TCAM status of the entry
Configuring LPTS police rates
You can configure the LPTS Policers on a PiFIB bases and also the punt policers can be adjusted.
The following commands apply. Note that this is on a per linecard basis. All NPU's on that linecard will get reconfigured.
RP/0/RSP0/CPU0:A9K-BNG(config)#lpts punt police location 0/0/CPU0 protocol ?
arp ARP packets
bfd Bidirectional Forwarding Detection packets
cdp Cisco Discovery Protocol packets
cfm Connectivity Fault Management Protocol packets
cgmp Cisco Group Management Protocol packets
dhcp Dynamic Host Configuration Protocol packets
efm Ethernet in the First Mile Protocol packets
igmp-snoop Internet Group Management Protocol Snoop packets
ipiw-arp L2VPN IPIW ARP packets
ipv4 IPv4 packets
ipv6 IPv6 packets
lacp Bundle Protocol packets
mofrr Multicast-only FRR packets
mpls MPLS punt packets
mstp Multiple Spanning Tree Protocol packets
mvrp Multiple VLAN Registration Protocol packets
ppp Point-to-Point Protocol packets
pppoe Point-to-Point Protocol over Ethernet packets
rarp Reverse ARP packets
vccv Virtual Circuit Connection Verification packets
vidmon Video Monitoring packets
vidmon-flow-add Video Monitoring flow add packets
Exception packets can be reconfigured by the following command: lpts punt police location 0/0/CPU0 exception
Glean adjacency or ACL-deny packets can be tuned for instance via that command.
The PIFIB can be reconfigured via the following commands:
RP/0/RSP0/CPU0:A9K-BNG(config)#lpts pifib hardware ...
- In there you can enter the linecard you wish to specifically reconfigure
- The policer flow values
- And the TCAM entries (this is new in XR420)
- As you've seen LPTS can dynamically create "ACL" entries for dynamic firewalling and for MPP. This command limits the number of TCAM entries that LPTS can use so that space is available for other purposes such as regular ACL's, QOS matching, EFP matching etc.
LPTS static-police and police differences
The command “police” is used to check policer values, accept/drop counts for packets matching LPTS TCAM(mostly L3 packets) entries whereas “static-police” is used to check policer values.
Accept/drop counts for packets matching static punt reasons programmed in search structures (Mostly L2 and exception packets).
“policer” is for dynamic flows (like BGP, OSPF, etc protocols directed by RSP)
“static-policer” is for pseudo Static flows (like BFD, CFM directed by the LC) These are hard-coded and include Exception processing packets.
There is a CLI to change few of the exception processing as well (for e.g. ICMP unreachable)
Monitoring LPTS
LPTS is not SNMP enabled (request has been filed and is in the works, no target release defined at time of writing). Though there are very inventive ways to monitor LPTS and generate alerts. There is a TCL script that you can use with EEM in order to get some level of alerting.
Attached to this article is the script package and here is how you set it up:
event manager environment EEM_LPTS_CHECK_INTERVAL 300 event manager environment EEM_LPTS_CHECK_FLOWTYPES BGP-known * event manager environment EEM_LPTS_CHECK_LOCATIONS 0/0/CPU0 0/4/CPU0 event manager environment EEM_LPTS_CHECK_THRESHOLD 1 50% event manager directory user policy disk0:/scripts/ event manager policy lpts-threshold-alerting.tcl username scripts |
|---|
How to clear LPTS statistics
LPTS stats cannot be cleared by LPTS commands or qos counter clearing.
You can clear LPTS stats by clearing hte np controller stats:
"clear controllers np counters all location <>”
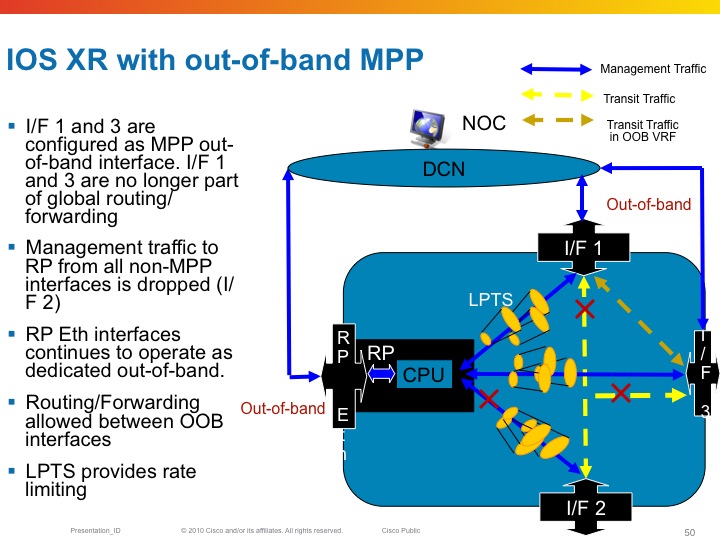
MPP: Managed Plane Protection
In the standard configuration all interfaces have access to the Telnet, SSH and SNMP daemons.
Inband vs Out of band
All linecard interfaces are designated to be inband, meaning they can transport user traffic as well as management traffic.
The mgmt interfaces on the RSP are designated out of band. This means that they can't transport user traffic but only management traffic.
Out-of-band interfaces can't "speak" to other interfaces as they are desginated for managment traffic. So eventhough there is a route in the system that would send traffic out of the mgmt interface, Fabric enabled interfaces on the LC can't
Here an example of out of band and the restrictions that it imposes on the forwarding
Configuring MPP
By default when the service is configured, there are no mpp restrictions. All interfaces are able to accept the mgmt traffic for the service you defined. For example, when the telnet server is configured, LPTS reports the following binding:
RP/0/RSP0/CPU0:A9K-BNG#show lpts bindings brief | i (any.23 )
Tue Feb 28 12:00:55.195 EDT
0/RSP0/CPU0 TCP LR IPV4 TCP default any any,23 any
This means that every for me packet with port 23 as the dest port will get serviced.
Now when configuring MPP the bindings output changes:
control-plane
management-plane
inband
interface TenGigE0/1/0/0
allow Telnet peer
address ipv4 3.3.3.3
address ipv4 5.5.5.0/28
!
!
interface GigabitEthernet0/0/0/10
allow Telnet
!
!
!
In this configuration example I am designating two interfaces as inband, so they will still be able to forward transient traffic and allow inbound telnet traffic. At the same time I allow telnet from any host on Gig0/0/0/10 and only telnet from a few peers on Te0/1/0/0.
The LPTS bindings are dynamically changed as per following output:
RP/0/RSP0/CPU0:A9K-BNG#show lpts bindings brief | i (any.23 )
Tue Feb 28 12:06:48.339 EDT
0/RSP0/CPU0 TCP LR IPV4 TCP default Gi0/0/0/10 any,23 any << Any source can access my telnet on this intf
0/RSP0/CPU0 TCP LR IPV4 TCP default Mg0/RSP0/CPU0/0 any,23 any << Dedicated inband
0/RSP0/CPU0 TCP LR IPV4 TCP default Te0/1/0/0 any,23 3.3.3.3 << /32 host access for telnet on dedicated intf
0/RSP0/CPU0 TCP LR IPV4 TCP default Te0/1/0/0 any,23 5.5.5.0/28 << Hosts from this subnet on this intf
Powerful eh!?!
We can also look at the pre internal fib (piFIB) and check the entries there:
RP/0/RSP0/CPU0:A9K-BNG#show lpts pifib hardware entry bri location 0/1/cpu0 | i (.23 )
Tue Feb 28 12:27:46.389 EDT
7 IPV4 default TCP Te0/1/0/0 LU(48) any,23 3.3.3.3,any
10 IPV4 default TCP Te0/1/0/0 LU(48) any,23 5.5.5.0/28,any
Decoding the Destnode in LPTS entries
In the example above you see the following detail: LU(48). This section explains that number and detail.
The LU means local unicast fabric. The 48 is a very interesting number.
The device that this output is taken from is an ASR9010. Which has 8 LC slots and 2 RSP slots. On both sides of the RSP's in the middle
are the 4 LC's
If I were to decode the 30 into binary it looks like this:
+---+---+---+---+---+---+---+---+
| 7 | 6 | 5 | 4 | 3 | 2 | 1 | 0 | Position
+---+---+---+---+---+---+---+---+
| 0 | 0 | 1 | 1 | 0 | 0 | 0 | 0 | Bit value for Decimal 48
+---+---+---+---+---+---+---+---+
|LC |LC |RSP|RSP|LC |LC |LC |LC | Slot position filling (note 2 left most LC's not drawn)
+---+---+---+---+---+---+---+---+
Now you can see that the 1's are in position 5 and 4, and if you look at the slot numbering of the ASR9006, you can see that these are
the RSP's!! So telnet is delivered to the RSP.
Restrictions for MPP
6) No MIB Support
Related Information
Cisco Guide to Harden Cisco IOS XR Devices
LPTS Considerations
If you can use only p2p OSPF network type
flow ospf-uc-known rate 0
flow ospf-uc-default rate 0
flow bgp-default rate 0
flow ldp-tcp-default rate 0
flow msdp-default rate 0
Xander Thuijs, CCIE #6775
Sr. Tech Lead ASR9000
- Mark as Read
- Mark as New
- Bookmark
- Permalink
- Report Inappropriate Content
hey juan,
ARP can be adjusted as follows:
RP/0/RSP0/CPU0:A9K-BNG(config)#lpts punt police location 0/0/CPU0 protocol arp
Currently arp is set for 1000 pps:
ARP ARP 1000 200 263 0 Local
Although be conservative increasing this number. we are working on some arp improvements with sanity checks etc as ARP is busting GSP (group service protocol, to distribute arp information) to the max. Some of these improvements have made it in XR533, some of them will follow later in XR6
cheers!
xander
- Mark as Read
- Mark as New
- Bookmark
- Permalink
- Report Inappropriate Content
thanks for the quick answer Xander!
- Mark as Read
- Mark as New
- Bookmark
- Permalink
- Report Inappropriate Content
Hy Xander,
can you explain a little bit how is LPTS related to protecting from broadcast storms ? In IOS XR we can protect on bridge-domain by introducing storm-control, but we can not do it per physical interface basis. Meaning, what exactly happens when there is a L2 loop which generates broadcast storm on ASR physical interface and how does ASR resolve it ? For example, 7609 platform would regularly crash in similar situations without protection.
Thank you very much
 - Emeritus")
- Mark as Read
- Mark as New
- Bookmark
- Permalink
- Report Inappropriate Content
Let me take a stab at it. :)
LPTS applies to all packets that the router considers a "for us" packet, i.e. a packet that is directed to the router itself. If in the L2 bridge domain you don't have a routed interface (BVI), broadcasts will never be punted so LPTS doesn't come into the picture.
If you have a BVI in the BD, all broadcast packets will be punted by the NP microcode through LPTS. The specific per-protocol policers that exist by default in LPTS will rate-limit the punted packets, to protect the LC or RP CPU from overload.
The ARP use-case scenario is explained in https://supportforums.cisco.com/document/12766486/troubleshooting-arp-asr9000-routers. The other protocols work in very similar way.
hope this helps,
Aleksandar
- Mark as Read
- Mark as New
- Bookmark
- Permalink
- Report Inappropriate Content
Hello,
OK. But let's see following situation. I have ASR9k connected to switch via trunk interface. From that switch broadcast storm happens and it is propagated toward ASR9k interfaces. Interface config on ASR is:
interface GigabitEthernet0/0/0/2
description sw-lab-1##Gi0/15#(3400-12)
cdp
service-policy output QOS_METRO_OUT
negotiation auto
load-interval 30
transceiver permit pid all
!
interface GigabitEthernet0/0/0/2.5
description IPTV
ipv4 address 172.26.38.36 255.255.255.224
shutdown
load-interval 30
encapsulation dot1q 5
!
interface GigabitEthernet0/0/0/2.1905 l2transport
description L2VPN-P2P
encapsulation dot1q 1905
rewrite ingress tag pop 1 symmetric
!
interface GigabitEthernet0/0/0/2.1908 l2transport
description VPLS
encapsulation dot1q 1908
rewrite ingress tag pop 1 symmetric
service-policy input BS_VPN_2M
!
interface GigabitEthernet0/0/0/2.2019
description L3VPN
vrf ACS
ipv4 address 10.128.127.2 255.255.255.240
encapsulation dot1q 2019
When we experience broadcast we see global routing flaps, we see NSR log messages and it definitely influences overall performance. Since we can not implement storm-control on physical interface how can we protect against such behaviour. Here are some log messages from affected ASR:
RP/0/RSP0/CPU0:ASR-9K-LAB#RP/0/RSP0/CPU0:May 18 12:33:32.948 : tcp[445]: %IP-TCP_NSR-5-DISABLED : 85.94.144.18:27998 <-> 85.94.144.13:646:: NSR disabled for TCP connection because Retransmission threshold exceeded
RP/0/RSP0/CPU0:May 18 12:33:35.051 : mpls_ldp[1192]: %ROUTING-LDP-5-NSR_SYNC_START : Initial synchronization started for 1 peers
RP/0/RSP0/CPU0:May 18 12:33:56.600 : tcp[445]: %IP-TCP_NSR-5-DISABLED : 85.94.144.18:27998 <-> 85.94.144.13:646:: NSR disabled for TCP connection because Retransmission threshold exceeded
RP/0/RSP0/CPU0:May 18 12:33:58.704 : mpls_ldp[1192]: %ROUTING-LDP-5-NSR_SYNC_START : Initial synchronization started for 1 peers
RP/0/RSP0/CPU0:May 18 12:34:00.085 : ospf[1018]: %ROUTING-OSPF-5-ADJCHG : Process 1, Nbr 85.94.144.2 on GigabitEthernet0/0/0/0 in area 0 from FULL to DOWN, Neighbor Down: dead timer expired, vrf default vrfid 0x60000000
LC/0/0/CPU0:May 18 12:34:00.089 : bfd_agent[125]: %L2-BFD-6-SESSION_REMOVED : BFD session to neighbor 85.94.144.237 on interface GigabitEthernet0/0/0/0 has been removed
RP/0/RSP0/CPU0:May 18 12:34:01.139 : ipv4_rib[1160]: %ROUTING-RIB-7-SERVER_ROUTING_DEPTH : Recursion loop looking up prefix 195.29.110.201 in Vrf: "default" Tbl: "default" Safi: "Unicast" added by bgp
RP/0/RSP1/CPU0:May 18 12:34:01.152 : ipv4_rib[1160]: %ROUTING-RIB-7-SERVER_ROUTING_DEPTH : Recursion loop looking up prefix 195.29.110.201 in Vrf: "default" Tbl: "default" Safi: "Unicast" added by bgp
RP/0/RSP0/CPU0:May 18 12:34:01.354 : ospf[1018]: %ROUTING-OSPF-5-ADJCHG : Process 1, Nbr 85.94.144.2 on GigabitEthernet0/0/0/0 in area 0 from DOWN to INIT, Received Hello, vrf default vrfid 0x60000000
RP/0/RSP0/CPU0:May 18 12:34:01.354 : ospf[1018]: %ROUTING-OSPF-5-ADJCHG : Process 1, Nbr 85.94.144.2 on GigabitEthernet0/0/0/0 in area 0 from INIT to 2WAY, 2-Way Received, vrf default vrfid 0x60000000
RP/0/RSP0/CPU0:May 18 12:34:01.354 : ospf[1018]: %ROUTING-OSPF-5-ADJCHG : Process 1, Nbr 85.94.144.2 on GigabitEthernet0/0/0/0 in area 0 from 2WAY to EXSTART, AdjOK?, vrf default vrfid 0x60000000
RP/0/RSP0/CPU0:May 18 12:34:01.358 : ospf[1018]: %ROUTING-OSPF-5-ADJCHG : Process 1, Nbr 85.94.144.2 on GigabitEthernet0/0/0/0 in area 0 from EXSTART to EXCHANGE, Negotiation Done, vrf default vrfid 0x60000000
RP/0/RSP0/CPU0:May 18 12:34:01.381 : ospf[1018]: %ROUTING-OSPF-5-ADJCHG : Process 1, Nbr 85.94.144.2 on GigabitEthernet0/0/0/0 in area 0 from EXCHANGE to LOADING, Exchange Done, vrf default vrfid 0x60000000
RP/0/RSP0/CPU0:May 18 12:34:01.384 : ospf[1018]: %ROUTING-OSPF-5-ADJCHG : Process 1, Nbr 85.94.144.2 on GigabitEthernet0/0/0/0 in area 0 from LOADING to FULL, Loading Done, vrf default vrfid 0x60000000
LC/0/0/CPU0:May 18 12:34:01.390 : bfd_agent[125]: %L2-BFD-6-SESSION_DAMPENING_ON : Session to neighbor 85.94.144.237 on interface GigabitEthernet0/0/0/0 entered Dampened state (initial: 2000 ms,secondary: 5000 ms,maximum: 120000 ms).
RP/0/RSP0/CPU0:May 18 12:34:05.384 : ospf[1018]: %ROUTING-OSPF-5-ADJCHG : Process 1, Nbr 85.94.144.2 on GigabitEthernet0/0/0/0 in area 0 from FULL to DOWN, Neighbor Down: dead timer expired, vrf default vrfid 0x60000000
RP/0/RSP0/CPU0:May 18 12:34:06.113 : ospf[1018]: %ROUTING-OSPF-5-ADJCHG : Process 1, Nbr 85.94.144.2 on GigabitEthernet0/0/0/0 in area 0 from DOWN to INIT, Received Hello, vrf default vrfid 0x60000000
RP/0/RSP0/CPU0:May 18 12:34:06.113 : ospf[1018]: %ROUTING-OSPF-5-ADJCHG : Process 1, Nbr 85.94.144.2 on GigabitEthernet0/0/0/0 in area 0 from INIT to 2WAY, 2-Way Received, vrf default vrfid 0x60000000
RP/0/RSP0/CPU0:May 18 12:34:06.113 : ospf[1018]: %ROUTING-OSPF-5-ADJCHG : Process 1, Nbr 85.94.144.2 on GigabitEthernet0/0/0/0 in area 0 from 2WAY to EXSTART, AdjOK?, vrf default vrfid 0x60000000
RP/0/RSP0/CPU0:May 18 12:34:06.115 : ospf[1018]: %ROUTING-OSPF-5-ADJCHG : Process 1, Nbr 85.94.144.2 on GigabitEthernet0/0/0/0 in area 0 from EXSTART to EXCHANGE, Negotiation Done, vrf default vrfid 0x60000000
- Mark as Read
- Mark as New
- Bookmark
- Permalink
- Report Inappropriate Content
Best way to proceed is to understand what exactly happens during this broadcast storm. The following information will help (post-mortem is possible as well if counters were not cleared):
- sh controllers np counters all location <location>
- sh lpts pifib hardware police location <location>
- sh lpts pifib hardware static-police location <location>
This will show what kind of packets are punted and where. OSPF on Gig0/0/0/0 should not be impacted by a broadcast storm on the Gig0/0/0/2 sub-interfaces that you have shown.
Get the mapping of port vs NP using "sh controllers np ports all location <location>".
regards,
/Aleksandar
- Mark as Read
- Mark as New
- Bookmark
- Permalink
- Report Inappropriate Content
The diagram and the provided output explain better what is the issue.
Most drops were recorded against "OSPF-mc-known" LPTS policer. This is a consequence of the lab topology where both the access facing and core facing interfaces are on the same NP. Since the LPTS policer are per NP, if you have one interface misbehaving, it will impact other interfaces on the NP.
Another important point in your topology is that the packets hitting the "OSPF-mc-known" policer are coming back through Gi0/0/0/2. The key part here is that these packets appear as if they were from a known OSPF session. If the storm would comprise some other type of packets, they would not impact the known OSPF sessions. I presume that in the real network you won't run IGP with untrusted peers in the access network.
In general broadcast storm control is effective when it's applied at the edge of the access network because only there it's selective (i.e. the storm is isolated to a smallest portion of the network and service impact is hence limited). If you apply it on the PE, it will be effective in the sense that other services are not impacted (on some other platforms CPU would go through the roof and all services would be affected).
So LPTS on asr9k does what it should do. The questions is how close is the test setup to the target production environment. If it is, then it would be good to apply some best practices to isolate the untrusted interfaces from the trusted ones.
hope this helps,
Aleksandar
- Mark as Read
- Mark as New
- Bookmark
- Permalink
- Report Inappropriate Content
Hello Xander,
I went through this document and then checked few things on device and I would be thankful if you may answer them please.:
ICMP Source: 10.0.0.2
ICMP Destination: 10.0.0.1 -> G0/3/0/9.10's IP address. For-us traffic.
RP/0/RSP0/CPU0:ASR9006#show run int g0/3/0/9.10
Fri Jul 29 11:16:56.179 UTC
interface GigabitEthernet0/3/0/9.10
ipv4 address 10.0.0.1 255.255.255.0
encapsulation dot1q 10
1) I reduced the rate to 5pps for ICMP-local.
lpts pifib hardware police location 0/3/CPU0
flow icmp local rate 5
2) I see drops in ICMP-local as EXPECTED due to rate configured as per step 1.
RP/0/RSP0/CPU0:ASR9006#show lpts pifib hardware police location 0/3/CPU0 | in ICMP-local
Fri Jul 29 11:11:12.641 UTC
ICMP-local 112 Local 5 1500 1811226 10231885 01234567
RP/0/RSP0/CPU0:ASR9006#show lpts pifib hardware police location 0/3/CPU0 | in ICMP-local
Fri Jul 29 11:11:14.157 UTC
ICMP-local 112 Local 5 1500 1811239 10234105 01234567
3) I DO NOT see any specific entry created in pifib specifying the source and destination IP mentioned above.
RP/0/RSP0/CPU0:ASR9006#show lpts pifib entry brief location 0/3/CPU0 | in 10.0.0 >> Not entry for Src or Dst IP.
Fri Jul 29 11:12:41.077 UTC
RP/0/RSP0/CPU0:ASR9006-B#
There is a generic Any to Any entry seen in pifib but is also shows DROP counters as ZERO.
L3 Protocol : IPV4
L4 Protocol : ICMP
VRF-ID : * (0x00000001)
Destination IP : any
Source IP : any
Port/Type : ICMP:ECHO
Source Port : any
Is Fragment : 0
Is SYN : 0
Interface : any (0x0)
O/F/L/I/T : DROP/ICMP-local/IPv4_STACK/1/0
Deliver List : na
Accepts/Drops : 1813219/0 >> Zero drops
Is Stale : 0
I have three queries in mind:
a) How do we decide on ASR9K that an "ANY source ANY destination" like in ICMP above has to be created in pifib policer dynamically. And how do we decide that we need to create a SPECIFIC entry in pifib for SPECIFIC IPs ? For example a specific entry below for TCP
IPv4 default TCP any 0/RSP0/CPU0 199.38.111.142,58969 199.38.111.141,179
b) We see in above output entry for policing in step 2 that packets "for-us" local ICMP packets are getting DROPPED. But at the same time pifib entry on 0/3/CPU (show lpts pifib entry loc 0/3/CPU0) shows ZERO drops (Accepts/Drops : 1813219/0). So is there any entry that I am mistakenly not checking. Which entry shall I look at which matches ICMP-local drops in pifib ?
c) Finally, you mentioned above that "So for-me packets are undergoing the Pre iFIB classification and policing upon which they are directed by the iFIB, which is the second level of filtering to the destination node."
I was wondering that if we have already filtered for example BGP packets (control-plane traffic) to permissible rate limits on LC itself, what is the requirement of subjecting it to filtering on RSP again in IFIB ? Do we again subject BGP traffic in iFIB on RSP ?
Regards
Aman
- Mark as Read
- Mark as New
- Bookmark
- Permalink
- Report Inappropriate Content
hi aman,
there is no pifib entry for the source/dest, but will follow the default icmp "hole" that exists and is pierced. since that entry is not dropping anything, as it ismerely an access-list entry, drops will be zero there.
for "c", the use is here that there are multiple LC's and multiple NP's that can punt at that lpts defined rate, the sw based ifib provides then an aggregate for all received packets of that classification.
xander
- Mark as Read
- Mark as New
- Bookmark
- Permalink
- Report Inappropriate Content
Hi Xander,
Thanks for your quick response. It makes things clear.
So idea of IFIB is to do second level check on the "for-us" traffic coming from multiple LCs and NPs after they had gone through "pifib" on LC.
On LC, we can check and play with pifib police-limits:
RP/0/RSP0/CPU0:ASR9006-B#show run lpts pifib hardware police location 0/3/CPU0
Thu Jul 28 13:27:57.672 UTC
lpts pifib hardware police
flow fragment rate 300
flow ospf multicast default rate 200
flow ospf unicast default rate 200
flow bgp default rate 500
I could not find any similar command for IFIB showing the rate-limits. Is there a way we can check this. I believe the rate-limit parameters on IFIB should be relaxed as compared to LCs values as IFIB now has to be applied to AGGREGATE traffic as you mentioned.
Regards
Aman
- Mark as Read
- Mark as New
- Bookmark
- Permalink
- Report Inappropriate Content
I applied on PE but I found when customer ping from CEs to test their link, they lost. How should I tell my customers to accept this behavior?
- Mark as Read
- Mark as New
- Bookmark
- Permalink
- Report Inappropriate Content
help me out here :) what did you apply to the PE? LPTS does rate limit for me type traffic, as it should and icmp is a low priority punt, it means that it can get pushed away or rate limited.
you can increase the policer in case there is a lot of icmp requests.
xander
- Mark as Read
- Mark as New
- Bookmark
- Permalink
- Report Inappropriate Content
lpts pifib hardware police
flow fragment rate 0
flow ospf multicast default rate 0
flow ospf unicast default rate 0
flow ssh default rate 100
flow http known rate 0
flow http default rate 0
flow telnet known rate 200
flow telnet default rate 200
!
lpts pifib hardware police location 0/0/CPU0
flow isis default rate 0
flow bgp default rate 0
flow pim multicast default rate 0
flow icmp application rate 1000
flow icmp default rate 1000
flow ldp tcp default rate 0
flow all-routers rate 0
flow lmp tcp default rate 0
flow lmp udp rate 0
flow rsvp default rate 0
flow ipsec default rate 0
flow mpls oam rate 1000
!
lpts punt police location 0/0/CPU0
exception invalid rate 400
protocol cdp rate 50
protocol arp rate 5000
protocol ipv4 options rate 100
exception icmp rate 200
exception ipv4 ttl-error rate 500
exception ipv4 fragment rate 10000
exception adjacency rate 300
exception acl-deny rate 50
exception ipv6 ttl-error rate 500
exception ipv6 fragment rate 10000
exception mpls fragment rate 10000
exception mpls ttl-error rate 500
!
Thank you very much.
- Mark as Read
- Mark as New
- Bookmark
- Permalink
- Report Inappropriate Content
you probably want to look at the show lpts pifib hardware (static-)police location of the LC where the CE is connected to. if that shows that we are rate-limiting icmp, an increase of the policer might be good. if there are no drops happening, then the rate is fine and the ping loss on the ce is coming from somewhere else.
cheers
xander
Find answers to your questions by entering keywords or phrases in the Search bar above. New here? Use these resources to familiarize yourself with the community: