Please let me know the right command to get Date and Time Policy via CLI/SSH. Thanks
Turn on suggestions
Auto-suggest helps you quickly narrow down your search results by suggesting possible matches as you type.
Showing results for
- Cisco Community
- Technology and Support
- Data Center and Cloud
- Application Centric Infrastructure
- How to get Date and Time Policy via CLI?
Options
- Subscribe to RSS Feed
- Mark Topic as New
- Mark Topic as Read
- Float this Topic for Current User
- Bookmark
- Subscribe
- Mute
- Printer Friendly Page
2537
Views
15
Helpful
5
Replies
Options
- Mark as New
- Bookmark
- Subscribe
- Mute
- Subscribe to RSS Feed
- Permalink
- Report Inappropriate Content
04-08-2020 01:57 AM - edited 04-08-2020 02:06 AM
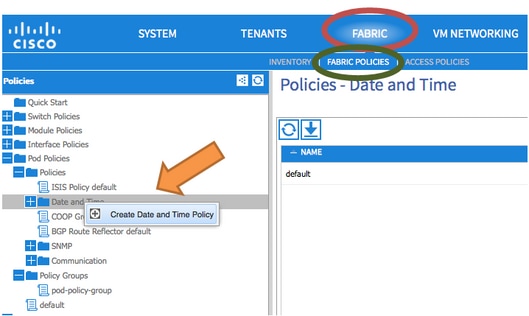
This is how we get Date and Time Policy via GUI
On the menu bar, navigate to FABRIC > FABRIC POLICIES.

In the Navigation pane, perform these actions:

Expand Pod Policies
Expand Policies
Select Date and Time
Reference:
I've tried the following command, but none of them shows the policy name.
fabric1-leaf1# show ntp peers
--------------------------------------------------
  Peer IP Address               Serv/Peer
--------------------------------------------------
  173.36.129.235                Server (configured)


fabric1-leaf1# show ntp peer-status
Total peers : 1
* - selected for sync, + - peer mode(active),
- - peer mode(passive), = - polled in client mode
    remote                local                st   poll   reach delay   vrf
-------------------------------------------------------------------------------
*173.36.129.235          0.0.0.0               3    16     37    0.00134 management


fabric1-leaf1# show ntp statistics peer ipaddr 173.36.129.235
remote host:          173.36.129.235
local interface:      Unresolved
time last received:   2s
time until next send: 14s
reachability change:  408s
packets sent:         30
packets received:     30
bad authentication:   0
bogus origin:         0
duplicate:            0
bad dispersion:       0
bad reference time:   0
candidate order:      6
fabric1-leaf1#
Solved! Go to Solution.
Labels:
- Labels:
-
APIC
1 Accepted Solution
Accepted Solutions

")
Options
- Mark as New
- Bookmark
- Subscribe
- Mute
- Subscribe to RSS Feed
- Permalink
- Report Inappropriate Content
04-08-2020 02:12 AM
Hello again,
If you want to verify the policies applied in the fabric in a "show run" NXOS-style format, you must use APIC CLI and "show running-config X". If you are not sure where exactly the configuration is, simply do a "show running-config all", then search/grep for what you are interested in.
For NTP specific, you can find the configured policies using:
apic1# show running-config pod 1 ntp ?
 <CR>
 authenticate        Show authentication for the default ntp policy
 authentication-key  Show ntp authentication keys for the default ntp policy
 description         Show description for the active ntp policy
 master              Master Mode for NTP Server
 server              Show ntp servers for the active ntp policy
 server-mode         Server Mode for NTP Server
 trusted-key         Show trusted for ntp authentication key
Regards,
Sergiu
5 Replies 5
Options
- Mark as New
- Bookmark
- Subscribe
- Mute
- Subscribe to RSS Feed
- Permalink
- Report Inappropriate Content
04-08-2020 02:12 AM
Hello again,
If you want to verify the policies applied in the fabric in a "show run" NXOS-style format, you must use APIC CLI and "show running-config X". If you are not sure where exactly the configuration is, simply do a "show running-config all", then search/grep for what you are interested in.
For NTP specific, you can find the configured policies using:
apic1# show running-config pod 1 ntp ?
 <CR>
 authenticate        Show authentication for the default ntp policy
 authentication-key  Show ntp authentication keys for the default ntp policy
 description         Show description for the active ntp policy
 master              Master Mode for NTP Server
 server              Show ntp servers for the active ntp policy
 server-mode         Server Mode for NTP Server
 trusted-key         Show trusted for ntp authentication key
Regards,
Sergiu
Options
- Mark as New
- Bookmark
- Subscribe
- Mute
- Subscribe to RSS Feed
- Permalink
- Report Inappropriate Content
04-08-2020 03:31 AM
Thanks, the main problem is `sh run` on APIC is huge, I tried to download the config, it was failed due to timed out during `sh run`
Options
- Mark as New
- Bookmark
- Subscribe
- Mute
- Subscribe to RSS Feed
- Permalink
- Report Inappropriate Content
04-08-2020 04:06 AM
Hello,
How do you download the show run? Or what do you mean by download?
The timeout is experienced while doing the "show run" in the CLI?
Cheers,
Sergiu
Options
- Mark as New
- Bookmark
- Subscribe
- Mute
- Subscribe to RSS Feed
- Permalink
- Report Inappropriate Content
04-08-2020 05:04 AM - edited 04-08-2020 05:05 AM
Putty: Session > Logging > Printable output

Options
- Mark as New
- Bookmark
- Subscribe
- Mute
- Subscribe to RSS Feed
- Permalink
- Report Inappropriate Content
04-08-2020 06:04 AM
You can try redirecting the running config to a file. Then you can read the file using less, which is much faster:
apic1# show running-config > cfg.txt
apic1# ls
aci  cfg.txt  debug  mit
apic1# less cfg.txt
Regards,
Sergiu
Learn, share, save
Discover and save your favorite ideas. Come back to expert answers, step-by-step guides, recent topics, and more.
New here? Get started with these tips. How to use Community New member guide
Customers Also Viewed These Support Documents