- Cisco Community
- Technology and Support
- Networking
- Cisco Annual Internet Report Discussions
- Global Cloud Index: Figure 11: Public vs. private cloud growth
- Subscribe to RSS Feed
- Mark Topic as New
- Mark Topic as Read
- Float this Topic for Current User
- Bookmark
- Subscribe
- Mute
- Printer Friendly Page
- Mark as New
- Bookmark
- Subscribe
- Mute
- Subscribe to RSS Feed
- Permalink
- Report Inappropriate Content
01-07-2019 02:23 AM - edited 01-07-2019 11:04 AM
Dear Authors of the GCI,
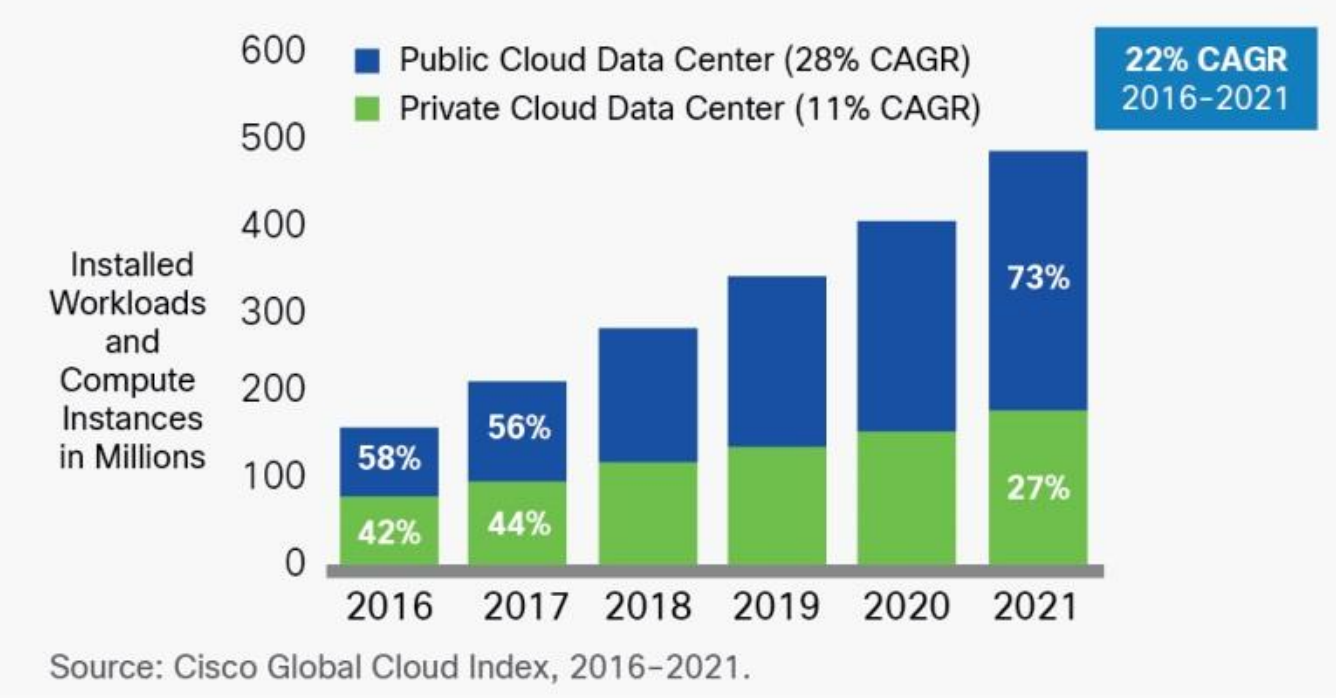
thanks for providing such a well-researched & written report. I have one question: Could you provide the raw data for figure 11 (Public vs. private cloud growth) of that report? The numbers in the graphic are hard to read, and especially the relevant years (2018 & 2019) are not labeled.
Thank you very much in advance and best regards
Max
Solved! Go to Solution.
- Labels:
-
VNI and GCI
Accepted Solutions
- Mark as New
- Bookmark
- Subscribe
- Mute
- Subscribe to RSS Feed
- Permalink
- Report Inappropriate Content
03-01-2019 10:33 AM
Thanks for your interest in Cisco's Global Cloud Index.
Following is the data you requested:
| Installed Workloads & Compute Instances in Millions | 2016 | 2017 | 2018 | 2019 | 2020 | 2021 |
| Public Cloud Data Center (28% CAGR) | 115 | 166 | 221 | 273 | 328 | 390 |
| Private Cloud Data Center (11% CAGR) | 84 | 96 | 110 | 121 | 132 | 144 |
I hope you find the above data useful. Please cite the source as "Cisco Global Cloud Index, 2016–2021" when using this data.
Thanks,
Shruti
Cisco GCI/VNI team
Discover and save your favorite ideas. Come back to expert answers, step-by-step guides, recent topics, and more.
New here? Get started with these tips. How to use Community New member guide
