- Cisco Community
- Technology and Support
- Online Tools and Resources
- Cisco Bug Discussions
- CSCtn42790 - 3560X/3750X Elevated CPU usage due to Hulc LED process
- Subscribe to RSS Feed
- Mark Topic as New
- Mark Topic as Read
- Float this Topic for Current User
- Bookmark
- Subscribe
- Mute
- Printer Friendly Page
CSCtn42790 - 3560X/3750X Elevated CPU usage due to Hulc LED process
- Mark as New
- Bookmark
- Subscribe
- Mute
- Subscribe to RSS Feed
- Permalink
- Report Inappropriate Content
01-13-2015 03:44 AM - edited 03-20-2019 08:26 PM
We found out that there is an exception for this bug.
Our environment have 2 type of 3750X PoE stacked switches, all the stacks are almost having the same amount of ip phone and ap connected:
A) 1x24ports, 4x48ports
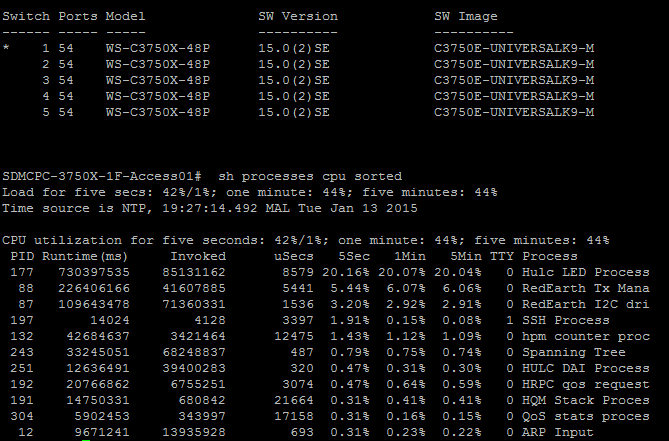
B) 5x48ports
We have more than 6 of type A stack, the cpu utilization for Hulc LED process of all stacks just around 1%

Besides we have more than 7 of type B stack, all of the stack are showing high cpu utilization around 20% for Hulc LED process.
If Cisco claimed that the high cpu of Hulc LED because of does the following tasks:
- Check Link status on every port
- If the switch supports POE, it checks to see if there is a Power Device (PD)
detected
- Check the status of the transceiver
- Update Fan status
- Set Main LED and ports LEDs
- Update both Power Supplies and RPS
- Check on system temperature status
But why the stack with 24 ports switch did not faced this issue?
- Labels:
-
Cisco Bugs
- Mark as New
- Bookmark
- Subscribe
- Mute
- Subscribe to RSS Feed
- Permalink
- Report Inappropriate Content
02-12-2015 05:59 AM
I have the same behaviour on the WS-C3750X-48T-S running under 15.0(2)SE6 version.
Switch Ports Model SW Version SW Image
------ ----- ----- ---------- ----------
* 1 54 WS-C3750X-48 15.0(2)SE6 C3750E-UNIVERSALK9-M
2 54 WS-C3750X-48 15.0(2)SE6 C3750E-UNIVERSALK9-M
Switch#show processes cpu sorted | exclude 0\.
CPU utilization for five seconds: 33%/0%; one minute: 35%; five minutes: 34%
PID Runtime(ms) Invoked uSecs 5Sec 1Min 5Min TTY Process
179 1597050939 213538343 7478 19.51% 19.85% 19.66% 0 Hulc LED Process
90 254625571 41668722 6110 2.87% 2.80% 2.86% 0 RedEarth Tx Mana
134 132649041 8566912 15483 2.39% 2.36% 2.38% 0 hpm counter proc
- Mark as New
- Bookmark
- Subscribe
- Mute
- Subscribe to RSS Feed
- Permalink
- Report Inappropriate Content
02-12-2015 06:43 AM
I've seen that behaviour on different platforms with a lot of different ios versions.
As someone explained erlier, 33% of cpu utilization is not that alarming, specially considering that the process under examination is a low priority one on ios.
In my experience the only annoying issue about that is when you raise over 40/50% cpu utilization and you have management software that starts sending alarms.
- Mark as New
- Bookmark
- Subscribe
- Mute
- Subscribe to RSS Feed
- Permalink
- Report Inappropriate Content
07-08-2015 08:37 PM
Same here. 6 stack of 3750X's with a 20% Hulu LED process.
Switch Ports Model SW Version SW Image
------ ----- ----- ---------- ----------
* 1 54 WS-C3750X-48 15.0(1)SE2 C3750E-UNIVERSALK9-M
2 54 WS-C3750X-48 15.0(1)SE2 C3750E-UNIVERSALK9-M
3 54 WS-C3750X-48 15.0(1)SE2 C3750E-UNIVERSALK9-M
4 54 WS-C3750X-48 15.0(1)SE2 C3750E-UNIVERSALK9-M
5 54 WS-C3750X-48 15.0(1)SE2 C3750E-UNIVERSALK9-M
6 54 WS-C3750X-48 15.0(1)SE2 C3750E-UNIVERSALK9-M
CPU utilization for five seconds: 52%/4%; one minute: 50%; five minutes: 45%
PID Runtime(ms) Invoked uSecs 5Sec 1Min 5Min TTY Process
176 2215782113 249642443 8875 20.48% 19.81% 20.11% 0 Hulc LED Process
404 156180063 139911469 1116 6.40% 6.67% 3.36% 0 SNMP ENGINE
95 44752857 134945153 331 3.68% 2.21% 0.73% 0 hrpc <- response
132 218355531 20972257 10411 2.24% 2.13% 2.07% 0 hpm counter proc
Causes us grief because we're getting alarms when the overall CPU goes higher than 80% and we hit it often.
Discover and save your favorite ideas. Come back to expert answers, step-by-step guides, recent topics, and more.
New here? Get started with these tips. How to use Community New member guide