- Cisco Community
- Technology and Support
- Security
- Email Security
- Re: ESA Health Dashboard
- Subscribe to RSS Feed
- Mark Topic as New
- Mark Topic as Read
- Float this Topic for Current User
- Bookmark
- Subscribe
- Mute
- Printer Friendly Page
ESA Health Dashboard
- Mark as New
- Bookmark
- Subscribe
- Mute
- Subscribe to RSS Feed
- Permalink
- Report Inappropriate Content
04-02-2019 07:35 AM - edited 04-02-2019 07:48 AM
Hello IronPort Admins,
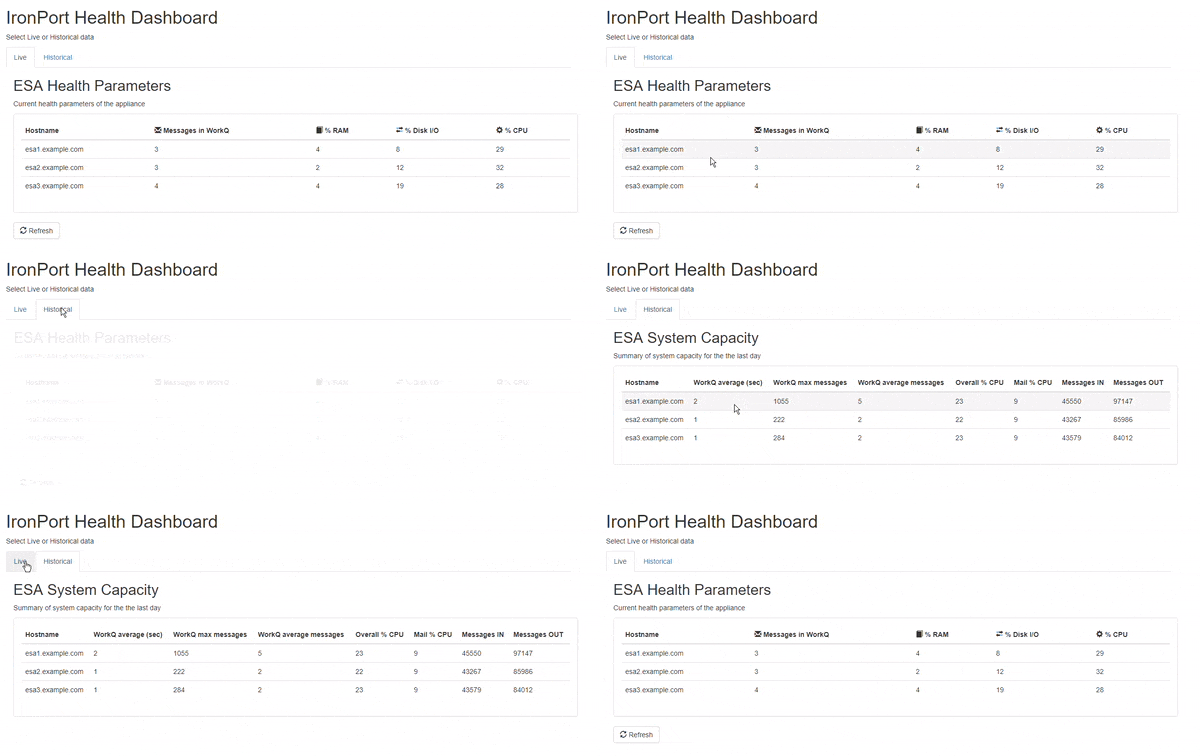
I recently built a web-based dashboard to help me monitor key health statistics for the ESAs in our environment. I'm sharing the code here so that others might benefit. The HTML is written using the Bootstrap3 framework, so it's easy to update the look of the page. The PHP can be modified to query the ESA API for other information as well. All you need is a web server running PHP that can access your ESA's API port to query the statistics.
https://github.com/blandco/esa-health
I appreciate any feedback. Please let me know if you have any questions.
Thanks,
Joel
- Labels:
-
Email Security
- Mark as New
- Bookmark
- Subscribe
- Mute
- Subscribe to RSS Feed
- Permalink
- Report Inappropriate Content
04-02-2019 08:19 AM
- Mark as New
- Bookmark
- Subscribe
- Mute
- Subscribe to RSS Feed
- Permalink
- Report Inappropriate Content
04-02-2019 09:40 AM
Hi Ken,
The data is retrieved from the API when the page loads. No data is stored for the historical stats. Currently, the Historical page returns stats for the previous day, but could be modified to show the last 7 days, for example, by changing the API query.
- Mark as New
- Bookmark
- Subscribe
- Mute
- Subscribe to RSS Feed
- Permalink
- Report Inappropriate Content
04-05-2019 02:18 AM
The stats from the box suck. Too much consolidation.
Syslog all the status logs and use that data @ 60 sec intervals. ( I think in logconfig that can be changed but haven't tried )
- Mark as New
- Bookmark
- Subscribe
- Mute
- Subscribe to RSS Feed
- Permalink
- Report Inappropriate Content
04-05-2019 05:40 AM
another approach is using syslog and a SIEM like Splunk, this gives us all the current and historical data but also allows for better alerts.
- Mark as New
- Bookmark
- Subscribe
- Mute
- Subscribe to RSS Feed
- Permalink
- Report Inappropriate Content
04-05-2019 06:23 AM
Very nice, Marc! Thanks for sharing. Perhaps you could provide the community with some guidance on how to get Splunk setup for this?
Thanks!
Joel
- Mark as New
- Bookmark
- Subscribe
- Mute
- Subscribe to RSS Feed
- Permalink
- Report Inappropriate Content
04-08-2019 02:19 AM
Add Log Subscription for Status Logs to a Syslog server.
This can be Splunk, but Splunk advises not to use Splunk as a direct Syslog server. This avoids service issues with Splunk Forwarder restarts for app rollouts / upgrades etc.
Tell the Splunk Forwarder which logs relate to which host based on the host name being used in the path is easiest, to override the host name - otherwise everything will be from your Syslog server.
Once the logs are in Splunk, then extract all the fields using either Field Extraction or directly use rex in search.
Pipe to a table or timechart.
index=xyz sourcetype=abc
| rex field=_raw "InjBytes (?<cisco_esa_inj_bytes>\S+)"
Then use the magic of Splunk for graphing and tables etc. Go as basic or extreme as you wish.
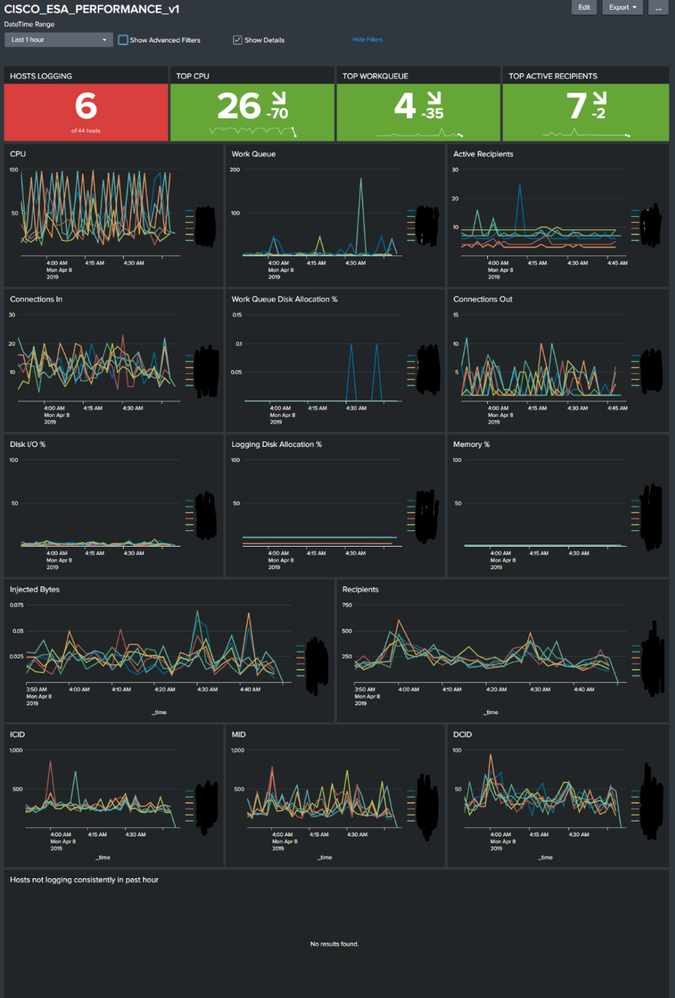
To display many graphs, I use 1 single search to collect all events and then use post process searches to filter the results. This means the load is quick and its light for Splunk. I also use trickery to auto-refresh each min without using Realtime searching and dynamically expand and hide graphs based on various thresholds.
- Mark as New
- Bookmark
- Subscribe
- Mute
- Subscribe to RSS Feed
- Permalink
- Report Inappropriate Content
04-08-2019 01:56 AM
Great to see.
I've gone all out into Splunk.
- Mark as New
- Bookmark
- Subscribe
- Mute
- Subscribe to RSS Feed
- Permalink
- Report Inappropriate Content
04-12-2019 06:14 AM
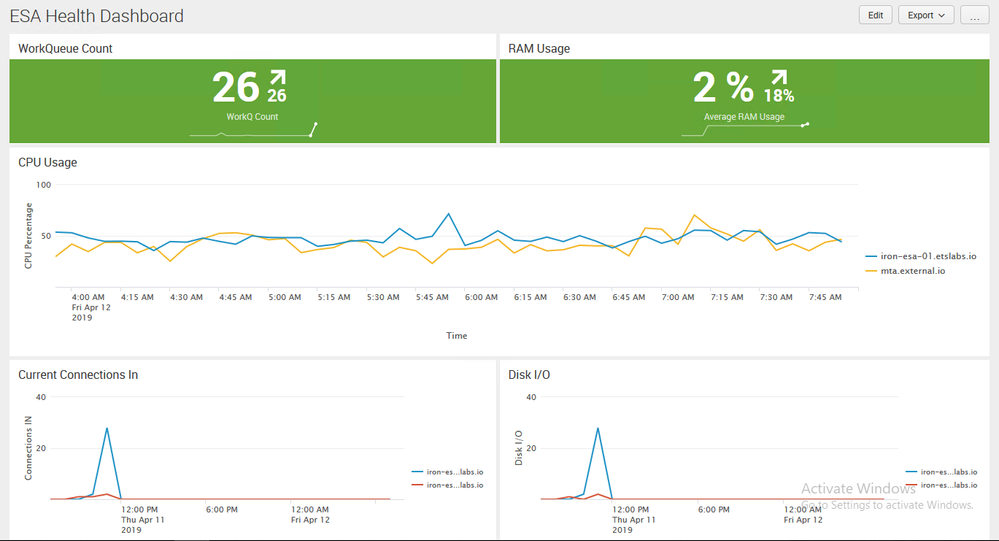
Huge thanks to @marc.luescherFRE and @Paul Thomas Cyblue for providing these excellent Splunk examples. Following your guidance, @Paul Thomas Cyblue, I was able to quickly get a proof-of-concept dashboard working in my lab. Thanks!
- Mark as New
- Bookmark
- Subscribe
- Mute
- Subscribe to RSS Feed
- Permalink
- Report Inappropriate Content
04-12-2019 06:47 AM
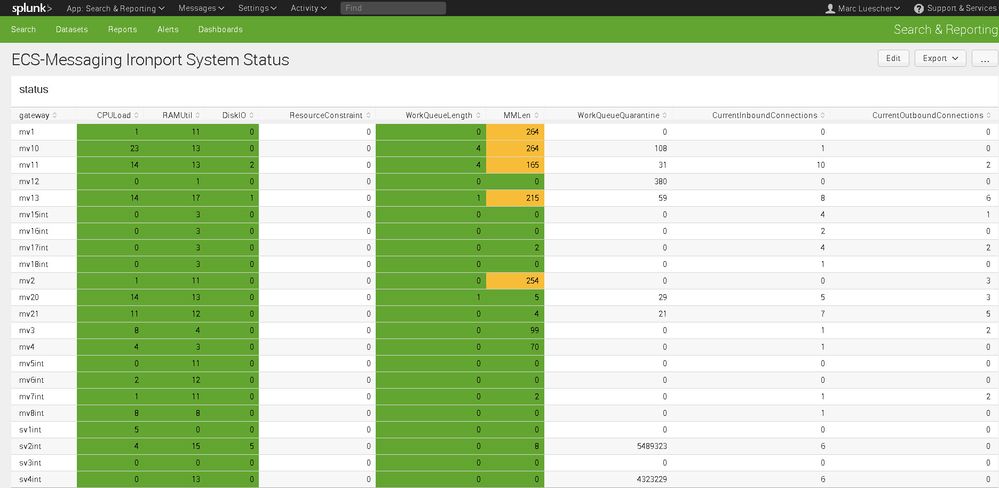
Just in case you needed it :
index=email log_source="status_logs_splunk" | dedup gateway | sort gateway | table gateway , CPULoad , RAMUtil , DiskIO , ResourceConstraint, WorkQueueLength, MMLen, WorkQueueQuarantine, CurrentInboundConnections, CurrentOutboundConnections
The last variables are field extractions out of the status_logs. Gateway is a lookuptable IP address to gatewayname.
Hope that helps. Maybe share your search querys.
- Mark as New
- Bookmark
- Subscribe
- Mute
- Subscribe to RSS Feed
- Permalink
- Report Inappropriate Content
04-19-2019 12:49 PM
Thanks, @marc.luescherFRE
My Splunk skills are very basic, so I'm probably doing this wrong, but I'm charting CPU and RAM with:
timechart avg(CPU_Total) by host
and
index=* RAM_Used>0 | timechart span=1h avg(RAM_Used) by host
where CPU_Total and RAM_Used are field extractions from the status log.
- Mark as New
- Bookmark
- Subscribe
- Mute
- Subscribe to RSS Feed
- Permalink
- Report Inappropriate Content
04-24-2019 01:44 AM
With Splunk, the aim is to ask the indexer to find as few events as possible (to complete your task), ask the indexer to perform most of the leg work, before it transfers those events to the Search Head where 'enrichment' occurs on those events. You can look up about efficient searches, after a while it becomes more natural as you design your searches.
1) So...first you need to specify the exact Index if possible. ( not always dedicated, and it may not be in an exactly known index - it isn't for me )
index=myesaindex
2) Next, you want to focus on the Status Logs from the ESAs. This all depends on how it comes in, but if you are picking up Status logs from a specific directory, then you can specify the SourceType for those events as they come into Splunk.
If you are receiving on Syslog 514 directly, then everything coming in will likely have the same SourceType.
index=myesaindex sourcetype=cisco:esa:statuslogs
Check the host on the events are the ESA hosts - otherwise, you need to extract this from the path (inefficient) or do some work on the input to get the host representing the ESA ( e.g. not the centralised Rsyslog server )
3) You need to extract the field values at Search Time. There is Field Extraction in the GUI, or you just write the extraction into the search.
index=myesaindex sourcetype=cisco:esa:statuslogs
| rex field=_raw "RAMUsd (?<cisco_esa_RAMUsd>\S+)"
| eval RAM_Used_MB = cisco_esa_RAMUsd/1024/1024
| timechart span=1h avg(RAM_Used_MB) by host limit=0
However, that is an almighty average down. You could hide 30mins of maximum RAM with 30mins of minimum RAM and reveal 50% RAM usage over the entire hour.
Ask yourself why you want to know about the stat. If its when things run out of memory, then I would go for max(RAM_Used) - I always go for max, as average hides the issues. I then add more complexity to remove spikes, which applies mostly to CPU stats.
- Mark as New
- Bookmark
- Subscribe
- Mute
- Subscribe to RSS Feed
- Permalink
- Report Inappropriate Content
04-05-2019 07:25 AM
@Paul Thomas Cyblue - that's correct.
CLI > logconfig > setup
System metrics frequency (seconds):
[60]>
Discover and save your favorite ideas. Come back to expert answers, step-by-step guides, recent topics, and more.
New here? Get started with these tips. How to use Community New member guide


