- Cisco Community
- Technology and Support
- Security
- Network Access Control
- Re: ISE 2.2 : High memory utilization issue
- Subscribe to RSS Feed
- Mark Topic as New
- Mark Topic as Read
- Float this Topic for Current User
- Bookmark
- Subscribe
- Mute
- Printer Friendly Page
- Mark as New
- Bookmark
- Subscribe
- Mute
- Subscribe to RSS Feed
- Permalink
- Report Inappropriate Content
08-21-2018 06:58 AM
Hello Team,
We have 2 ISE nodes in production environment. we have set 70 % of threshold for memory.
current utilization id 71 %. TAC is already opened. also suppressed radius logs.
Total RAM - 16 GB Hard disk - 1.4 TB
Any suggestions ??
Solved! Go to Solution.
- Labels:
-
Identity Services Engine (ISE)
Accepted Solutions
")
")
- Mark as New
- Bookmark
- Subscribe
- Mute
- Subscribe to RSS Feed
- Permalink
- Report Inappropriate Content
08-21-2018 07:04 AM
High memory usage itself is not an issue and could be part of normal operation. Are you seeing any other issues aside from the memory consumption? I suggest continue working with the TAC for root cause.
- Mark as New
- Bookmark
- Subscribe
- Mute
- Subscribe to RSS Feed
- Permalink
- Report Inappropriate Content
08-21-2018 10:03 AM
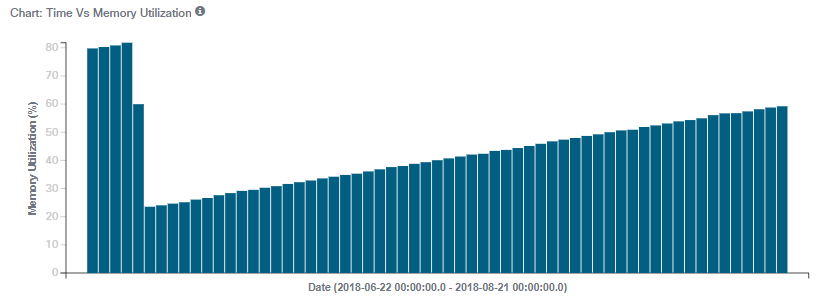
I've brought this up to TAC several times, and they say this behavior is expected.
What I've experienced is memory climbing at 1%/day until it gets up around 80%, and there it levels out.
However... without fail, at some point, we see the memory start to climb again > 80% and the application will crash. TAC has never been able to provide a root cause. They have always told us to install the latest available patch, and see if the issue still occurs. Which it does, but by then there's a newer patch out which they, again, tell us to install.
see attached screenshots. One shows the climb to 80%, the other shows mem exceeding 80%, then crash, then drops to 20% and climbs 1% every day again.
I'm curious to know what they say regarding your case. Some of the items they will certainly check and challenge (our deployment is a vm, so these may not apply to yours):
- do you have the recommended disk space allocated for this node's personas? (admin / mnt / policy have different requirements) must be thick provisioned.
- do you have appropriate hardware reservations in place fore CPU / Mem (does not matter what your current utilization is, these reservations must be in place.)
- do you have snapshots disabled
- are you at the latest available patch
- Mark as New
- Bookmark
- Subscribe
- Mute
- Subscribe to RSS Feed
- Permalink
- Report Inappropriate Content
09-26-2018 06:48 AM
Providing an update on this case.
TAC had me enabled the following debugs, and collect a support bundle to upload stating: "The bug fixed by patch 9 matches your issue's description perfectly but we need to keep investigating at the logs for more information."
- org-apache (appserver/catalina.out)
- org-apache-cxf (appserver/catalina.out)
- org-apache-digester (appserver/catalina.out)
- ise-psc
After reviewing the logs, TAC requested a webex for live troubleshoot, that happened yesterday. TAC performed the following during the webex:
- Install root-patch
- ran ps -ef grepping for 'java' 'iseadmi+'
- performed kill -3 for PID = jsvc COMMAND
- exported heapdump to localdisk for upload to the case
Currently waiting for log review.
")
- Mark as New
- Bookmark
- Subscribe
- Mute
- Subscribe to RSS Feed
- Permalink
- Report Inappropriate Content
09-26-2018 07:29 AM
I have received below comment from cisco TAC..
The memory utilization can be up to 100%, if the ISE doesn't report "Out of memory" alarm or there is no observable issue this is not an indication of the misbehavior. ISE is build to utilize all available memory.
- Mark as New
- Bookmark
- Subscribe
- Mute
- Subscribe to RSS Feed
- Permalink
- Report Inappropriate Content
12-25-2019 10:05 AM
We applied the latest patch 16 which (recommended) solves most of the issues like swap memory high utilization related to ISE 2.2 performance via ISE GUI .
Note : It will automatically install the patch on the ISE device , it will be rebooted as well.
- Mark as New
- Bookmark
- Subscribe
- Mute
- Subscribe to RSS Feed
- Permalink
- Report Inappropriate Content
08-21-2018 07:04 AM
High memory usage itself is not an issue and could be part of normal operation. Are you seeing any other issues aside from the memory consumption? I suggest continue working with the TAC for root cause.
- Mark as New
- Bookmark
- Subscribe
- Mute
- Subscribe to RSS Feed
- Permalink
- Report Inappropriate Content
08-21-2018 09:40 AM
Is it increasing around 1% every day?:
Operations > Reports > Diagnostics > Health Summary > Select server, select Last 30 Days or custom.
^^^^
available log history based on setting here: Administration > System > Logging > Local Log Setting
- Mark as New
- Bookmark
- Subscribe
- Mute
- Subscribe to RSS Feed
- Permalink
- Report Inappropriate Content
08-21-2018 09:49 AM - edited 08-21-2018 09:58 AM
Yes it is increasing every day...
- Mark as New
- Bookmark
- Subscribe
- Mute
- Subscribe to RSS Feed
- Permalink
- Report Inappropriate Content
08-21-2018 10:03 AM
I've brought this up to TAC several times, and they say this behavior is expected.
What I've experienced is memory climbing at 1%/day until it gets up around 80%, and there it levels out.
However... without fail, at some point, we see the memory start to climb again > 80% and the application will crash. TAC has never been able to provide a root cause. They have always told us to install the latest available patch, and see if the issue still occurs. Which it does, but by then there's a newer patch out which they, again, tell us to install.
see attached screenshots. One shows the climb to 80%, the other shows mem exceeding 80%, then crash, then drops to 20% and climbs 1% every day again.
I'm curious to know what they say regarding your case. Some of the items they will certainly check and challenge (our deployment is a vm, so these may not apply to yours):
- do you have the recommended disk space allocated for this node's personas? (admin / mnt / policy have different requirements) must be thick provisioned.
- do you have appropriate hardware reservations in place fore CPU / Mem (does not matter what your current utilization is, these reservations must be in place.)
- do you have snapshots disabled
- are you at the latest available patch
- Mark as New
- Bookmark
- Subscribe
- Mute
- Subscribe to RSS Feed
- Permalink
- Report Inappropriate Content
08-21-2018 09:54 AM - edited 08-21-2018 09:57 AM
Hello Anthony
Thanks for your response.
TAC suggested us to upgrade patch to 09
Is their any other resolution except patch upgrade ??
Regards
Sid
- Mark as New
- Bookmark
- Subscribe
- Mute
- Subscribe to RSS Feed
- Permalink
- Report Inappropriate Content
08-21-2018 10:09 AM
- Mark as New
- Bookmark
- Subscribe
- Mute
- Subscribe to RSS Feed
- Permalink
- Report Inappropriate Content
09-01-2018 05:44 PM
If your deployment hitting CSCvj53801, we should apply Patch 9 to address it, unless you want to live with restarting ISE services yourself periodically.
- Mark as New
- Bookmark
- Subscribe
- Mute
- Subscribe to RSS Feed
- Permalink
- Report Inappropriate Content
12-25-2019 10:05 AM
We applied the latest patch 16 which (recommended) solves most of the issues like swap memory high utilization related to ISE 2.2 performance via ISE GUI .
Note : It will automatically install the patch on the ISE device , it will be rebooted as well.
- Mark as New
- Bookmark
- Subscribe
- Mute
- Subscribe to RSS Feed
- Permalink
- Report Inappropriate Content
09-10-2018 08:33 AM
Just curious, have you installed Patch 9? and does the issue still exist after installing?
Thank you,
-Tony
- Mark as New
- Bookmark
- Subscribe
- Mute
- Subscribe to RSS Feed
- Permalink
- Report Inappropriate Content
09-10-2018 09:04 AM
No, we haven't upgrade to patch 09 yet.. however recently in last week we did password recovery activity and during this activity we had restarted both the ISE servers.
Post restart, memory utilization dropped to 41% and as of now everything looks good.
But still i have strong feeling that in future it may again start increasing day by day.
As of now memory utilization is under control. we will keep this under observation for next 1 week..and will take action accordingly
Regards
Sid
- Mark as New
- Bookmark
- Subscribe
- Mute
- Subscribe to RSS Feed
- Permalink
- Report Inappropriate Content
09-10-2018 09:18 AM
- Mark as New
- Bookmark
- Subscribe
- Mute
- Subscribe to RSS Feed
- Permalink
- Report Inappropriate Content
09-26-2018 06:48 AM
Providing an update on this case.
TAC had me enabled the following debugs, and collect a support bundle to upload stating: "The bug fixed by patch 9 matches your issue's description perfectly but we need to keep investigating at the logs for more information."
- org-apache (appserver/catalina.out)
- org-apache-cxf (appserver/catalina.out)
- org-apache-digester (appserver/catalina.out)
- ise-psc
After reviewing the logs, TAC requested a webex for live troubleshoot, that happened yesterday. TAC performed the following during the webex:
- Install root-patch
- ran ps -ef grepping for 'java' 'iseadmi+'
- performed kill -3 for PID = jsvc COMMAND
- exported heapdump to localdisk for upload to the case
Currently waiting for log review.
- Mark as New
- Bookmark
- Subscribe
- Mute
- Subscribe to RSS Feed
- Permalink
- Report Inappropriate Content
09-26-2018 07:29 AM
I have received below comment from cisco TAC..
The memory utilization can be up to 100%, if the ISE doesn't report "Out of memory" alarm or there is no observable issue this is not an indication of the misbehavior. ISE is build to utilize all available memory.
- Mark as New
- Bookmark
- Subscribe
- Mute
- Subscribe to RSS Feed
- Permalink
- Report Inappropriate Content
09-26-2018 07:40 AM
In our case, memory has never reached 100%. The ISE nodes always crash before that occurs. Also, an important distinction I continue to bring up to TAC: We do not experience High mem utilization. We experience memory utilization increasing at an average of 1%/day.
Discover and save your favorite ideas. Come back to expert answers, step-by-step guides, recent topics, and more.
New here? Get started with these tips. How to use Community New member guide