- Cisco Community
- Technology and Support
- Security
- Network Security
- Re: AIP-SSM 420002 - IPS requested to drop TCP packet from 'sour
- Subscribe to RSS Feed
- Mark Topic as New
- Mark Topic as Read
- Float this Topic for Current User
- Bookmark
- Subscribe
- Mute
- Printer Friendly Page
AIP-SSM 420002 - IPS requested to drop TCP packet from 'source' to 'destination'
- Mark as New
- Bookmark
- Subscribe
- Mute
- Subscribe to RSS Feed
- Permalink
- Report Inappropriate Content
10-05-2010 04:50 AM - edited 03-10-2019 05:08 AM
Hi guys,
I have an asa 5510 with aip-ssm installed. I have a DMZ with security level 90 where a web server is located.
When AIP-SSM is in inline mode i get the following message 4 Oct 05 2010 14:37:15 WEB 80 x.x.x.x 30115 IPS requested to drop TCP packet from WEB-DMZ:WEB/80 to OUTSIDE:x.x.x.x/30115
From what i can see the message apears many times with source interface the WEB-DMZ and destination either outside,inside or other dmz interface depending of who is requesting access to the web server.
The result is that the web server isnt accessible either from outside or inside.
The syslog id that i am getting is the 420002 but i didn't find any logical explation of why this id is triggered.
Any help ?
Thanks.
- Labels:
-
IPS and IDS
- Mark as New
- Bookmark
- Subscribe
- Mute
- Subscribe to RSS Feed
- Permalink
- Report Inappropriate Content
10-05-2010 08:35 AM
Hi,
Can you look at the events in the AIP SSM module and see what signature is being triggered when trying to access that particular server? Please do paste the event details here.
Thanks and Regards,
Prapanch
- Mark as New
- Bookmark
- Subscribe
- Mute
- Subscribe to RSS Feed
- Permalink
- Report Inappropriate Content
10-06-2010 05:27 AM
Hi,
This is really strange cause i cannot see any relative signature firing up The only signature that fires up is about the edonkey activity which is false positive and has as source and destination ip's the web server's and active directory only.
Thanks for your help.
- Mark as New
- Bookmark
- Subscribe
- Mute
- Subscribe to RSS Feed
- Permalink
- Report Inappropriate Content
10-06-2010 08:23 AM
Hi,
That's weird. You should be seeing a signature firing up with a drop action configured. Have you tried bypassing the IPS module and see if web server is accessible?
Thanks and Regards,
Prapanch
- Mark as New
- Bookmark
- Subscribe
- Mute
- Subscribe to RSS Feed
- Permalink
- Report Inappropriate Content
10-06-2010 11:19 PM
When AIP-SSM is operating is passive mode, everything is working fine. With the bypass feature on Auto mode still i get the same message.
One thing i have noticed is that my web server appears always as the source on the 420002 message.
Still, none can't access the web server when AIP-SSM is in inline mode.
- Mark as New
- Bookmark
- Subscribe
- Mute
- Subscribe to RSS Feed
- Permalink
- Report Inappropriate Content
10-07-2010 01:18 AM
Hi,
We should be seeing some signature firing. As a possible workaround, you can deny all traffic from/to the web server from being re-directed to the AIP SSM module. You will need to specify an ACL with a deny statement for the web server and a "permit ip any any" under the class-map configured for the ips.
Let me know if this helps!
Thanks and Regards,
Prapanch
- Mark as New
- Bookmark
- Subscribe
- Mute
- Subscribe to RSS Feed
- Permalink
- Report Inappropriate Content
10-07-2010 01:59 AM
What will i accomplish with that ? I want to inspect the traffic destined to the web server.
- Mark as New
- Bookmark
- Subscribe
- Mute
- Subscribe to RSS Feed
- Permalink
- Report Inappropriate Content
10-07-2010 07:59 AM
Hi,
Can you paste the output of "show statictics virtual-sensor"? Under this you should see the number of hits per signature. Based on this we can disable each of the signatures and see which one is exactly causing the bahvior we are seeing.
Thanks and Regards,
Prapanch
- Mark as New
- Bookmark
- Subscribe
- Mute
- Subscribe to RSS Feed
- Permalink
- Report Inappropriate Content
10-08-2010 12:58 AM
I understand that the bold part is the one that we are interested in.I can see now that many signatures where firing up blocking hosts but why they didn's show up on the IPS Manager ?
Here is the output :
Virtual Sensor Statistics
Statistics for Virtual Sensor vs0
Name of current Signature-Defintion instance = sig0
Name of current Event-Action-Rules instance = rules0
List of interfaces monitored by this virtual sensor = GigabitEthernet0/1 subinterface 0
General Statistics for this Virtual Sensor
Number of seconds since a reset of the statistics = 4406885
MemoryAlloPercent = 52
MemoryUsedPercent = 49
MemoryMaxCapacity = 600000
MemoryMaxHighUsed = 444416
MemoryCurrentAllo = 314134
MemoryCurrentUsed = 299241
Processing Load Percentage = 1
Total packets processed since reset = 1708939018
Total IP packets processed since reset = 1708939018
Total IPv4 packets processed since reset = 1708939018
Total IPv6 packets processed since reset = 0
Total IPv6 AH packets processed since reset = 0
Total IPv6 ESP packets processed since reset = 0
Total IPv6 Fragment packets processed since reset = 0
Total IPv6 Routing Header packets processed since reset = 0
Total IPv6 ICMP packets processed since reset = 0
Total packets that were not IP processed since reset = 0
Total TCP packets processed since reset = 1706764676
Total UDP packets processed since reset = 2174321
Total ICMP packets processed since reset = 21
Total packets that were not TCP, UDP, or ICMP processed since reset = 0
Total ARP packets processed since reset = 0
Total ISL encapsulated packets processed since reset = 0
Total 802.1q encapsulated packets processed since reset = 0
Total packets with bad IP checksums processed since reset = 0
Total packets with bad layer 4 checksums processed since reset = 0
Total number of bytes processed since reset = 1441199516738
The rate of packets per second since reset = 387
The rate of bytes per second since reset = 327033
The average bytes per packet since reset = 843
Denied Address Information
Number of Active Denied Attackers = 0
Number of Denied Attackers Inserted = 9
Number of Denied Attacker Victim Pairs Inserted = 0
Number of Denied Attacker Service Pairs Inserted = 0
Number of Denied Attackers Total Hits = 6460
Number of times max-denied-attackers limited creation of new entry = 0
Number of exec Clear commands during uptime = 0
Denied Attackers and hit count for each.
Denied Attackers with percent denied and hit count for each.
The Signature Database Statistics.
The Number of each type of node active in the system
Total nodes active = 229
TCP nodes keyed on both IP addresses and both ports = 58
UDP nodes keyed on both IP addresses and both ports = 27
IP nodes keyed on both IP addresses = 6
The number of each type of node inserted since reset
Total nodes inserted = 4205743
TCP nodes keyed on both IP addresses and both ports = 668125
UDP nodes keyed on both IP addresses and both ports = 1084132
IP nodes keyed on both IP addresses = 198488
The rate of nodes per second for each time since reset
Nodes per second = 0
TCP nodes keyed on both IP addresses and both ports per second = 0
UDP nodes keyed on both IP addresses and both ports per second = 0
IP nodes keyed on both IP addresses per second = 0
The number of root nodes forced to expire because of memory constraints
TCP nodes keyed on both IP addresses and both ports = 1302
Packets dropped because they would exceed Database insertion rate limits = 0
Fragment Reassembly Unit Statistics for this Virtual Sensor
Number of fragments currently in FRU = 0
Number of datagrams currently in FRU = 0
Number of fragments received since reset = 0
Number of fragments forwarded since reset = 0
Number of fragments dropped since last reset = 0
Number of fragments modified since last reset = 0
Number of complete datagrams reassembled since last reset = 0
Fragments hitting too many fragments condition since last reset = 0
Number of overlapping fragments since last reset = 0
Number of Datagrams too big since last reset = 0
Number of overwriting fragments since last reset = 0
Number of Inital fragment missing since last reset = 0
Fragments hitting the max partial dgrams limit since last reset = 0
Fragments too small since last reset = 0
Too many fragments per dgram limit since last reset = 0
Number of datagram reassembly timeout since last reset = 0
Too many fragments claiming to be the last since last reset = 0
Fragments with bad fragment flags since last reset = 0
TCP Normalizer stage statistics
Packets Input = 1706719760
Packets Modified = 0
Dropped packets from queue = 0
Dropped packets due to deny-connection = 0
Duplicate Packets = 0
Current Streams = 58
Current Streams Closed = 0
Current Streams Closing = 0
Current Streams Embryonic = 0
Current Streams Established = 0
Current Streams Denied = 0
Total SendAck Limited Packets = 0
Total SendAck Limited Streams = 0
Total SendAck Packets Sent = 0
Statistics for the TCP Stream Reassembly Unit
Current Statistics for the TCP Stream Reassembly Unit
TCP streams currently in the embryonic state = 0
TCP streams currently in the established state = 0
TCP streams currently in the closing state = 0
TCP streams currently in the system = 0
TCP Packets currently queued for reassembly = 0
Cumulative Statistics for the TCP Stream Reassembly Unit since reset
TCP streams that have been tracked since last reset = 0
TCP streams that had a gap in the sequence jumped = 0
TCP streams that was abandoned due to a gap in the sequence = 0
TCP packets that arrived out of sequence order for their stream = 0
TCP packets that arrived out of state order for their stream = 0
The rate of TCP connections tracked per second since reset = 0
SigEvent Preliminary Stage Statistics
Number of Alerts received = 1603101
Number of Alerts Consumed by AlertInterval = 643779
Number of Alerts Consumed by Event Count = 935814
Number of FireOnce First Alerts = 23
Number of FireOnce Intermediate Alerts = 105
Number of Summary First Alerts = 7650
Number of Summary Intermediate Alerts = 13410
Number of Regular Summary Final Alerts = 2318
Number of Global Summary Final Alerts = 0
Number of Active SigEventDataNodes = 247
Number of Alerts Output for further processing = 23508
Per-Signature SigEvent count since reset
Sig 3030.0 = 2
Sig 3051.0 = 297388
Sig 3051.1 = 637689
Sig 3327.13 = 5937
Sig 3653.0 = 56
Sig 5474.0 = 24
Sig 5575.0 = 282
Sig 5579.0 = 4
Sig 5581.0 = 40
Sig 5591.0 = 1
Sig 5606.0 = 162
Sig 5639.0 = 3
Sig 5640.2 = 1119
Sig 5776.3 = 1
Sig 5813.2 = 3
Sig 5822.1 = 8
Sig 6009.0 = 637689
Sig 6131.6 = 9425
Sig 6409.2 = 968
Sig 6984.2 = 154
Sig 7202.0 = 1977
Sig 11021.0 = 33
Sig 11205.0 = 84
Sig 16297.0 = 162
Sig 20059.1 = 9890
SigEvent Action Override Stage Statistics
Number of Alerts received to Action Override Processor = 2426
Number Of Meta Components Input = 21082
Number of Alerts where an override was applied = 227
Actions Added
deny-attacker-inline = 0
deny-attacker-victim-pair-inline = 0
deny-attacker-service-pair-inline = 0
deny-connection-inline = 0
deny-packet-inline = 0
modify-packet-inline = 0
log-attacker-packets = 227
log-pair-packets = 227
log-victim-packets = 227
produce-alert = 0
produce-verbose-alert = 143
request-block-connection = 0
request-block-host = 0
request-snmp-trap = 0
reset-tcp-connection = 0
request-rate-limit = 0
SigEvent Action Filter Stage Statistics
Number of Alerts received to Action Filter Processor = 0
Number of Alerts where an action was filtered = 408
Number of Filter Line matches = 408
Number of Filter Line matches causing decreased DenyPercentage = 0
Actions Filtered
deny-attacker-inline = 408
deny-attacker-victim-pair-inline = 0
deny-attacker-service-pair-inline = 0
deny-connection-inline = 0
deny-packet-inline = 0
modify-packet-inline = 0
log-attacker-packets = 0
log-pair-packets = 0
log-victim-packets = 0
produce-alert = 0
produce-verbose-alert = 0
request-block-connection = 0
request-block-host = 0
request-snmp-trap = 0
reset-tcp-connection = 0
request-rate-limit = 0
Filter Hit Counts
1 = 408
SigEvent Action Handling Stage Statistics.
Number of Alerts received to Action Handling Processor = 2425
Number of Alerts where produceAlert was forced = 0
Number of Alerts where produceAlert was off = 0
Number of Alerts using Auto One Way Reset = 0
Actions Performed
deny-attacker-inline = 9
deny-attacker-victim-pair-inline = 0
deny-attacker-service-pair-inline = 0
deny-connection-inline = 0
deny-packet-inline = 0
modify-packet-inline = 0
log-attacker-packets = 609
log-pair-packets = 609
log-victim-packets = 609
produce-alert = 2062
produce-verbose-alert = 799
request-block-connection = 0
request-block-host = 0
request-snmp-trap = 0
reset-tcp-connection = 0
request-rate-limit = 0
Deny Actions Requested in Promiscuous Mode
deny-packet not performed = 0
deny-connection not performed = 0
deny-attacker not performed = 1048
deny-attacker-victim-pair not performed = 0
deny-attacker-service-pair not performed = 0
modify-packet not performed = 0
Number of Alerts where deny-connection was forced for deny-packet action = 0
Number of Alerts where deny-packet was forced for non-TCP deny-connection action = 0
Anomaly Detection Statistics
Number of Received Packets:
TCP = 1706719760
UDP = 2173217
Other = 21
TOTAL = 1708892998
Number of Overrun Packets:
TCP = 0
UDP = 0
Other = 0
TOTAL = 0
Number of Ignored Packets = 0
Number of Events = 2736
Number of Recurrent Events:
TCP = 1622
UDP = 67
Other = 1
TOTAL = 1690
Number of Worms = 0
Number of Scanners = 0
Number of Scanners Under Worm = 0
Internal Zone
Number of Events:
TCP = 0
UDP = 0
Other = 0
TOTAL = 0
Number of Overrun Events:
TCP = 0
UDP = 0
Other = 0
TOTAL = 0
External Zone
Number of Events:
TCP = 1029
UDP = 1702
Other = 5
TOTAL = 2736
Number of Overrun Events:
TCP = 0
UDP = 0
Other = 0
TOTAL = 0
Illegal Zone
Number of Events:
TCP = 0
UDP = 0
Other = 0
TOTAL = 0
Number of Overrun Events:
TCP = 0
UDP = 0
Other = 0
TOTAL = 0
Global Utilization Percentage
Unestablished Connections DB
TCP = 0
UDP = 0
Other = 0
Recurrent Events DB
TCP = 0
UDP = 0
Other = 0
Scanners DB
TCP = 0
UDP = 0
Other = 0
- Mark as New
- Bookmark
- Subscribe
- Mute
- Subscribe to RSS Feed
- Permalink
- Report Inappropriate Content
10-08-2010 01:59 AM
Hi,
Now i am not sure why that is happening. It might be due to the produce alert action being removed. Can you have a check on each of these signatures to see if they have the "produce alert" action removed? If so, please enable that action again. Also, do you have an event action filter configured of some sort?
When trying to access the web server, which of the below counts do you see increasing?
Per-Signature SigEvent count since reset
Sig 3030.0 = 2
Sig 3051.0 = 297388
Sig 3051.1 = 637689
Sig 3327.13 = 5937
Sig 3653.0 = 56
Sig 5474.0 = 24
Sig 5575.0 = 282
Sig 5579.0 = 4
Sig 5581.0 = 40
Sig 5591.0 = 1
Sig 5606.0 = 162
Sig 5639.0 = 3
Sig 5640.2 = 1119
Sig 5776.3 = 1
Sig 5813.2 = 3
Sig 5822.1 = 8
Sig 6009.0 = 637689
Sig 6131.6 = 9425
Sig 6409.2 = 968
Sig 6984.2 = 154
Sig 7202.0 = 1977
Sig 11021.0 = 33
Sig 11205.0 = 84
Sig 16297.0 = 162
Sig 20059.1 = 9890
Thanks and Regards,
Prapanch
- Mark as New
- Bookmark
- Subscribe
- Mute
- Subscribe to RSS Feed
- Permalink
- Report Inappropriate Content
10-08-2010 04:50 AM
I have the sensor now inline, i am seeing the top signatures (3051.0-1,6009.0) counters to increase among others, i am not seeing yet any packet to get dropped -that's strange-. The only signature that i see on the IME real time event viewer is 7072 (edonkey traffic),which is a false positive.
I dont see any other signature firing up.
The only thing that i did was to check the produce verbose alert on the top signatures and nothing else.
This is a really strange behaviour...
- Mark as New
- Bookmark
- Subscribe
- Mute
- Subscribe to RSS Feed
- Permalink
- Report Inappropriate Content
10-08-2010 05:09 AM
The counters of those signatures are keep increasing.
Sig 3051.0 = 297388
Sig 3051.1 = 637689
Sig 6009.0 = 637689
I am not seeing any of these signatures on the IPS Manager Real Time Event Viewer.
- Mark as New
- Bookmark
- Subscribe
- Mute
- Subscribe to RSS Feed
- Permalink
- Report Inappropriate Content
10-08-2010 08:46 AM
Hi,
I hope you have the "produce alert" action configured on all of the signatures that i had mentioned previously. Do you have any "event action filters" or "event action overrides" configured? Could you post snapshots of those?
Also, if it's possible, try disbaling these signatures one-by-one and see if the server becomes accessible at any point.
Thanks and Regards,
Prapanch
- Mark as New
- Bookmark
- Subscribe
- Mute
- Subscribe to RSS Feed
- Permalink
- Report Inappropriate Content
10-08-2010 04:12 PM
Yes, the produce alert action is configured on all signatures. See the attached for the event filter configuration.
As for now, the sensor is in inline mode without dropping any traffic. From the show virtual sensor statistics command i see that the counters of specific signatures are increasing but on the IPS Manager only signature 7072 is shown...
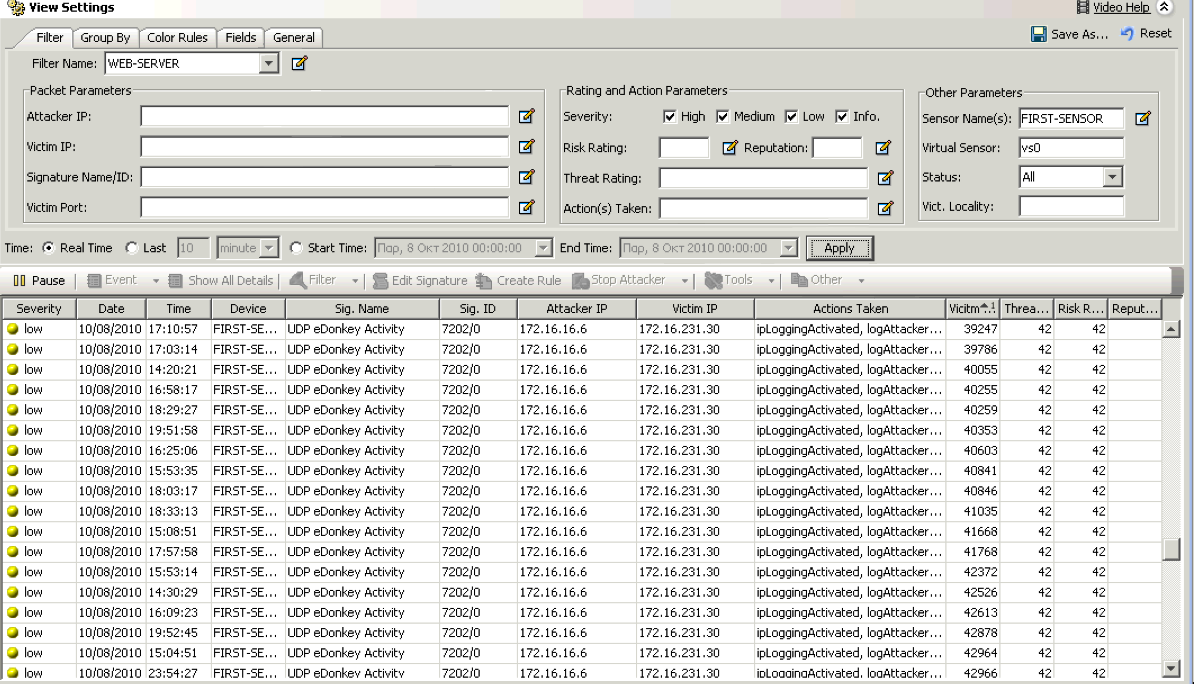
- Mark as New
- Bookmark
- Subscribe
- Mute
- Subscribe to RSS Feed
- Permalink
- Report Inappropriate Content
10-08-2010 05:14 PM
Hmmm... That's interesting. I would suggest you to open up a TAC case if that's possible to investigate further and look at it live. By the way, have you tried disabling the signatures one at a time to see which one is affecting access to the server? This way we will at least get to know which signature is being triggered.
Thanks and Regards,
Prapanch
Discover and save your favorite ideas. Come back to expert answers, step-by-step guides, recent topics, and more.
New here? Get started with these tips. How to use Community New member guide
