- Cisco Community
- Technology and Support
- Security
- Network Security
- FTD FPR-3110 front panel LED status
- Subscribe to RSS Feed
- Mark Topic as New
- Mark Topic as Read
- Float this Topic for Current User
- Bookmark
- Subscribe
- Mute
- Printer Friendly Page
- Mark as New
- Bookmark
- Subscribe
- Mute
- Subscribe to RSS Feed
- Permalink
- Report Inappropriate Content
08-28-2023 01:55 PM
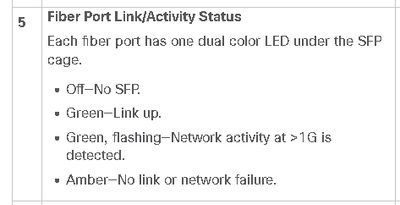
On FPR-3110, is it normal for front panel led's to remain solid amber while 10Gb modules are active? Integrated ports E1/9 and E1/15 with Cisco SFP-H10GB-CU2M DAC cabled to Cisco Nexus and Meraki MX devices are both "up" at 10Gb and passing traffic but the led's stay solid amber. Integrated port E1/16 connected with Cisco SFP-H10GB-CU1M to C9200L-24T-4X switches is flashing green during activity as expected. The result appears the same on two FPR units in a failover pair.
From Figure 6, #5 under the "Front Panel LEDs" section of the Cisco Secure Firewall 3100 Series Hardware Installation Guide at https://www.cisco.com/c/en/us/td/docs/security/secure-firewall/hardware/3100/fw-3100-install/m-overview.html#concept_wtw_wns_1cb -
version:
Model : Cisco Secure Firewall 3110 Threat Defense (80) Version 7.1.0 (Build 90)
Cisco Adaptive Security Appliance Software Version 9.17(1)
SSP Operating System Version 2.11(1.154)
Compiled on Tue 30-Nov-21 18:38 GMT by builders
System image file is "disk0:/installables/switch/fxos-k8-fp3k-lfbff.2.11.1.154.SPA"
interface and module info:
FTD /eth-uplink/fabric # show interface
Interface:
Port Name Port Type Admin State Oper State State Reason
-------------- ------------------ ----------- ---------------- ------------
Ethernet1/9 Data Enabled Up Up
Ethernet1/15 Data Enabled Up Up
Ethernet1/16 Data Enabled Up Up
FTD /fabric-interconnect # show inventory expand detail

Slot 1 Port 9:
User Label:
Oper State: Up
State Reason: Up
Mac: ***
Oper Speed: 10 Gbps
Oper Duplex: Full Duplex
Xcvr: H10G CU2M
Xcvr Model: SFP-H10GB-CU2M
Xcvr Vendor: CISCO-AMPHENOL
Xcvr Serial: ***
-
Slot 1 Port 15:
User Label:
Oper State: Up
State Reason: Up
Mac: ***
Oper Speed: 10 Gbps
Oper Duplex: Full Duplex
Xcvr: H10G CU2M
Xcvr Model: SFP-H10GB-CU2M
Xcvr Vendor: CISCO-AMPHENOL
Xcvr Serial: ***
-
Slot 1 Port 16:
User Label:
Oper State: Up
State Reason: Up
Mac: ***
Oper Speed: 10 Gbps
Oper Duplex: Full Duplex
Xcvr: H10G CU1M
Xcvr Model: SFP-H10GB-CU1M
Xcvr Vendor: CISCO-LEONI
Xcvr Serial: ***
FTD# show int E 1/9
Interface Ethernet1/9 "***", is up, line protocol is up
Hardware is EtherSVI, BW 10000 Mbps, DLY 10 usec
MAC address ***, MTU 1500
IP address ***, subnet mask ***
Traffic Statistics for "***":
2030986853 packets input, 1416466361513 bytes
2026357437 packets output, 1405897655590 bytes
13305933 packets dropped
1 minute input rate 12771 pkts/sec, 11460767 bytes/sec
1 minute output rate 12793 pkts/sec, 11503006 bytes/sec
1 minute drop rate, 25 pkts/sec
5 minute input rate 11366 pkts/sec, 10273283 bytes/sec
5 minute output rate 11379 pkts/sec, 10232430 bytes/sec
5 minute drop rate, 25 pkts/sec

FTD# show int E 1/15
Interface Ethernet1/15 "***", is up, line protocol is up
Hardware is EtherSVI, BW 10000 Mbps, DLY 10 usec
MAC address ***, MTU 1500
IP address ***, subnet mask ***
Traffic Statistics for "***":
1771990867 packets input, 2309041718465 bytes
573385197 packets output, 325281588275 bytes
4907948 packets dropped
1 minute input rate 2654 pkts/sec, 184788 bytes/sec
1 minute output rate 5280 pkts/sec, 6887652 bytes/sec
1 minute drop rate, 2 pkts/sec
5 minute input rate 2056 pkts/sec, 217032 bytes/sec
5 minute output rate 3925 pkts/sec, 4987184 bytes/sec
5 minute drop rate, 2 pkts/sec

FTD# show int E 1/16
Interface Ethernet1/16 "***", is up, line protocol is up
Hardware is EtherSVI, BW 10000 Mbps, DLY 10 usec
MAC address ***, MTU 1500
IP address ***, subnet mask ***
Traffic Statistics for "***":
342553666 packets input, 166504965283 bytes
860537109 packets output, 1041000550215 bytes
554508 packets dropped
1 minute input rate 10172 pkts/sec, 11328987 bytes/sec
1 minute output rate 7496 pkts/sec, 4580135 bytes/sec
1 minute drop rate, 13 pkts/sec
5 minute input rate 9414 pkts/sec, 10089656 bytes/sec
5 minute output rate 7507 pkts/sec, 5357048 bytes/sec
5 minute drop rate, 12 pkts/sec
show failover:
        This host: Secondary - Active
                Active time: 79859 (sec)
                  Interface [E 1/9] (***): Normal (Monitored)
                  Interface [E 1/15] (***): Normal (Monitored)
                  Interface [E 1/16] (***): Normal (Waiting)
        Other host: Primary - Standby Ready
                Active time: 14377 (sec)
                  Interface [E 1/9] (***): Normal (Monitored)
                  Interface [E 1/15] (***): Normal (Monitored)
                  Interface [E 1/16] (***): Normal (Waiting)
Solved! Go to Solution.
Accepted Solutions
- Mark as New
- Bookmark
- Subscribe
- Mute
- Subscribe to RSS Feed
- Permalink
- Report Inappropriate Content
12-04-2023 09:55 AM
Problem resolved after updating FTD (and FMC) from 7.1.x to 7.2.5.
- Mark as New
- Bookmark
- Subscribe
- Mute
- Subscribe to RSS Feed
- Permalink
- Report Inappropriate Content
08-28-2023 02:04 PM
I have seen this issue, if the ports are not connected - can you shutdown the ports which are not using - see any difference ?
- Mark as New
- Bookmark
- Subscribe
- Mute
- Subscribe to RSS Feed
- Permalink
- Report Inappropriate Content
08-28-2023 02:25 PM
Unused ports are already all shut down in the config.
- Mark as New
- Bookmark
- Subscribe
- Mute
- Subscribe to RSS Feed
- Permalink
- Report Inappropriate Content
12-04-2023 09:55 AM
Problem resolved after updating FTD (and FMC) from 7.1.x to 7.2.5.
Discover and save your favorite ideas. Come back to expert answers, step-by-step guides, recent topics, and more.
New here? Get started with these tips. How to use Community New member guide

