- Cisco Community
- Technology and Support
- Networking
- Networking Knowledge Base
- Configuration Example: Embedded Packet Capture on Cisco IOS and IOS XE
- Subscribe to RSS Feed
- Mark as New
- Mark as Read
- Bookmark
- Subscribe
- Printer Friendly Page
- Report Inappropriate Content
- Subscribe to RSS Feed
- Mark as New
- Mark as Read
- Bookmark
- Subscribe
- Printer Friendly Page
- Report Inappropriate Content
05-07-2013 10:19 AM - edited 03-01-2019 04:55 PM
- Introduction:
- Configuration Example:
- Verification:
- Cisco IOS-XE Configuration Example:
- Key Point to Remember:
- Related Information:
Introduction:
Embedded Packet Capture (EPC) is a packet capture facility that allows network administrators to capture packets flowing to, through, and from the device and to analyze them locally or save and export them for offline analysis by using a tool such as Wireshark. EPC simplifies network operations by allowing devices to become active participants in the management and operation of the network. This feature facilitates troubleshooting by gathering information about the packet format. This feature also facilitates application analysis and security.
Configuration Example:
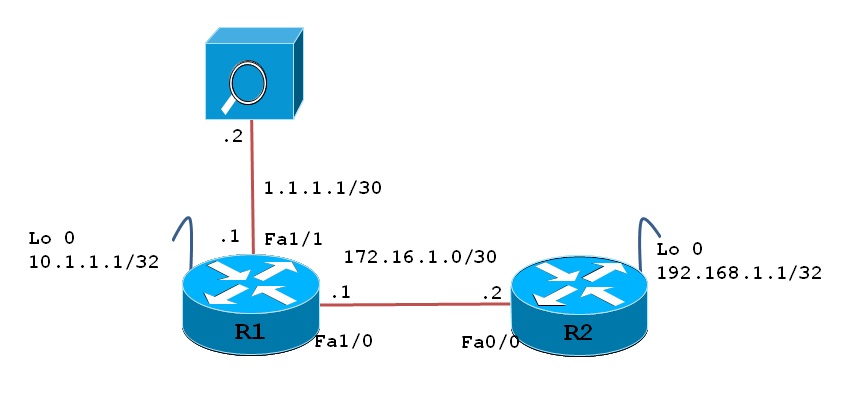
In the following topology we are capturing packets on R1 from and to host 192.168.1.1 and 10.1.1.1.Also we will send capture packet to TFTP server to analyze.
Step1: Define a 'capture buffer' with the specified name and parameters, which are a temporary buffer that captured packets, are stored within. There are various options that can be selected when the buffer is defined.
R1#monitor capture buffer PACKET_CAP size 2048 max-size 4000 circular
Step2: Optionally you can also specify access-list to get exact packet capture that will limit capture to desire traffic.
R1#conf t
Enter configuration commands, one per line. End with CNTL/Z.
R1(config)#ip access-list ex PACKET_CAP_FILTER
R1(config-ext-nacl)#permit ip host 10.1.1.1 host 192.168.1.1
R1(config-ext-nacl)#permit ip host 192.168.1.1 host 10.1.1.1
R1(config-ext-nacl)#end
R1#monitor capture buffer PACKET_CAP filter access-list PACKET_CAP_FILTER
Filter Association succeeded
R1#
Step3: Defines a capture point with the specified parameters.
The capture point is a traffic transit point where a packet is captured and associated with a buffer. You can define capture points by providing unique names and different parameters.
The following capture points are available:
•IPv4 CEF/interrupt switching path with interface input and output.
•IPv6 CEF/interrupt switching path with interface input and output.
R1# monitor capture point ip cef CAP_FA1/0 fastEthernet 1/0 both
R1#
*May 7 19:54:45.767: %BUFCAP-6-CREATE: Capture Point CAP_FA1/0 created.
Step4: Attach capture point with the capture buffer specified.
R1#monitor capture point associate CAP_FA1/0 PACKET_CAP
Step5: Enables the capture point to start capturing packet data:
R1#monitor capture point start CAP_FA1/0
R1#
*May 7 15:26:31.539: %BUFCAP-6-ENABLE: Capture Point CAP_FA0/0 enabled.
Now the capture is enabled and allows collecting necessary data as configure in ACL.
Step6: To disable the capture point and stops the packet data capture process use following command:
R1#monitor capture point stop CAP_FA1/0
R1#
*May 7 15:28:55.363: %BUFCAP-6-DISABLE: Capture Point CAP_FA1/0 disabled.
R1#
Verification:
1) To examine the capture in a summary view use “show monitor capture buffer all parameters” command.
R1#show monitor capture buffer all parameters
Capture buffer PACKET_CAP (circular buffer)
Buffer Size : 2097152 bytes, Max Element Size : 4000 bytes, Packets : 0
Allow-nth-pak : 0, Duration : 0 (seconds), Max packets : 0, pps : 0
Associated Capture Points:
Name : CAP_FA1/0, Status : Active
Configuration:
monitor capture buffer PACKET_CAP size 2048 max-size 4000 circular
monitor capture point associate CAP_FA1/0 PACKET_CAP
monitor capture buffer PACKET_CAP filter access-list PACKET_CAP_FILTER
2) To view Capture point detail use “show monitor capture point all” command
R1#show monitor capture point all
Status Information for Capture Point CAP_FA1/0
IPv4 CEF
Switch Path: IPv4 CEF , Capture Buffer: PACKET_CAP
Status : Active
Configuration:
monitor capture point ip cef CAP_FA1/0 FastEthernet1/0 both
R1#
3) To see information about captured packets use “show monitor capture buffer PACKET_CAP” command.
R1#show monitor capture buffer PACKET_CAP
R1#show monitor capture buffer PACKET_CAP
20:50:53.783 UTC May 7 2013 : IPv4 CEF Turbo : Fa1/0 None
20:50:53.783 UTC May 7 2013 : IPv4 LES CEF : Fa1/0 None
20:50:53.855 UTC May 7 2013 : IPv4 CEF Turbo : Fa1/0 None
20:50:53.855 UTC May 7 2013 : IPv4 LES CEF : Fa1/0 None
20:50:53.907 UTC May 7 2013 : IPv4 CEF Turbo : Fa1/0 None
20:50:53.907 UTC May 7 2013 : IPv4 LES CEF : Fa1/0 None
20:50:53.959 UTC May 7 2013 : IPv4 CEF Turbo : Fa1/0 None
4) To examine the buffer on the unit use "show monitor capture buffer PACKET_CAP dump" command.
R1#show monitor capture buffer PACKET_CAP dump
20:50:53.783 UTC May 7 2013 : IPv4 CEF Turbo : Fa1/0 None
66366B20: CA021544 001CC000 18100000 J..D..@.....
66366B30: 08004500 00640011 0000FE01 EFDCC0A8 ..E..d....~.o\@(
66366B40: 01010A01 01010800 D1210003 00000000 ........Q!......
66366B50: 00000121 AC04ABCD ABCDABCD ABCDABCD ...!,.+M+M+M+M+M
66366B60: ABCDABCD ABCDABCD ABCDABCD ABCDABCD +M+M+M+M+M+M+M+M
66366B70: ABCDABCD ABCDABCD ABCDABCD ABCDABCD +M+M+M+M+M+M+M+M
66366B80: ABCDABCD ABCDABCD ABCDABCD ABCDABCD +M+M+M+M+M+M+M+M
66366B90: ABCDABCD ABCD00 +M+M+M.
20:50:53.783 UTC May 7 2013 : IPv4 LES CEF : Fa1/0 None
66366B20: CA021544 001CC000 18100000 J..D..@.....
66366B30: 08004500 00640011 0000FE01 EFDCC0A8 ..E..d....~.o\@(
66366B40: 01010A01 01010800 D1210003 00000000 ........Q!......
66366B50: 00000121 AC04ABCD ABCDABCD ABCDABCD ...!,.+M+M+M+M+M
66366B60: ABCDABCD ABCDABCD ABCDABCD ABCDABCD +M+M+M+M+M+M+M+M
66366B70: ABCDABCD ABCDABCD ABCDABCD ABCDABCD +M+M+M+M+M+M+M+M
66366B80: ABCDABCD ABCDABCD ABCDABCD ABCDABCD +M+M+M+M+M+M+M+M
66366B90: ABCDABCD ABCD00 +M+M+M.
20:50:53.855 UTC May 7 2013 : IPv4 CEF Turbo : Fa1/0 None
--More--
5) Logs are seen in about output is in hexadecimal and difficult to understand. It’s better to export capture to TFTP or FTP server and check with the help of packet analyzer like Wireshark.
In our example TFTP server is connected to R1’s Fa1/1 interface. So first we will export captured packet to TFTP server and then analyze using wireshark as shown below:
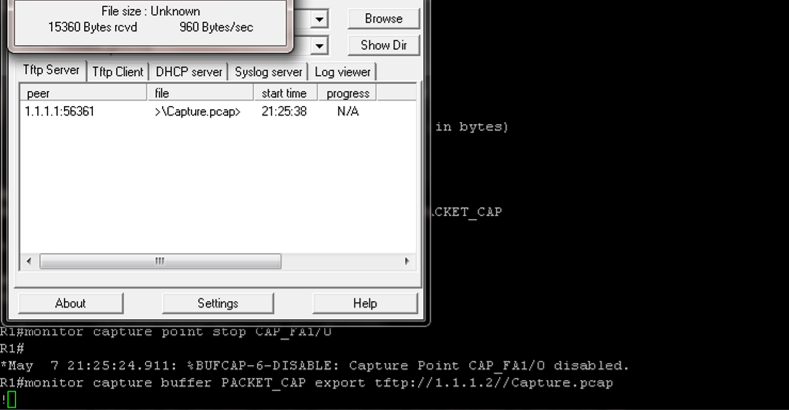
R1#monitor capture buffer PACKET_CAP export tftp://1.1.1.2//Capture.pcap
The below images show packet is getting transfer to TFTP server.
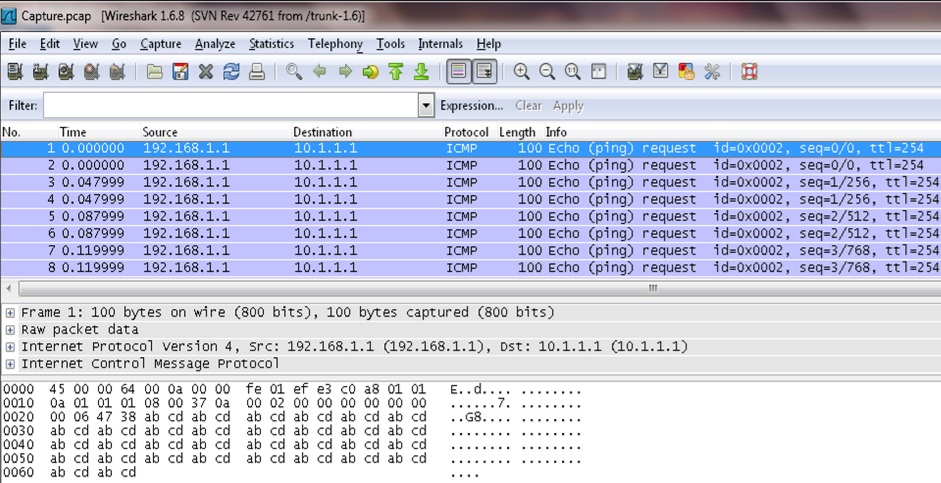
The below output shows packet capture file sent on TFTP server is analyze using Wireshark.
Cisco IOS-XE Configuration Example:
The following example shows how to manage packet data capture:
monitor capture PCAP interface GigabitEthernet0/3/0 both
monitor capture PCAP match ipv4 protocol tcp any any
monitor capture PCAP start
monitor capture PCAP stop
Verification Commands:
1) show monitor capture PCAP buffer dump
2) show monitor capture PCAP parameter
Troubleshooting Commands:
1) debug epc capture-point
2) debug epc provision
Key Point to Remember:
1) These feature requires Cisco IOS Release 12.4(20)T or later.
2) The Embedded Packet Capture feature was introduced in Cisco IOS-XE 3.7 - 15.2(4)S. The configuration of the capture is different than Cisco IOS as it adds more features.
3) The capture can be perform on physical interfaces, sub-interfaces, and tunnel interfaces.
4) The packet buffer is stored in DRAM and will not persist through reloads.
5) The capture configuration is not stored in NVRAM and will not persist through reloads
Related Information:
- Mark as Read
- Mark as New
- Bookmark
- Permalink
- Report Inappropriate Content
I have
Cisco IOS Software, IOS-XE Software (X86_64_LINUX_IOSD-ADVIPSERVICESK9-M), Version 15.1(3)S2, RELEASE SOFTWARE (fc1) and the command referenced here for IOS-XE dont work, however the IOS like syntax works well.
Another issue I am trying to capture traffic coming in the interface virtua-access however when i check my buffer nothing is being capture though traffic is flowing via that virtual-access, please help me to check if I am having anything wrong in the below configuration:
monitor capture buffer CHRISS size 256 max-size 100 circular
monitor capture point ip cef CHRISS virtual-access2.295 both
monitor capture point associate CHRISS CHRISS
monitor capture point start CHRISS
thank you
- Mark as Read
- Mark as New
- Bookmark
- Permalink
- Report Inappropriate Content
Hi ashirkar,
My buffer seems filler up verify quickly. I am using buffer size 4096 max-size 1500.
if i increase the buffer size, is it going to impact on router performance ?
- Mark as Read
- Mark as New
- Bookmark
- Permalink
- Report Inappropriate Content
How to analyze capture dump on screen in Hex using Wireshark (R1#show monitor capture buffer PACKET_CAP dump), if not transferred via tftp server?
20:50:53.783 UTC May 7 2013 : IPv4 CEF Turbo : Fa1/0 None
66366B20: CA021544 001CC000 18100000 J..D..@.....
66366B30: 08004500 00640011 0000FE01 EFDCC0A8 ..E..d....~.o\@(
66366B40: 01010A01 01010800 D1210003 00000000 ........Q!......
66366B50: 00000121 AC04ABCD ABCDABCD ABCDABCD ...!,.+M+M+M+M+M
66366B60: ABCDABCD ABCDABCD ABCDABCD ABCDABCD +M+M+M+M+M+M+M+M
66366B70: ABCDABCD ABCDABCD ABCDABCD ABCDABCD +M+M+M+M+M+M+M+M
66366B80: ABCDABCD ABCDABCD ABCDABCD ABCDABCD +M+M+M+M+M+M+M+M
66366B90: ABCDABCD ABCD00 +M+M+M.
How to format the above capture dump to use with WireShark?
- Mark as Read
- Mark as New
- Bookmark
- Permalink
- Report Inappropriate Content
It is easy-copy just the left HEX part/dont copy the most right part with the dots and letters/ to a notepad.Then go to Wireshark-->file-->import form Hex dump...and there you go--works fine even with XR
- Mark as Read
- Mark as New
- Bookmark
- Permalink
- Report Inappropriate Content
My challenge is how to capture data from a monitor session that is mirroring traffic from one interface to another?
In my case traffic destined for the INET router on Gi0/0/0 is mirrored to Gi1/0/22.
It seems pretty straight forward once the session is configured, however when I create a capture point for the interface the traffic is mirrored to Gi1/0/22 I get nothing at all in my capture.
Help!
- Mark as Read
- Mark as New
- Bookmark
- Permalink
- Report Inappropriate Content
Or even more simply there was a tool recently release here that will do the conversion for you.
https://cway.cisco.com/tools/CaptureGenAndAnalyse
-Jay
- Mark as Read
- Mark as New
- Bookmark
- Permalink
- Report Inappropriate Content
We are running "monitor capture" on interface tunnelxxx (ISR 4451) with match any for both directions, we can only see incoming traffic.
Could this be a bug?
Example of commands;
ip access-list extended any-any
permit tcp any any
permit udp any any
permit ip any any
monitor capture t1 interface tunnel12901 both access-list any-any
monitor capture t1 start
- Mark as Read
- Mark as New
- Bookmark
- Permalink
- Report Inappropriate Content
Is there a way to capture packets on 4G/LTE cellular interface using "monitor capture" feature on IOS-XE?
")
- Mark as Read
- Mark as New
- Bookmark
- Permalink
- Report Inappropriate Content
Hi
Why are captured only ECHO packets ?
Where are the reply packets .
The configured capture is for both directions
Ilir
Find answers to your questions by entering keywords or phrases in the Search bar above. New here? Use these resources to familiarize yourself with the community: