vManage Network Wide Path Insight Introduction and Q&A thread
- Mark as New
- Bookmark
- Subscribe
- Mute
- Subscribe to RSS Feed
- Permalink
- Report Inappropriate Content
03-11-2021 01:02 AM
Starting from version 20.4.1, vManage introduced new "Network Wide Path Insight" page, the user doc link can be found at:
In this thread, I'll walk you through how to utilize this new tool step by step, and how it can help with your network operation.
Step 0: Prerequisite
a) Network Wide Path Insight only works with cEdge devices for now, including Catalyst 8000 Series Routers, ISR Series Routers and ASR1000 Series Routers. Virtual router Catalyst 8000v model is also supported.
b) Software version must be: 20.4.1 or later for vManage, 17.4.1 or later for cEdge.
c) You must enable Data Stream in vManage [Administration] -> [Settings] -> [Data Stream] section as below:
Step 1: Specify observation site and VPN, input application/IP/port/DSCP filters.
a) Go to vManage [Monitor] -> [Network Wide Path Insight], first fill in the site id of the SD-WAN site you want to inspect, and then you have to choose the VPN you want to inspect, choose a VPN from the drop down list listing available VPNs.
b) Optional: similar to all other logging/debugging/troubleshooting, specifying additional filters like IP address, Application, Protocol(TCP or UDP) can help you minimize noise output.
c) Once you're done, hit the "Start" button. A trace operation will be created on all the cEdge devices located in that site you choose, and start to collect information we need.
Step 2: View live flow status
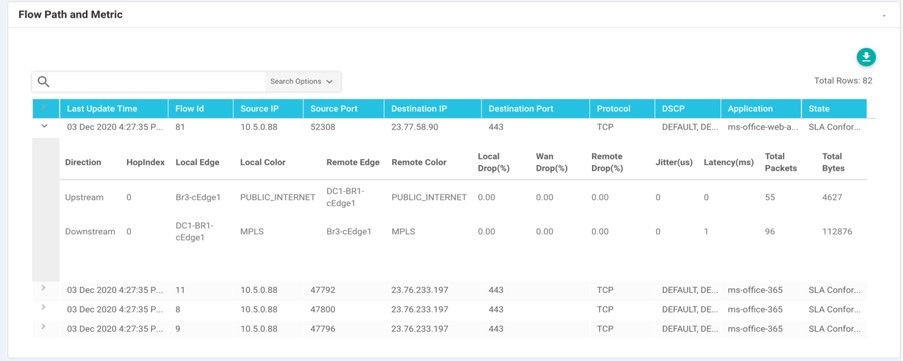
a) Assume you have live traffic in your network and exactly matching the filters you specified in Step1, just wait 10 to 20 seconds and you'll be able to see multiple flow entries in Flow Path and Metric tab as below:
b) For each flow, we can see flow tuple (ip/port combination), application, DSCP, network path, drop rate, latency, jitter and statistics information for both upstream and downstream directions of the flow. Here in most typical cases, upstream direction is the client to server direction while downstream direction is the server to client direction. (Conditions may change when you try to observe it from different point, but you can also check the destination port of the flow, normally it would be 53(DNS)/80(HTTP)/443(HTTPS) listening by the servers so you get to know which direction is client to server and vice versa.)
c) Use the search box to the up and left of this section to find your interested flow and expand the flow record to see detail information.
Step 3: Deep dive into a flow
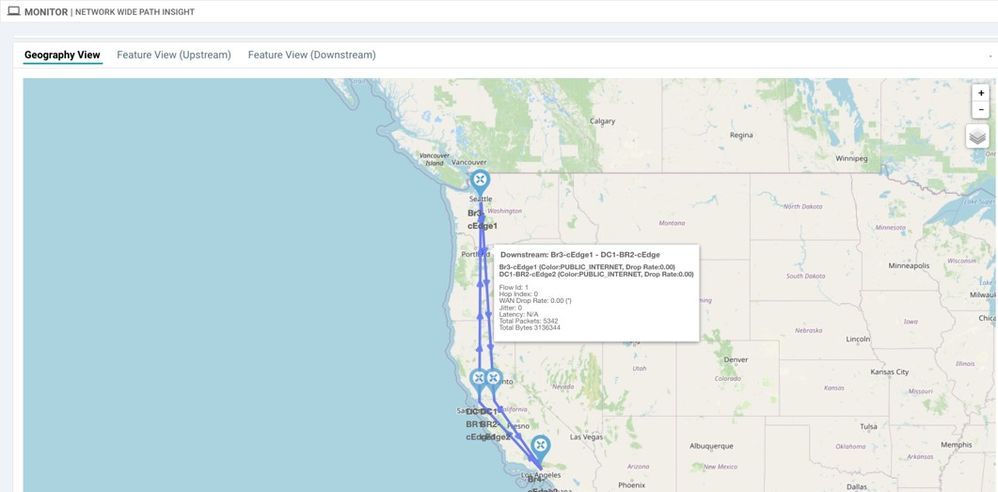
a) Now assume you have chosen one single flow from step2, and you want to understand how this flow was processed by your SD-WAN network, keep the flow record expanded in Flow Path and Metric tab, then first you can go to geography view tab to observe where the flow has been traveled to.
b) Secondly, you can go to Feature View (Upstream or Downstream) tab to check which features processed the flow and how they processed it.
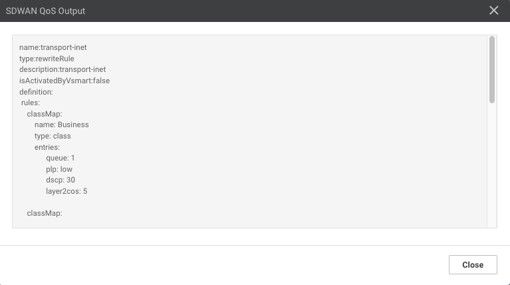
c) Thirdly, for one specific feature, take "SDWAN QoS Outpt" feature for example, you can check the policy configuration of SD-WAN QoS on that device by clicking on the feature detail information, then a pop up windows will appear to tell you what's the present policy configuration of SD-WAN QoS.
Step 4: Stop the trace.
a) Once you've done with your current troubleshooting/inspection, you can stop the trace on devices, and all information collected from the trace will still be available in vManage as long as storage space is sufficient. (Will automatically wipe out oldest when storage space running low.)
b) "Stop" button in policy section can stop current displaying trace session.
c) If you want to see other traces, go to Trace History tab, click on "detail" link to the right most of the table to switch to the trace you want to see.
Please understood that it's impossible to describe everything in detail in such a short conversation, in case you have doubts, please take this thread as a Q&A thread and feel free to leave your question in reply, we'll try our best to answer.
Thanks.
- Labels:
-
SD-WAN vManage
- Mark as New
- Bookmark
- Subscribe
- Mute
- Subscribe to RSS Feed
- Permalink
- Report Inappropriate Content
04-04-2021 05:21 PM
- Mark as New
- Bookmark
- Subscribe
- Mute
- Subscribe to RSS Feed
- Permalink
- Report Inappropriate Content
11-22-2022 08:57 AM
Please check out our new video: First packet match of encrypted SaaS app and path optimization in Cisco SD-WAN verified in 1 minute with Network Wide Path Insight: https://youtu.be/ZcsSVckYdXA
- Mark as New
- Bookmark
- Subscribe
- Mute
- Subscribe to RSS Feed
- Permalink
- Report Inappropriate Content
11-27-2022 03:30 AM
Thanks for sharing this wonderful session.
- Mark as New
- Bookmark
- Subscribe
- Mute
- Subscribe to RSS Feed
- Permalink
- Report Inappropriate Content
05-27-2023 10:32 PM
HI, two questions:
1. What happens when one of the devices is a vEdge? Will the tool throw an error or fail?
2. Can this be used to determine a flow being DIAed directly to the internet at a site with a cEdge?
- Mark as New
- Bookmark
- Subscribe
- Mute
- Subscribe to RSS Feed
- Permalink
- Report Inappropriate Content
05-28-2023 06:49 PM
Hello AngryEyebrows:
1, If you start trace on a site with vEdges, the tool will tell you there are unsupported device models.
If you start trace on a site with cEdges, but traffic passing through a vEdge, you'll only see system IP of vEdge devices without other detail information. vEdge devices will only process traffic forwarding, but will not process NWPI data collection.
2, Yes, we support DIA using data policy, NAT default route, Cloud on-ramp for SaaS, and SIG (secure internet gateway). Please make a try!
Thanks for your query, have a good day!


