- Cisco Community
- Technology and Support
- Security
- Security Knowledge Base
- Cisco Endpoint Security Analytics (CESA) dashboard overview and FAQ
- Subscribe to RSS Feed
- Mark as New
- Mark as Read
- Bookmark
- Subscribe
- Printer Friendly Page
- Report Inappropriate Content
- Subscribe to RSS Feed
- Mark as New
- Mark as Read
- Bookmark
- Subscribe
- Printer Friendly Page
- Report Inappropriate Content
01-19-2021 12:35 PM - edited 01-13-2022 07:56 AM
The following guide goes over the in and out of the Cisco Endpoints Security Analytics (CESA) Dashboard as an overview and faq page
For more information on the product offering, licensing, support, and how to solution (TAC) guide links and more please visit the CESA POV page.
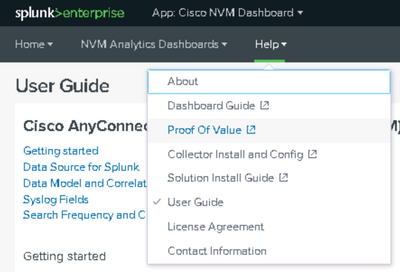
Most of the information needed to operate the dashboard and underlying information is under the help section of the app.
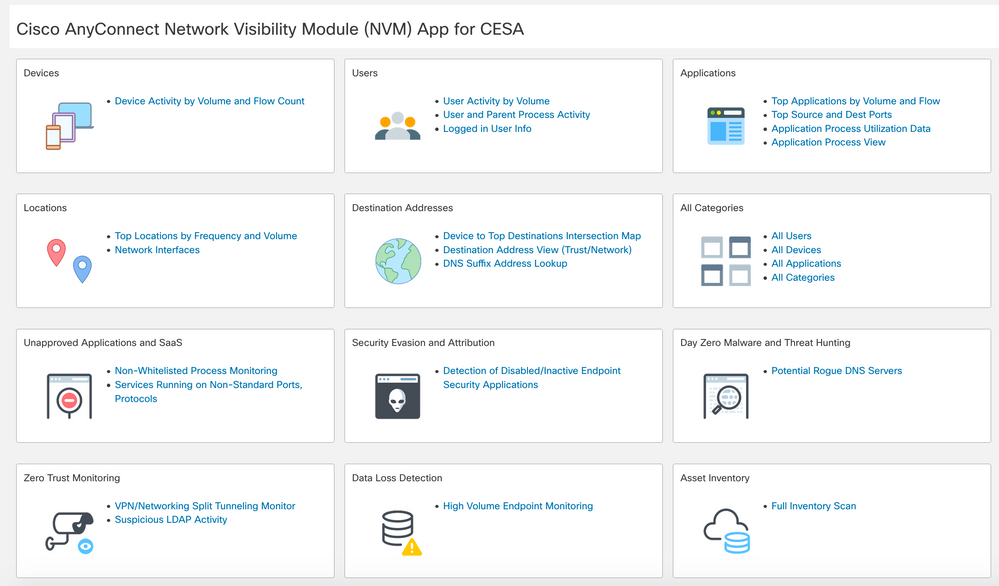
- Cisco Endpoint Security Analytics on Splunk Dashboard elements:
- In-depth dashboard element overview:
- Top Categories View
- Device to Top Destination Intersection Map
- Destination Address View (Trust/Network)
- Top Source and Destination Ports View
- Top Locations by Frequency and Volume View
- Top Devices View
- Applications View
- User Activity by Volume View
- User and Parent Process
- Process Listing
- Process Usage View
- Logged In Users Info
- Showcase Logged-in User Visibility
- DNS Suffix Addresses Info
- Network Interfaces
- Non-Whitelisted Process Monitoring
- Services Running on Non-Standard Ports, Protocols
- Security Evasion and Attribution
- Potential Rogue DNS Servers
- VPN/Networking Split Tunneling Monitor
- Suspicious LDAP Activity- Provides a summary of all LDAP connection events
- Data Loss Detection
- Asset Inventory
- USE CASE FLOWS
- Trace Path of Malicious Software
- Day-Zero Malware & Threat Hunting
- CESA Dashboard & TA updates for Splunk App Release Notes
- v4.0.5 January 2022
- v4.0.4 December 2021
- v4.0.2 October 2021
- v4.0.1 August 2021
- Frequently Asked Questions
- Where does the DNS information come from?
- How do I see the licensing usage in Splunk?
Cisco Endpoint Security Analytics on Splunk Dashboard elements:
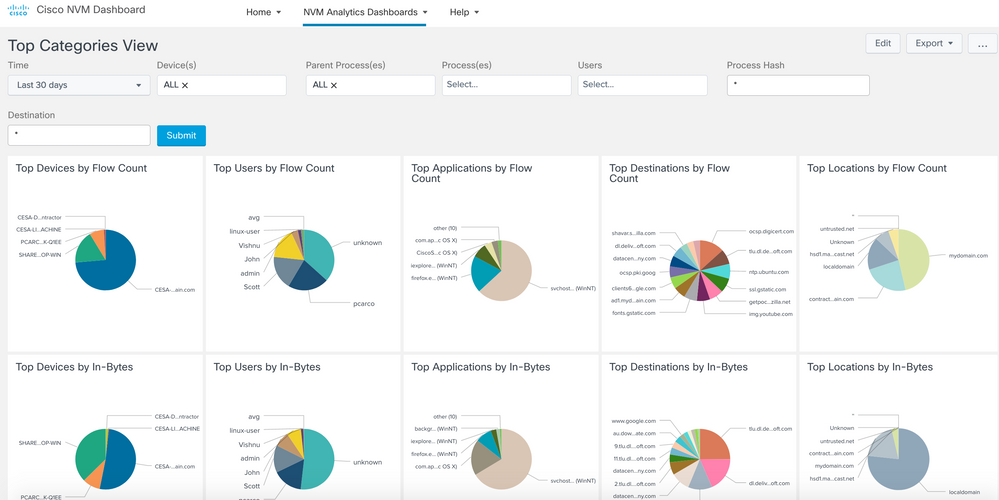
- All Categories Top 15 View - Provides a pie chart view of all 5 categories of data - Devices, Users, Applications, Locations, Destinations. The grouping is based on a number of flows, total incoming bytes, and total outgoing bytes at layer 4.
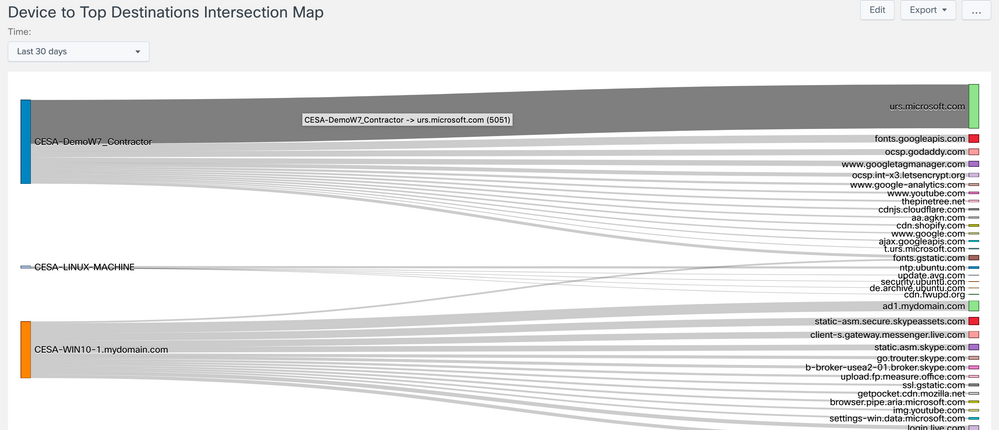
- Device to Top Destination Intersection Map - Provides a Sankey diagram mapping the top destinations to the devices that are connecting to them.
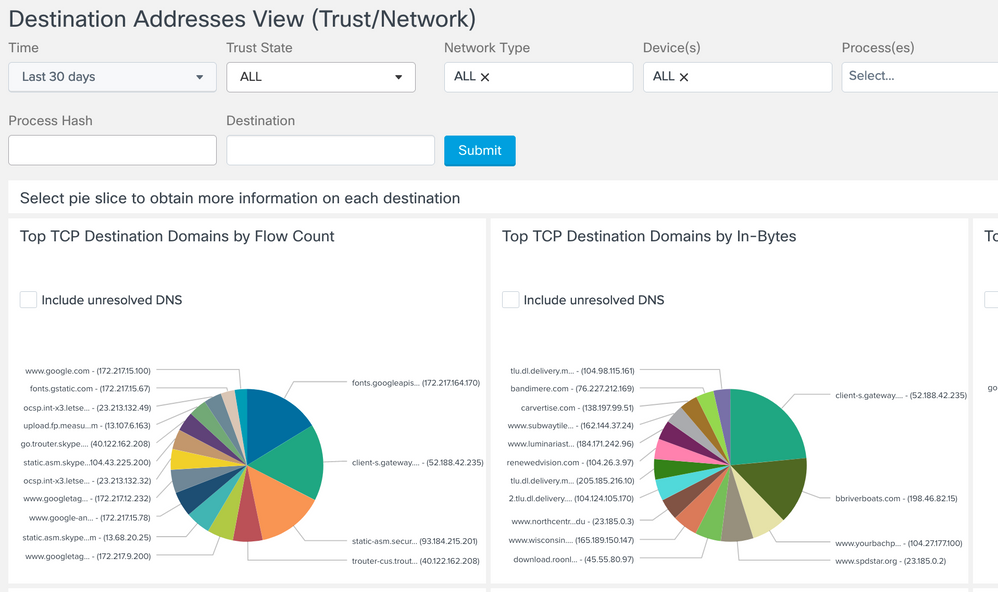
- Destination Address View (Trust/Network) - Provides a pie chart view of top 15 Destination Domains, Destination IPv4 addresses, and Destination IPv6 addresses. The grouping is based on a number of flows, total incoming bytes, and total outgoing bytes at layer 4. Filter by Trust State (All | Trusted | Untrusted) and by Network Type (ALL | Specific Networks Types listed at end of document), as well as other fields like 'User'
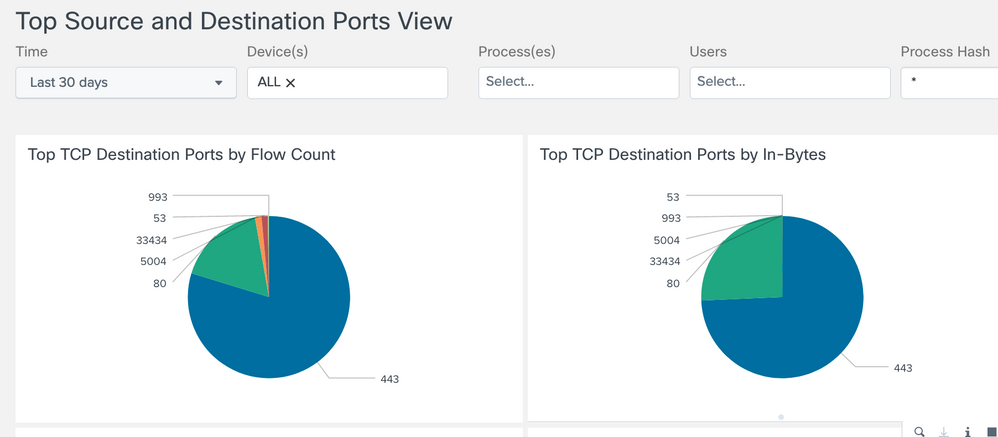
- Source and Destination Ports View - Provides a pie chart view of top 15 Source and Destination Ports. The grouping is based on a number of flows, total incoming bytes, and total outgoing bytes at layer 4.
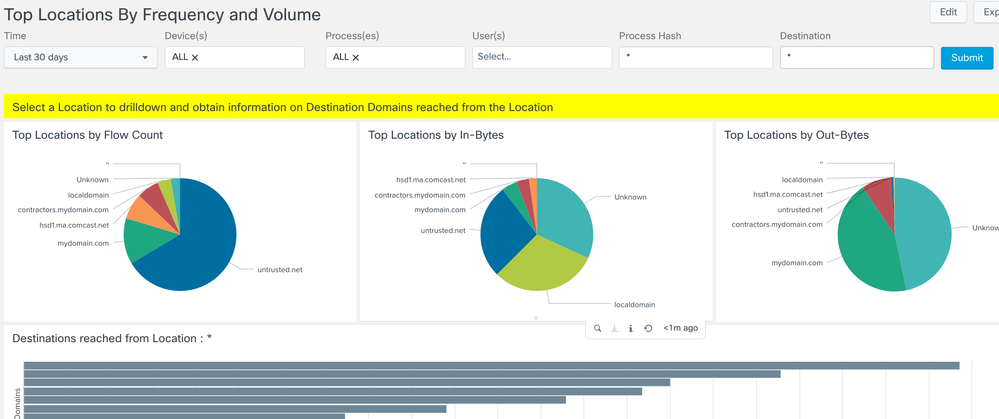
- Locations View - Provides a pie chart view of the top 15 DNS Suffix Addresses from where network traffic has been generated. The grouping is based on a number of flows, total incoming bytes, and total outgoing bytes at layer 4. The view also allows you to drill down to visualize a list of destination domains reached from a Location as both a bar chart and Sankey diagram.
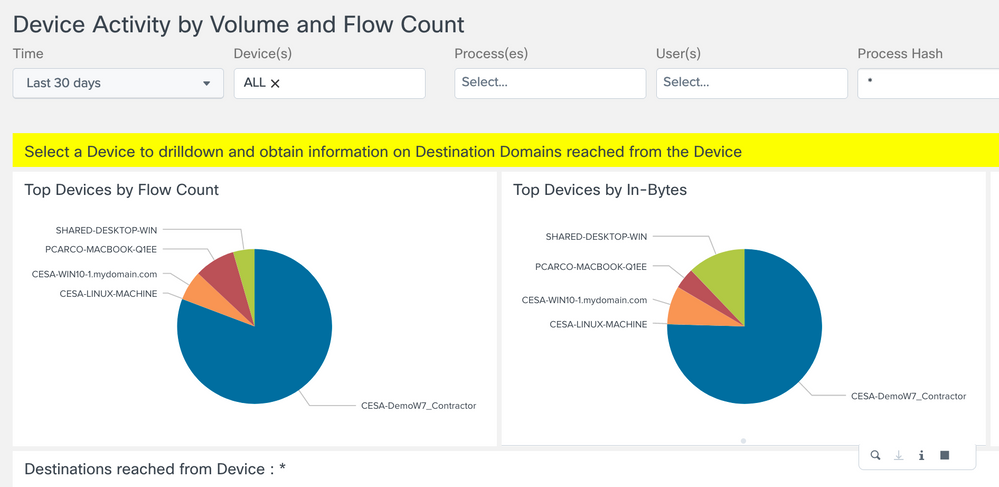
- Devices View - Provides a pie chart view of the top 15 Devices generating network traffic. The grouping is based on a number of flows, total incoming bytes, and total outgoing bytes at layer 4. The view also allows you to drill down to visualize a list of destination domains reached from a Device as both a bar chart and a Sankey diagram.
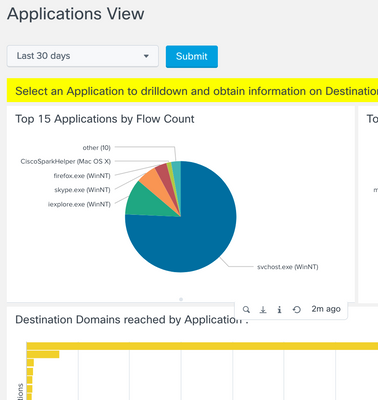
- Applications View - Provides a pie chart view of the top 15 Applications generating network traffic. The grouping is based on a number of flows, total incoming bytes, and total outgoing bytes at layer 4. The view also allows you to drill down to visualize a list of destination domains reached from an Application as both a bar chart and a Sankey diagram.
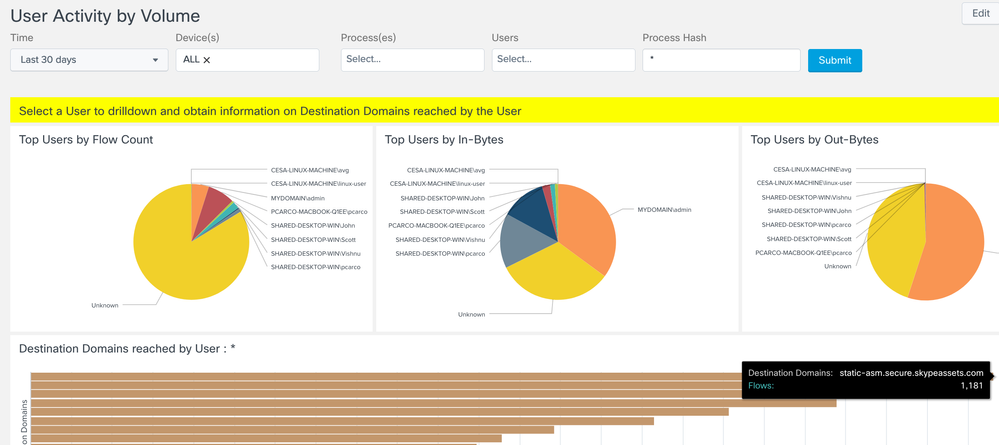
- Users View - Provides a pie chart view of top 15 logged in Users in the Network. The grouping is based on number of flows, total incoming bytes and total outgoing bytes at layer 4. The view also allows you to drilldown to visualize a list of destination domains reached by a User as both a bar chart and a Sankey diagram.
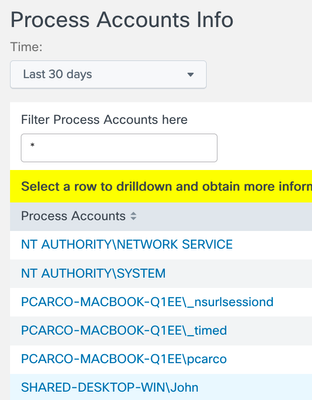
- Process Accounts Info - Provides a list of fully Qualified domain names of all User accounts under whose context Applications have generated network traffic. This view also allows you to drilldown to obtain more information about the Applications executed by that user.
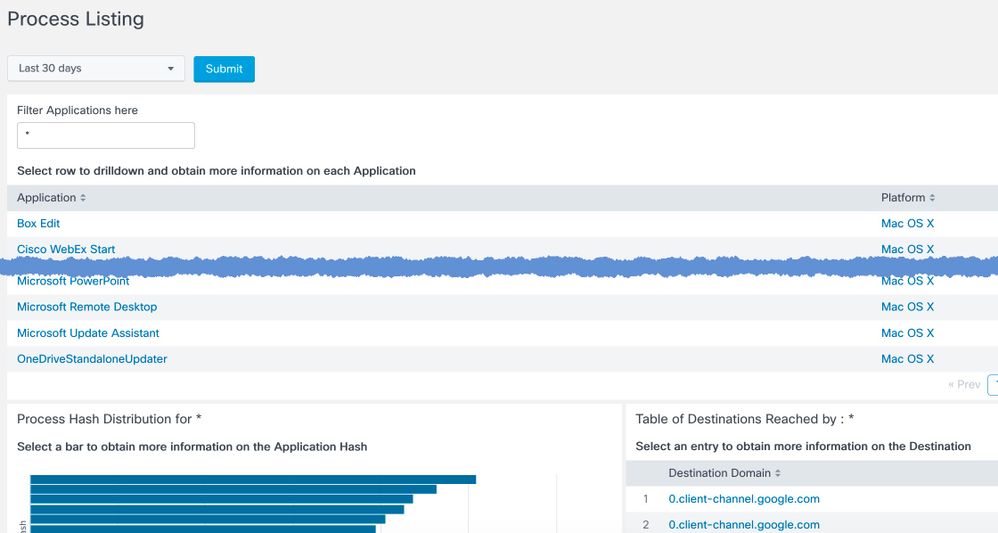
- Process Listing - Provides a list of All Applications generating network traffic. The view also allows you to drilldown to obtain more information on the different versions of the Application available on the network and the destinations reached by the Application.
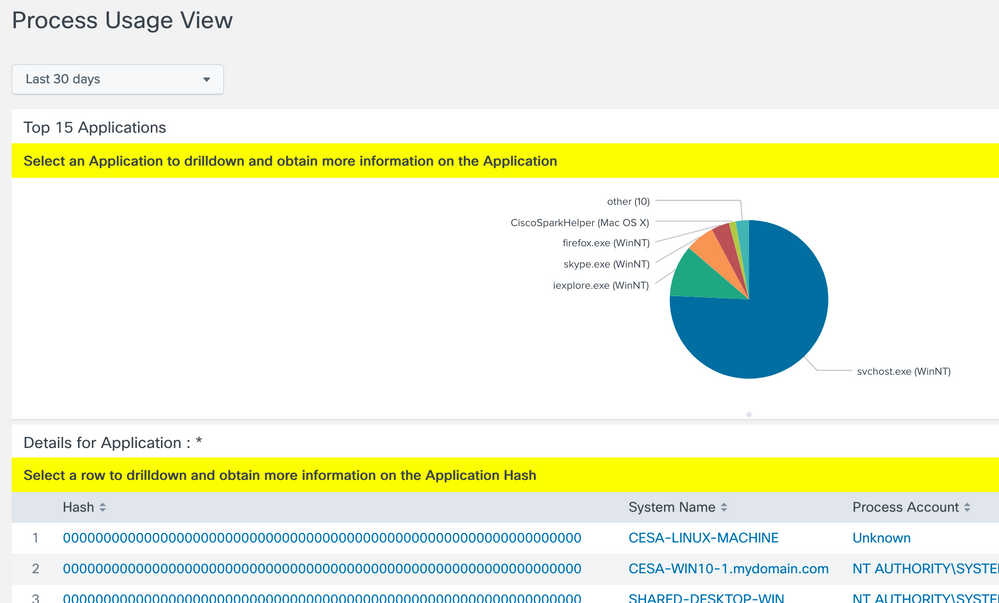
- Process Usage View - Provides a pie chart view of top 15 Applications in the network. The view also allows you to drilldown to obtain greater detail on a selected application.
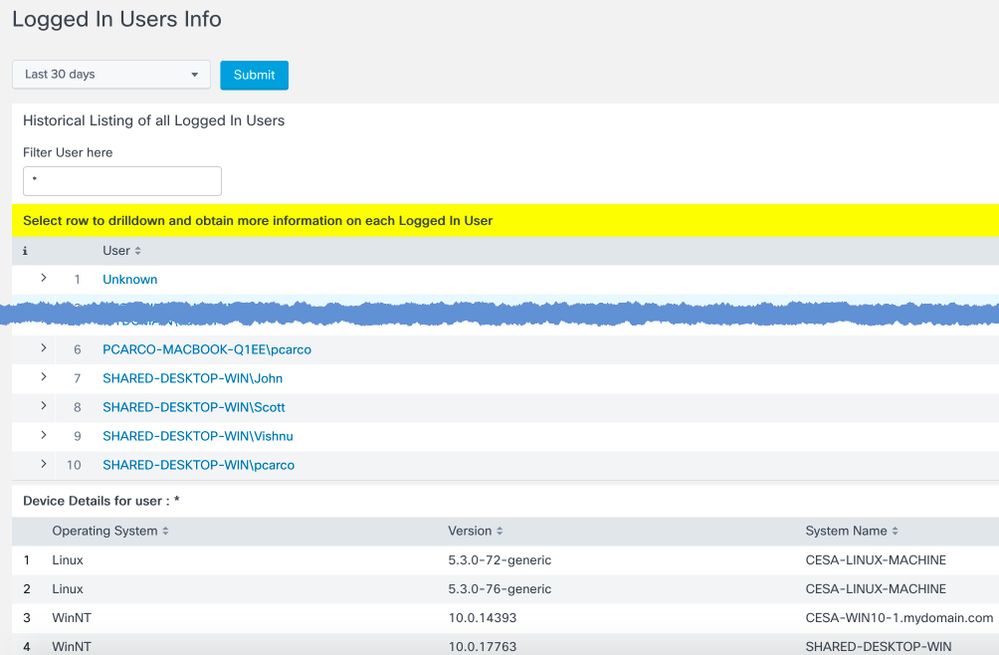
- Logged In Users Info - Provides a list of All Logged-In Users on the Network. You can also drilldown on any row to obtain Device, Locations and Destinations of that User.
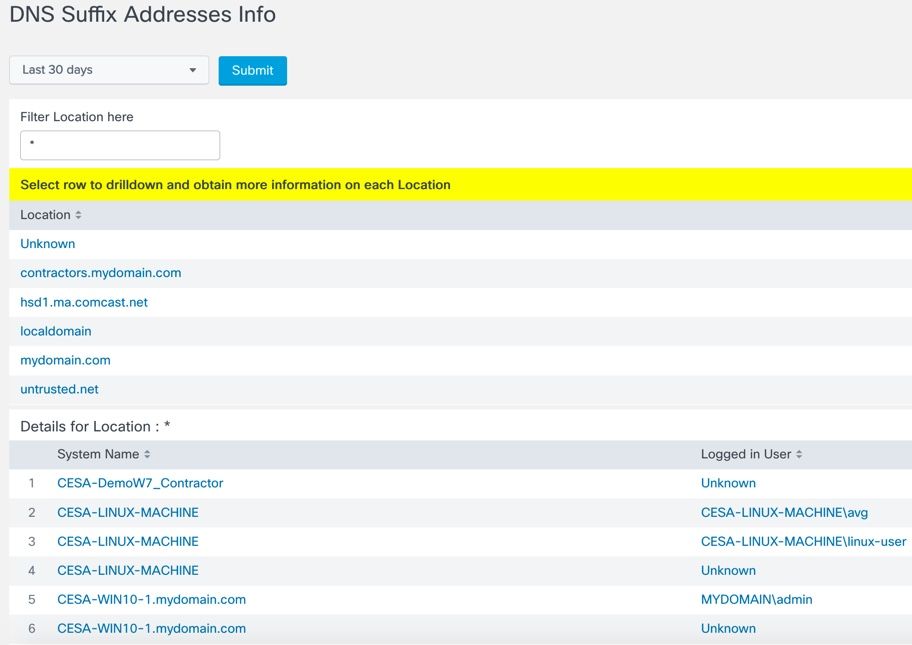
- DNS Suffix Addresses Info - Provides a list of DNS Suffix Addresses from where Users have accessed the network. Selecting a particular row allows you to obtain the list of Devices from a given DNS Suffix Address.
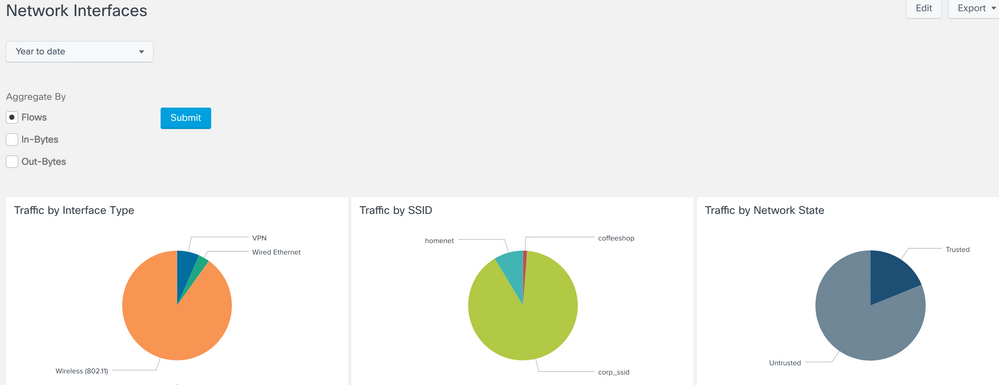
- Network Interfaces - Summarizes flows based on client interface type, SSID, and trusted network state.
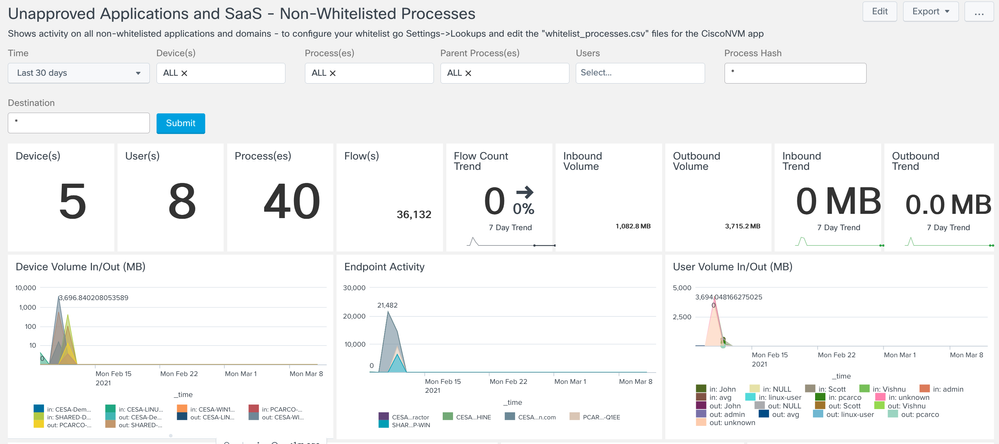
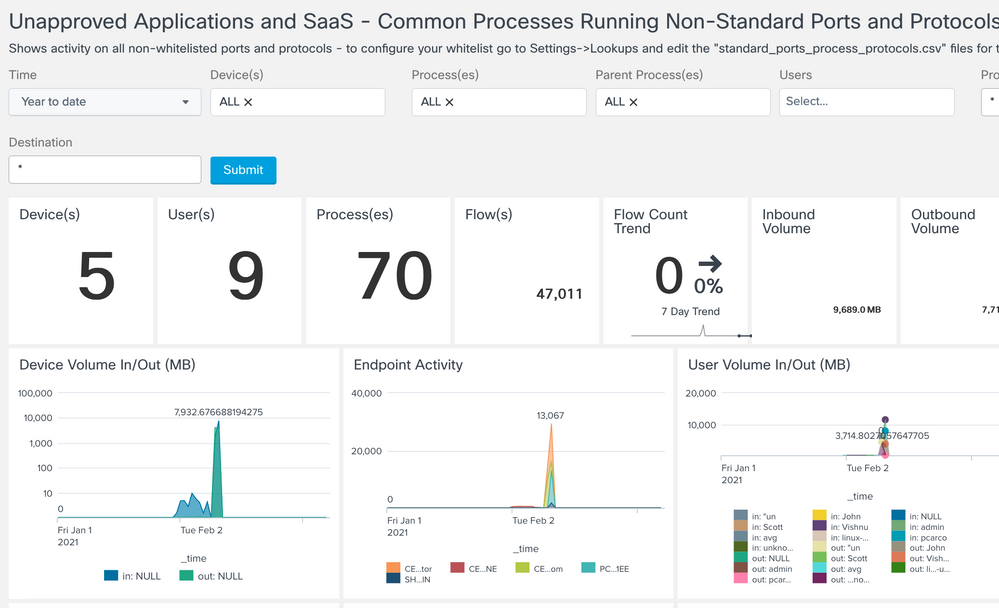
- Non-Whitelisted Process Monitoring - Provides a summary of ALL flows not defined in the lookup file whitelist_processes.csv file
- Services Running on Non-Standard Ports, Protocols - Provides a summary of ALL flows not defined int he lookup file standard_ports_process_protocols.csv
- Detection of Disabled/Inactive Endpoint Security Applications - Provides a summary of ALL users that have not sent flows in the past 60 days
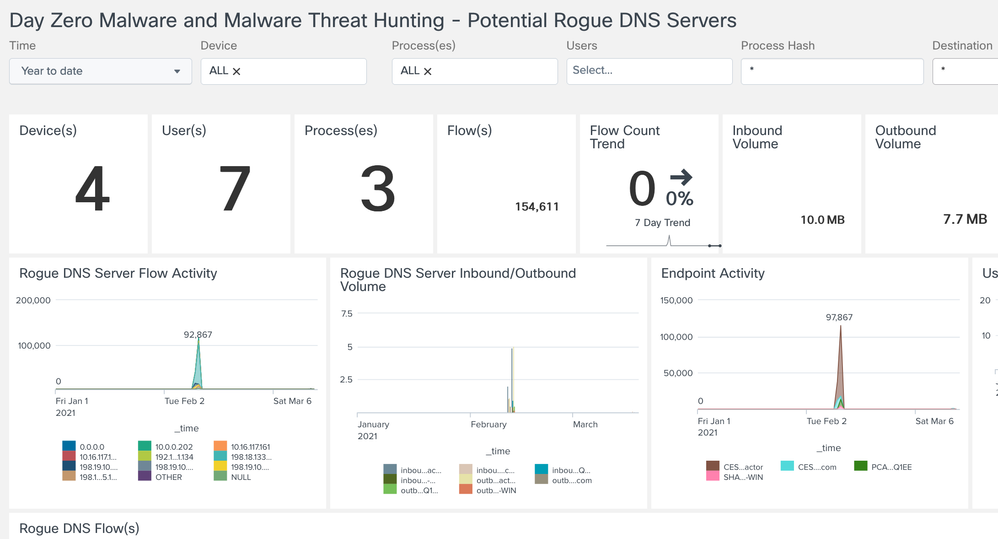
- Potential Rogue DNS Servers - Provides a summary of ALL potential rouge DNS servers, defaulting searches based on source port 53
- Process Path Investigation - Provides a summary of ALL process paths of known executables that can help in threat investigation to identify suspicious/malicious activities if any
- Protocols on uncommon ports - Provides a summary of all protocols that are being executed through uncommon ports
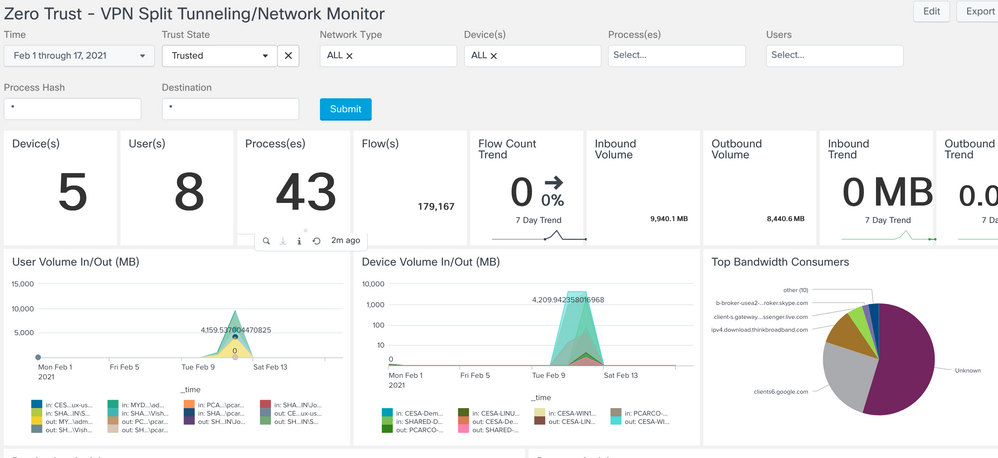
- VPN/Networking Split Tunneling Monitor - Provides a summary of all corporate network and non-VPN traffic
- To determine when AnyConnect VPN is active, select Network Type='VPN' and capture the time window(s) when a VPN is active for a specific user or all users
- To monitor split exclude traffic (including AnyConnect VPN Dynamic Split Tunneling), select a time window when VPN is active and set Trust='Untrusted'
- To monitor split include traffic (including AnyConnect VPN Dynamic Split Tunneling), set State='Trusted' and Network Type 'VPN'.
- To monitor split networking on premise, select State='Trusted' and match against 'ssid=your-corp-ssid'. Any ssid value that does not match during this time window while State='Trusted' is split-network traffic.
- To look for potential ssid spoofing, set State='Untrusted' and search for 'ssid=your-corp-ssid'
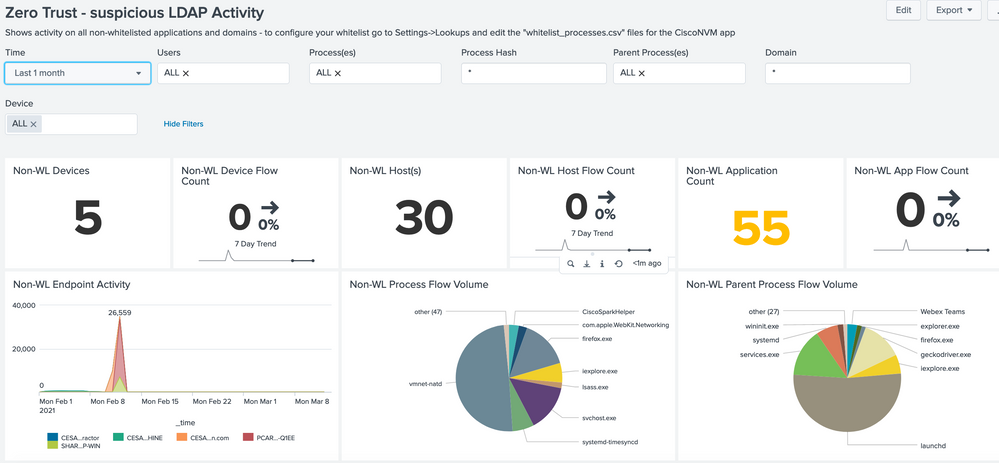
- Suspicious LDAP Activity - Provides a summary of all LDAP connection events
- High Volume Endpoint Monitoring - Provide a summary of all Device data, focused on data in/out add top resource hogs
- Full Inventory Scan - Provides a detailed summary of ALL network assets
In-depth dashboard element overview:
Note this guide uses examples from the CESA POV Kit Data attached to the bottom of the CESA POV page - make sure you take into account the date of the data set. Its not recommended to use All Time in queries but usually something like year-to-date works well if the data is this year.
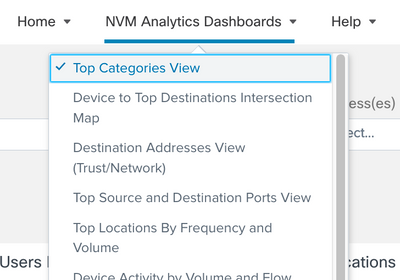
This listing is by order
Top Categories View
Provides a pie chart view of all 5 categories of data - Devices, Users, Applications, Locations, Destinations. The grouping is based on number of flows, total incoming bytes and total outgoing bytes at layer 4.
Device to Top Destination Intersection Map
Provides a Sankey diagram mapping the top destinations to the devices that are connecting to them.
Destination Address View (Trust/Network)
Provides a pie chart view of top 15 Destination Domains, Destination IPv4 addresses and Destination IPv6 addresses. The grouping is based on number of flows, total incoming bytes and total outgoing bytes at layer 4. Filter by Trust State (All | Trusted | Untrusted) and by Network Type (ALL | Specific Networks Types listed at end of document), as well as other fields like 'User'
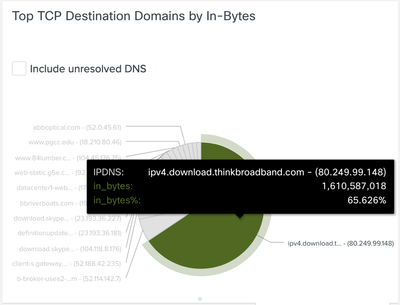
Our POV sample data set doesn’t have a traditional SaaS service traffic in it such as Dropbox. But by way of example we can use “download.thinkbroadband.com”, a service used to test broadband speeds, as an example. Hovering over Top TCP Destination Domains by In-Bytes see the data going over Trusted interface for download.thinkbroadband.com. From this example we can see that the thinkbroadband.com service actually uses a lot of bandwidth and may be something a customer would want to monitor in their environment or create policy to block it based on this CESA data.
Top Source and Destination Ports View
Provides a pie chart view of top 15 Source and Destination Ports. The grouping is based on number of flows, total incoming bytes and total outgoing bytes at layer 4.
Top Locations by Frequency and Volume View
Provides a pie chart view of top 15 DNS Suffix Addresses from where network traffic has been generated. The grouping is based on number of flows, total incoming bytes and total outgoing bytes at layer 4. The view also allows you to drilldown to visualize a list of destination domains reached from a Location as both a bar chart and Sankey diagram.
Top Devices View
Device Activity by Volume and Flow Count
Provides a pie chart view of top 15 Devices generating network traffic. The grouping is based on number of flows, total incoming bytes and total outgoing bytes at layer 4. The view also allows you to drilldown to visualize a list of destination domains reached from a Device as both a bar chart and a Sankey diagram.
Applications View
Provides a pie chart view of top 15 Applications generating network traffic. The grouping is based on number of flows, total incoming bytes and total outgoing bytes at layer 4. The view also allows you to drilldown to visualize a list of destination domains reached from an Application as both a bar chart and a Sankey diagram.
User Activity by Volume View
Provides a pie chart view of top 15 logged in Users in the Network. The grouping is based on number of flows, total incoming bytes and total outgoing bytes at layer 4. The view also allows you to drilldown to visualize a list of destination domains reached by a User as both a bar chart and a Sankey diagram.
User and Parent Process
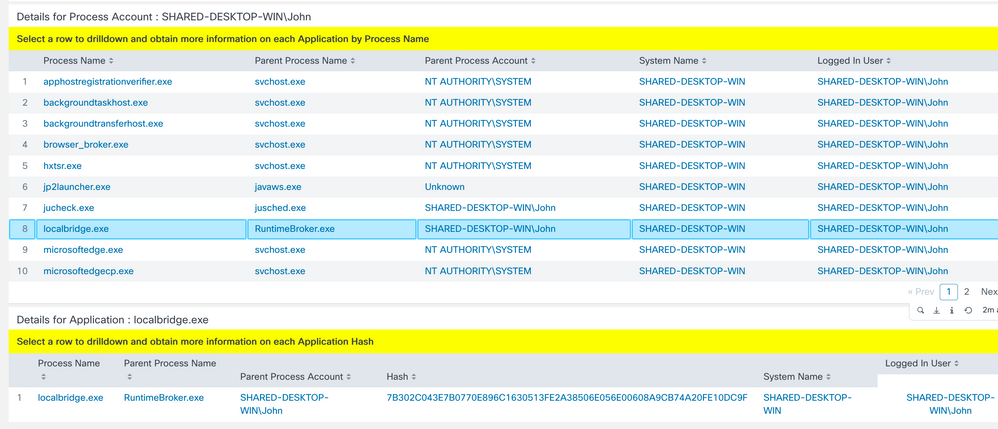
Question: What strange software processes are in use and by what users? This will allow you to get the connection between the processes and users. Let’s look at localbridge.exe. Why is there only 1 user using it? And why did it show up just in the past two days?
Select User and Parent Process Activity
In this example I clicked on John (on the 2nd page of users) and it showed all the processes on his machines. I found a process running called localbridge.exe in the search and is a file known to have lots of corruptions.
Process Accounts Info
Provides a list of fully Qualified domain names of all User accounts under whose context Applications have generated network traffic. This view also allows you to drilldown to obtain more information about the Applications executed by that user.
Click on the lower item process hash to launch cross to other sites
Process Listing
Provides a list of All Applications generating network traffic. The view also allows you to drill down to obtain more information on the different versions of the Application available on the network and the destinations reached by the Application.
Process Usage View
Provides a pie chart view of top 15 Applications in the network. The view also allows you to drilldown to obtain greater detail on a selected application.
Logged In Users Info
Provides a list of All Logged-In Users on the Network. You can also drill down on any row to obtain the Device, Locations, and Destinations of that User.
Showcase Logged-in User Visibility
An attacker could SSH into a compromised endpoint and start performing malicious activity hiding his tracks behind that of the console user of the endpoint. CESA now provides visibility into both the console user of the machine and the logged-in users for remote sessions like RDP and SSH for processes launched through such sessions. As you can see below, the remote user “Raghul” is initiating a “Data hoarding” activity by having remotely logged into the DESKTOP-ONFHG3
DNS Suffix Addresses Info
Provides a list of DNS Suffix Addresses from where Users have accessed the network. Selecting a particular row allows you to obtain the list of Devices from a given DNS Suffix Address.
Network Interfaces
Summarizes flows based on client interface type, SSID, and trusted network state.
Non-Whitelisted Process Monitoring
Provides a summary of ALL flows not defined in the lookup file whitelist_processes.csv file
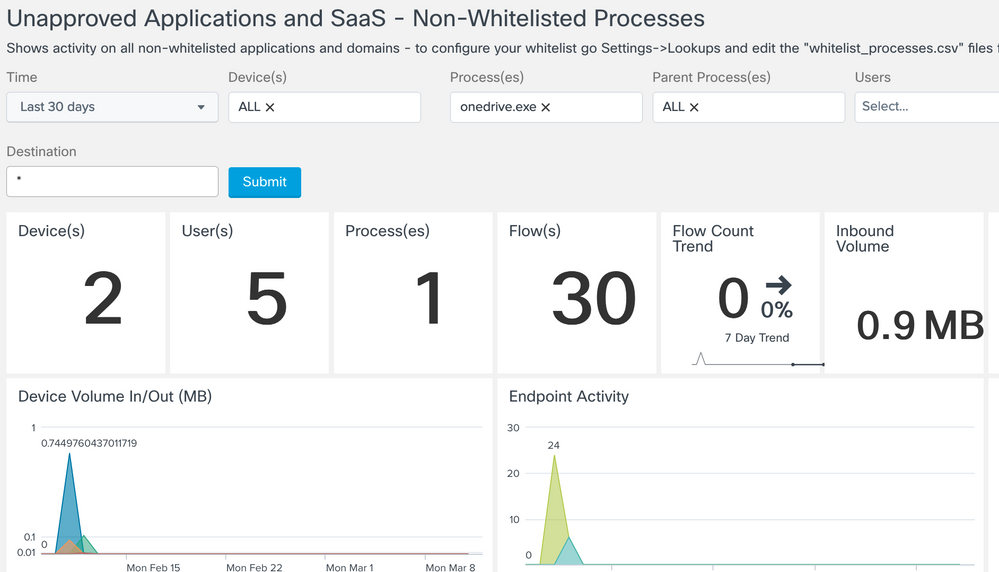
Unapproved Applications & SaaS > Non-Whitelisted Process Monitoring
What processes are going to what destinations? For example maybe you want to see what’s going to “doubleclick” domain. All unauthorized applications, where are they going, what kind of data is going out?
Whitelisted processes are something that is set and customizable in a CSV file that’s in Splunk but not something we are going to use in this lab. Here is the hash and query on those applications. The app comes baked with a template list but that customer can adjust this to their security posture. For example what are the processes are out there. Show me everything out there and start making your own whitelist. Customers will have their own list and create their own list from Splunk and its queries. This is beyond the scope of the current document.
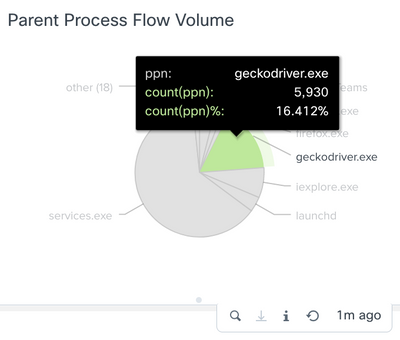
As I look at the graphs I see something in the parent process flow that catches my eye. It’s geckodriver.exe
From here you can dig in deeper. This is a legit app but as an example maybe you don’t want Firefox at all. This process is attached to Firefox.
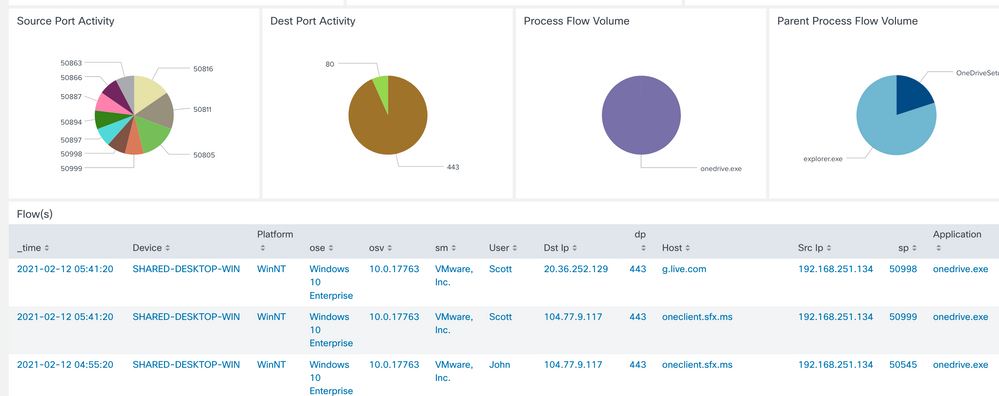
Or maybe you don’t want Onedrive running. So run a search on that and check out which machines are running Onedrive. Perhaps you use something company sanctioned like Code42 and that’s whitelisted and want to catch all machines with Onedrive running.
If you scroll down further you can see what devices, applications, processes, and ports are reaching out to the site. This can help you determine if you want to control these applications further. I see geckodriver.exe is talking to Doubleclick. This doesn’t seem right. Again this is just an example to showcase the different capabilities, when you get something with a more legit option.
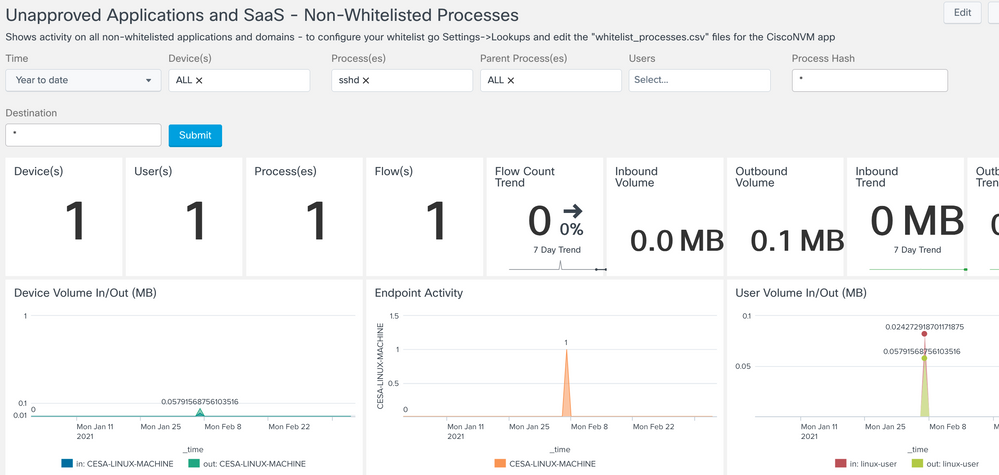
Next try a search for SSHD.exe, you’ll find this running on a Linux machine. Perhaps SSH is not allowed in your environment.
Services Running on Non-Standard Ports, Protocols
Provides a summary of ALL flows not defined int he lookup file standard_ports_process_protocols.csv
Security Evasion and Attribution
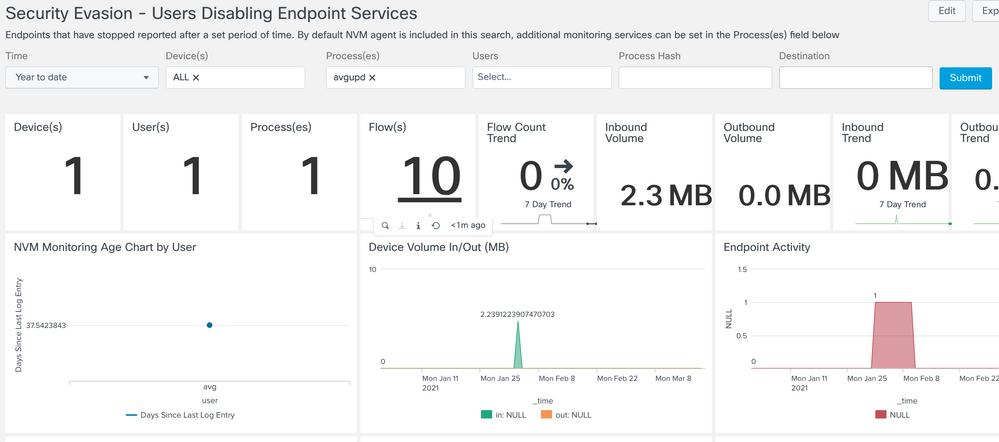
Detection of Disabled/Inactive Endpoint Security Applications
Provides a summary of ALL endpoint information that have not sent flows in the past 60 days.
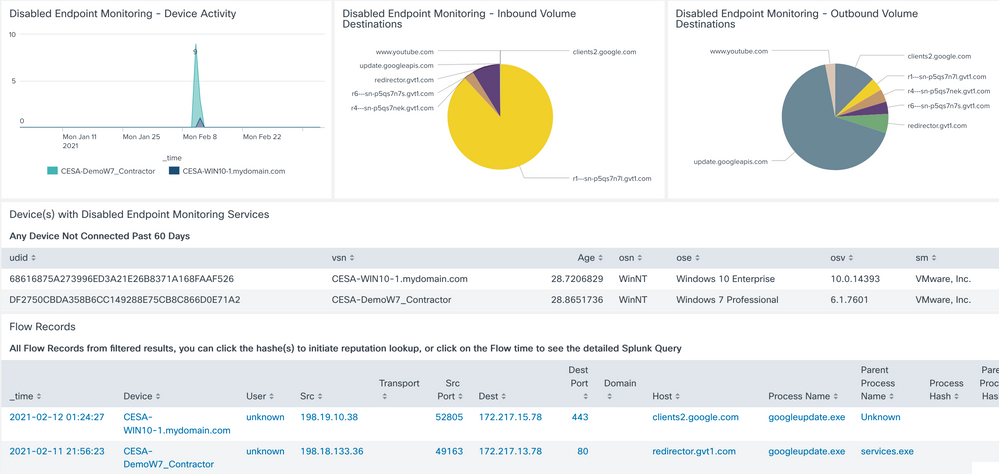
What endpoints haven’t sent endpoint security application network communications in awhile? That is an indicator that endpoint security is disabled on that endpoint.
We now have the googleupdate.exe and avgupd included in the data set. There is a single flow record each day it is active and runs from the 1st to the 8th on a Linux machine. This way you can show it stopped on the 9 and after that.
This software process has stopped communicating with the network. CESA shows that and also shows the activity before and after the disabling of this and the ability to investigate what might have happened that caused this.
You can also look into what’s not running vs what’s running.
For example you could even write an alert that says if you haven’t been running ampdaemon in 30 days then tell me. Many different important chatty processes should be running on systems, if you don’t see them then something is wrong.
In this example we are using Google application updater because we have that data available in our simulated data POV kit.
Select Detection of Disabled/Inactive Endpoint Security Applications
choose Process(es) - avgupd
Notice that there was some data from AVG update for a while but it stopped. That means it was either purposely disabled by the user to obscure some activity they are trying to hide or that it simply stopped functioning. In either case it is a security risk on the endpoint that needs to be dealt with.
Further down you can see useful information on which endpoints and how much data sent timeframes and list of endpoints. The following is for the googleupdate as the avg hasn't reached the 60 day mark at the time of the screenshot
Potential Rogue DNS Servers
Provides a summary of ALL potential rogue DNS servers
- Simple monitor default search on port 53 all traffic
- Splunk admin can write filters on their baseline of allowed DNS servers
VPN/Networking Split Tunneling Monitor
Provides a summary of all corporate network and non-VPN traffic
- To determine when AnyConnect VPN is active, select Network Type='VPN' and capture the time window(s) when a VPN is active for a specific user or all users
- To monitor split exclude traffic (including AnyConnect VPN Dynamic Split Tunneling), select a time window when VPN is active and set Trust='Untrusted'
- To monitor split include traffic (including AnyConnect VPN Dynamic Split Tunneling), set State='Trusted' and Network Type 'VPN'.
- To monitor split networking on premise, select State='Trusted' and match against 'ssid=your-corp-ssid'. Any ssid value that does not match during this time window while State='Trusted' is split-network traffic.
- To look for potential ssid spoofing, set State='Untrusted' and search for 'ssid=your-corp-ssid'
Use Case 1: Zero-Trust Monitoring
Question: How can I monitor the zero-trust traffic that is going off-net thru the split tunnel? How can I be sure sensitive traffic isn’t going over the split tunnel? How can I figure out if I have other traffic I can safely put over a split tunnel? What is putting a heavy traffic load on the tunnel?
One of the top use cases right now with the current health situation around the world is the ability to check what is happening with your remote access users. This is a crucial use case. Not only does it help you analyze what traffic should be sent through the tunnel or not depending on the security sensitivity of the traffic but it also helps you analyze which traffic is heavy and doesn’t need to be going through the tunnel. Example video, file sharing, conferencing and more! Some of these are Netflix, Box, WebEx.
It will help customers identify the traffic and better tune their networks to send heavy traffic outside of the tunnel if its deemed not sensitive in nature. This will save the bandwidth inside the company for better performance and possible cost savings. Also it can help customers identify how they should implement split traffic if they aren’t already.
Check for Untrusted app running on Untrusted interface
Another nice example would be to check if a specific app is running. In this example we will be looking at sshd.exe running on the Untrusted side as that’s not allowed. You can look at the bottom of the page and see what devices are being used. In this environment you can see a Linux machine.
Suspicious LDAP Activity - Provides a summary of all LDAP connection events
Data Loss Detection
High Volume Endpoint Monitoring
Provide a summary of all Device data, focused on data in/out add top resource hogs
Question: How can I find suspected data hoarding or exfiltration?
What is a High level of traffic to a certain domain exfiltrating data? For example Dropbox? Box? Google Drive? You can use this capability to find out. In the example below we will find a domain “bachparty” that has a large amount of data moving to it (and probably shouldn’t).
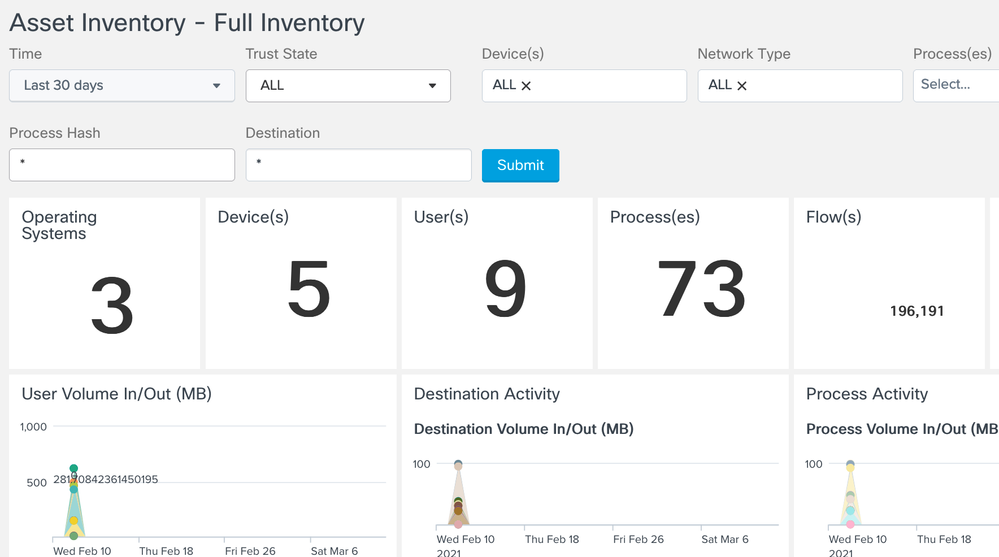
Asset Inventory
Full Inventory Scan
Provides a detailed summary of ALL network assets
Question: I want to get a summary view of OS’s, device types, traffic volume, etc. on the network
This is a great breakdown and general summary view of all the devices traffic volume and OS, processes, traffic volumes as an overall summary view. It has a great ability to associate the specific NIC, even USB-attached NICs, back to a certain machine and to a specific user for powerful correlation and analysis.
Click into the OS and then you can see that we have Windows, OSX and Linux machines as a sample. Might be new to you to know that Linux supports NVM (ISE gives you a lot of inventory with system scan posture compliance but not on Linux).
USE CASE FLOWS
Trace Path of Malicious Software
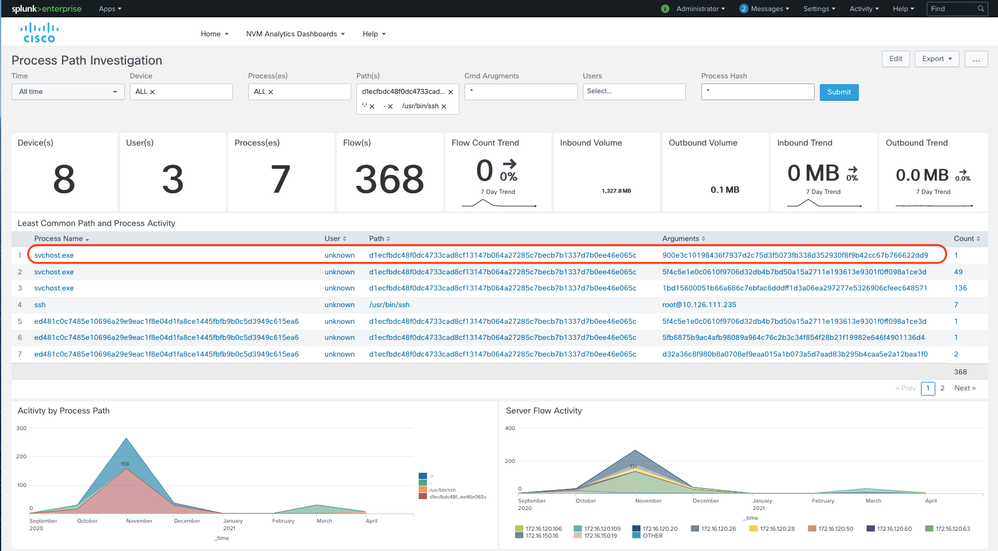
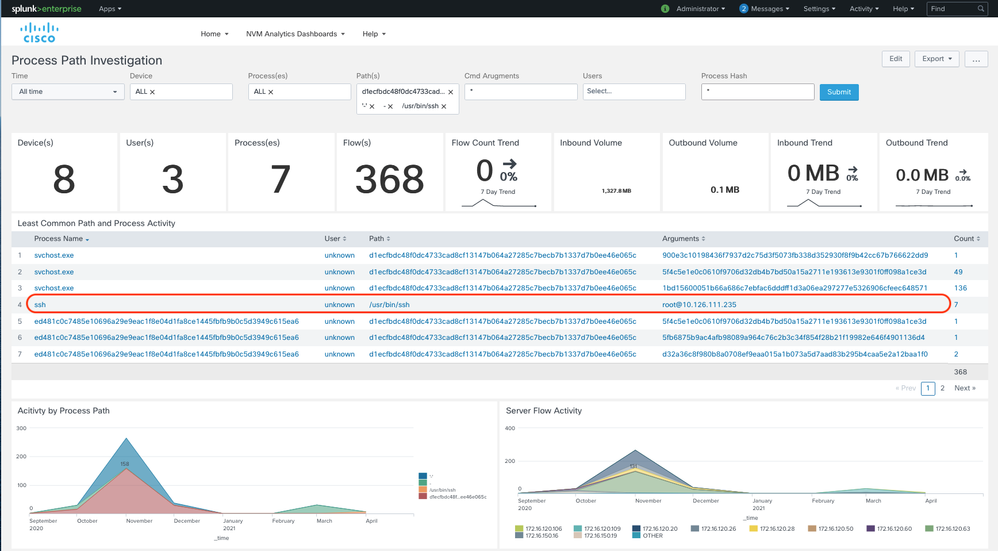
CESA can now alert you when an application is being executed from illegitimate or unexpected paths by tracing such suspicious/malicious activity all the way down to the process path of the known, unknown, or modified executable. This helps in the Zero-day analysis of attacks based on suspicious activity thus simplifying your investigations. With the new Process Path Investigation dashboard, you can now see the process path from where the process was executed. In the figure below you can see that that the process “svchost.exe” is being executed from a suspicions path “d1ecfbd***” which is suspicious/malicious
Find Ultra-Stealthy Threats
CESA can now also provide additional visibility into process command line arguments helping you detect attack methods such as obfuscation or other malicious evasion techniques. You can now detect unusual command line arguments to exploitable executables (eg., /bin/sh, powershell.exe, wmic etc), files given as arguments to other programs as well as a whole malicious script in the obfuscated form being sent as a command-line argument to run. With the new Process Path Investigation dashboard, you can see that an attacker who has compromised the root user is trying to ssh into 10.126.111.235
Day-Zero Malware & Threat Hunting
Question: What strange domains are being talked to and by what users and software processes?
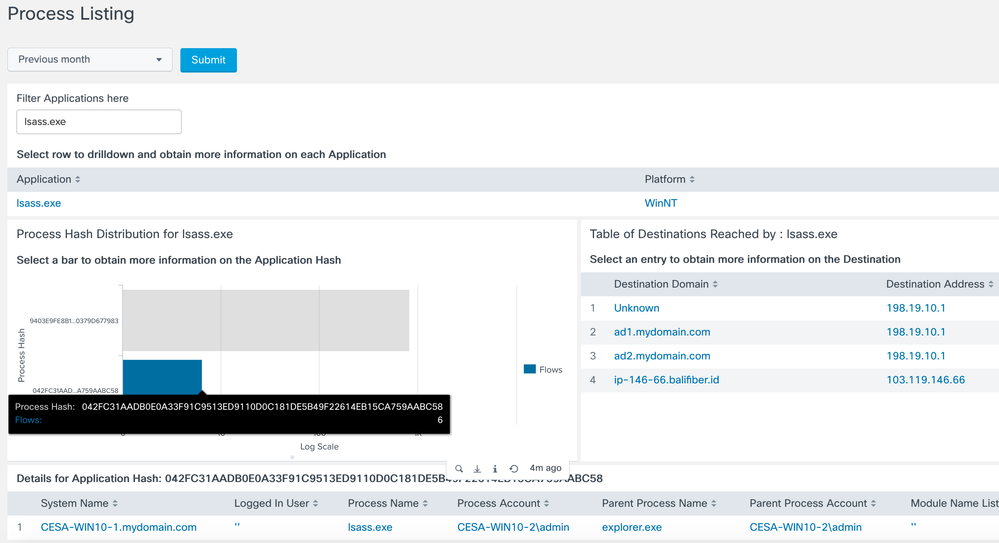
Lsass.exe in our example below is a Windows OS system controller responsible for many OS security activities. It’s a software process that you wouldn’t want questionable activity around. Here we see that lsass.exe is possibly talking to the wrong or unusual domain? For example it’s ok for the process to communicate with Microsoft and Office365 domains but if it’s found to be talking to another domain it maybe suspect that the exe was replaced with a bad version of it.
In the following flow we will investigate lsass.exe by checking if it’s talking to something it shouldn’t be.
- Select Main Dashboard > Users > Users Activity by Volume
- Search for lsass.exe under processes
Since we see that it’s going to a bad domain. We can investigate further by looking at the application process.
In the main dashboard > Go to Application process listing
Filter on lsass.exe
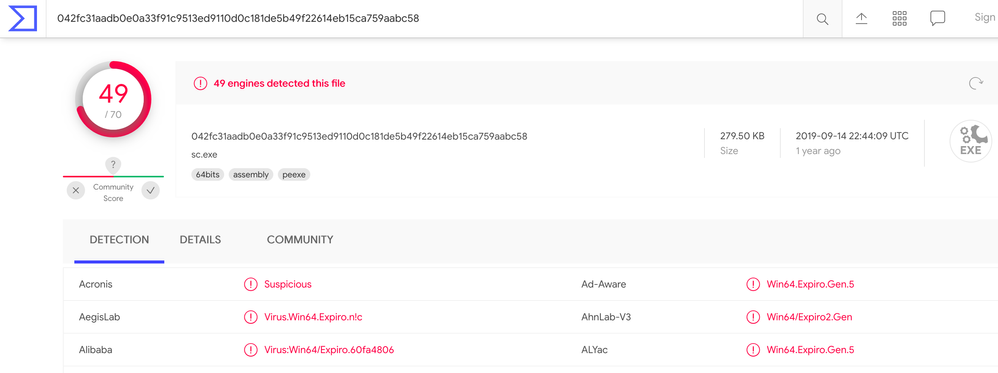
At the very bottom click on the details for the hash. This will allow you to cross launch into
Virus Total, Cisco Threat Response, etc.
Here I am going to click on VirusTotal. It doesn’t require an account but you can try CTR if you have an account.
Virus Total will give you a report showing it’s a bad process hash.
Click on the last hash and you’ll see which machine its running on
Now go back to User Activity Volume
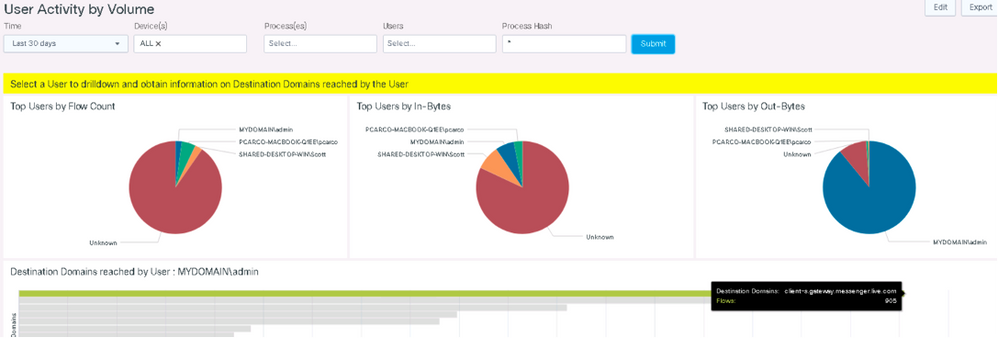
For another example let’s look at some of the default screen. Reset your test to check all processes and devices. Click into the mydomain/admin as it’s the top use out bytes which is interesting to look into.
After clicking that then you can hover over the top domain. It shows Messenger running. Why is that the top domain for that user? That’s a lot of communication or maybe the company doesn’t want the application used for communications. Either way CESA here gives visibility to the Messenger service in use and generating a lot of traffic for this specific user.
CESA Dashboard & TA updates for Splunk App Release Notes
v4.0.5 January 2022
Dashboard, TA & collector support for logged in users and flow direction - coming soon
v4.0.4 December 2021
- cloud compliance updated
- standardized port listings - IANA (10k) splunk friendly
v4.0.2 October 2021
- App renaming to CESA cleanup, title menu changes
- added missing screen links to the navigation pull down menu
- Updated cloud compliance tags in SimpleXML
- Fixed bug in Destination Addresses – not showing anything on page
- Third party links now open in new tabs – example: VirusTotal for hashes
v4.0.1 August 2021
- v4.0.0 had an issue and needed respin
- Updated dashboards to include process path and parameter visualizations
- Changed the default DNS values from "Unknown" to the Ip Address of the destination host
- Removed redundant documentation that can be found on the Cisco AnyConnect reference site
Frequently Asked Questions
Where does the DNS information come from?
Cisco Anyconnect NVM monitors DNS requests and maintains a mapping of IP->FQDNs. So it is expected to be very close to what the application used to resolve to that IP. This is a system-wide mapping, so there is a narrow chance, when different FQDNs resolve to the same IP on that machine, NVM might report the latter FQDN for both. But this is still way better than a reverse lookup and practically have been less hit.
How do I see the licensing usage in Splunk?
Find answers to your questions by entering keywords or phrases in the Search bar above. New here? Use these resources to familiarize yourself with the community:


