- Cisco Community
- Technology and Support
- Security
- Security Knowledge Base
- Cisco Secure Endpoint Free Trial Guide
- Subscribe to RSS Feed
- Mark as New
- Mark as Read
- Bookmark
- Subscribe
- Printer Friendly Page
- Report Inappropriate Content
- Subscribe to RSS Feed
- Mark as New
- Mark as Read
- Bookmark
- Subscribe
- Printer Friendly Page
- Report Inappropriate Content
02-15-2021 07:36 PM - edited 02-15-2021 07:38 PM
- About this Document
- Cloud Infrastructure Requirement
- STEP 1: Account Activation and Pre-work
- STEP 2: Configuration and Installation
- STEP 3: Start your Threat Hunting Experience
- What's Next
- Helpful Notes
About this Document
Cloud Infrastructure Requirement
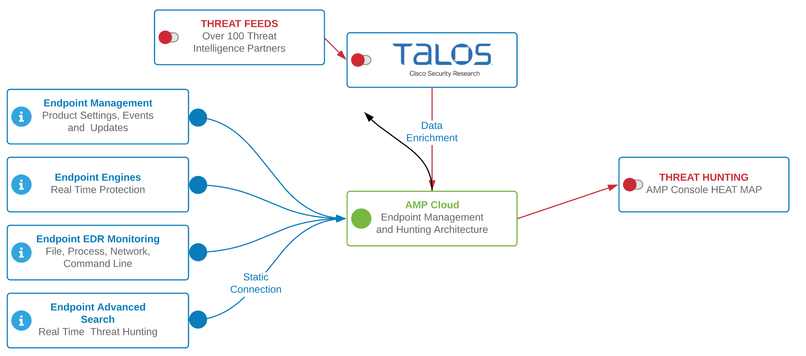
The Secure Endpoint Cloud Infrastructure provides alerting, eventing, data retention, and other necessary services for the Secure Endpoint connector. For full functionality the Endpoint Connector must be able to communicate with the Secure Endpoint cloud services. For more information please see the Helpful Notes section of this guide.
STEP 1: Account Activation and Pre-work
-
Activate your account and login to the Secure Endpoint portal.
-
To access sensitive data, configure Two-Factor-Authentication.
-
Prepare your Infrastructure: Prepare your network, so the Connector is able to communicate with the Cloud Services.
Activate your Secure Endpoint account
|
|
|
Account Activation: Click on the link included in the e-mail. This opens the Secure Endpoint console. Type your password and click activate. The account has full access to any areas of the console. Click the question mark on the top right corner to open a help page. |
Enable Two-Factor Authentication
|
Step 1: On the Top right corner in the Secure Endpoint UI click your Username and select My Account in the Drop Down Menu |
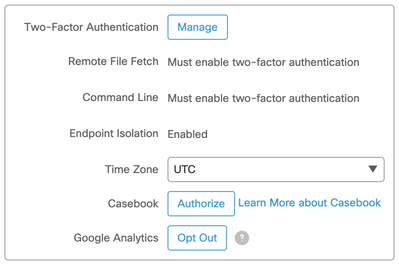
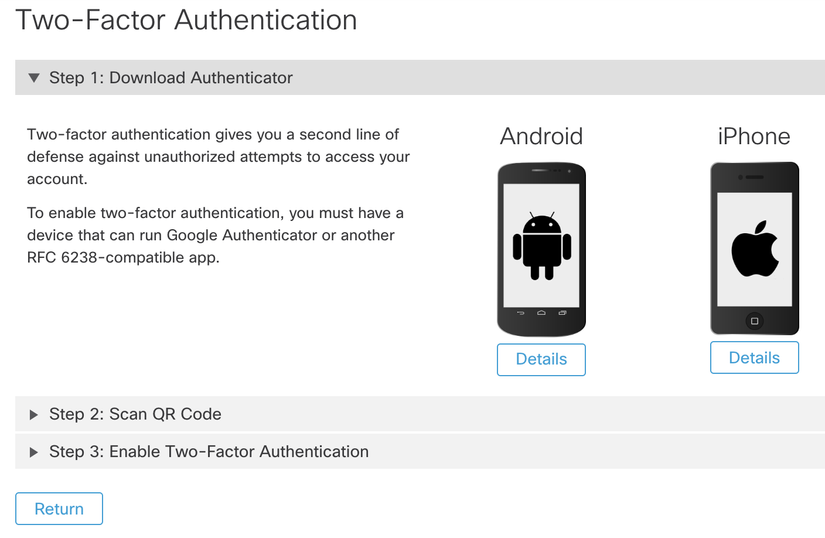
Step 2: Scroll down to the Settings Area of your account details. Click on the Manage Button to start the 2FA Activation Steps.
|
|
Step 3: Install a 2FA-Application on your Mobile Phone. Cisco recommends DUO, but you can also use any RFC 6238-compatible app - like Google Authenticator. |
STEP 2: Configuration and Installation
Prepare Groups, Policies and Exclusions
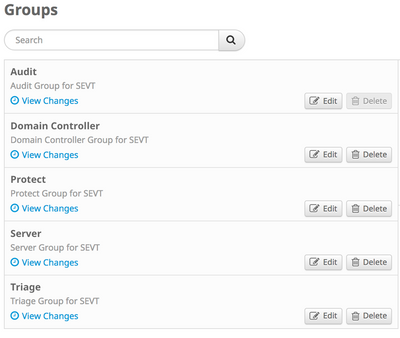
Secure Endpoint comes with predefined Groups, Exclusion Lists and Policies which can be directly used to deploy Secure Endpoint.
-
Cisco Maintained Exclusions are already assigned to the policies
-
Default Outbreak Control lists are assigned to the policies
-
Predefined Policies are already assigned to the groups
|
|
|
Audit: All Engines are default set to Audit Mode. Secure Endpoint Connector Scans and Monitors, but does not take any action. Server: This is a lightweight policy for high availability computers and servers that require maximum performance and uptime. System Protection is enabled, File activity is monitored, network protection is disabled. Domain Controller: All Engines are set to Audit Mode. In addition, Device Flow Correlation (Network) and System Process Protection Engine are disabled. Protect: All Engines are set to protect/quarantine except Malicious Activity Protection, which is disabled. Triage: All Engines are enabled and set to protect/quarantine. |
|
Secure Endpoint Support Documentation Maintained Exclusion List Changes |
Download and Install the Secure Endpoint Connector
|
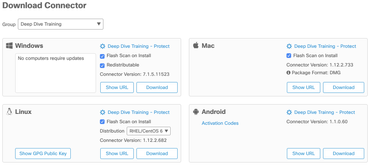
Step 1: To start the Download select |
|
|
Step 2: Select the Group where the connector should be added to. Choose the Install Package for the Operating System as needed. Step 3: Install the Connector by executing the downloaded File. Follow the the Instructions shown by the installer. NOTE: If installing on multiple computers in a group, click the Show URL button to use a direct download link that can be shared. |
 |
|
Step 4: Check the Status in the Client UI.It shows the Status and the assigned Policy. |
|
Generate Detection Data
|
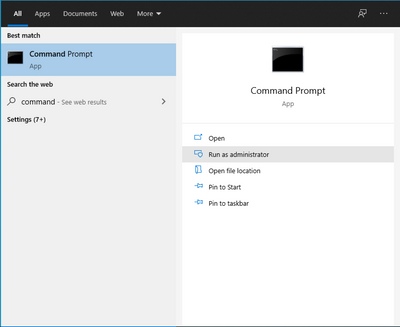
Running the following Powershell command after install, to test that data is being reported as expected, and events will be generated in the Secure Endpoint cloud console.
wmic /node:127.0.0.1 process call create "powershell -noP -sta -w 1 -enc bmV0IHVzZSBzOiBcXDEwLjAuMC4yOVxhZG1pbiQ=" You may safely close the command prompt window, and a successful detection using our Cloud IOC (Indicator of Compromise) engine will trigger an event in the cloud console in a matter of moments |
 |
|
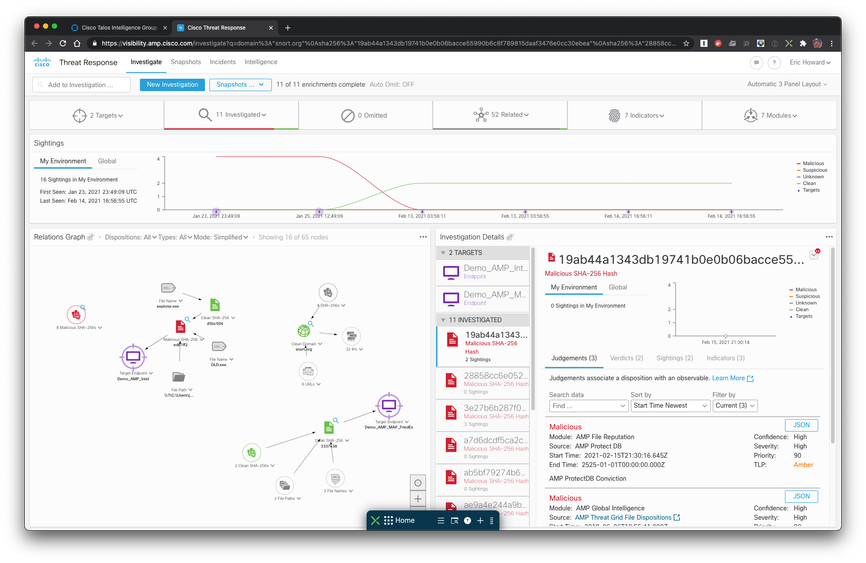
The Secure Endpoint is part of a built-in security platform called Cisco SecureX. The Secure Endpoint license includes Cisco SecureX dashboards, integrations, orchestration, threat response, useful pivot menus that help drive action in response to security events, and more. Take a look at the Threat Response website for more details. Step 1: Connect to the Threat Response UI using the right area. Europe:https://securex.eu.security.cisco.com/ Asia:https://securex.apjc.security.cisco.com/ Step 2: The first time you connect to Threat Response, you are asked to link the Secure Endpoint account with Threat Response. Step 3: Read info in the Threat Response First Investigation walk-through to gain insight into the threat investigation process and threat response capabilities. |
|
Learn with Investigation Scenarios
|
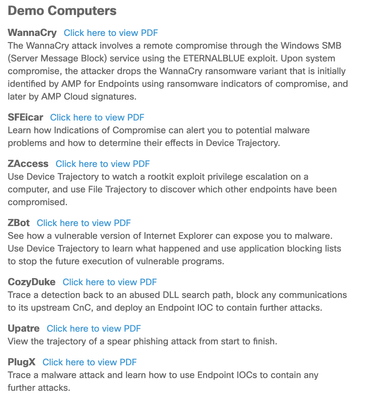
Secure Endpoint provides several predefined Investigation scenarios. They are well described and help you to learn how to use Secure Endpoint as a Threat Hunting Tool. Learn about the Heat Map, Events, Indications of Compromise - IOCs, File Trajectory and more. Step 1: Activate the Demo Data. Select Accounts → Demo data and click the Enable Demo Data button. Wait a few minutes until all demo data is enabled for you. This is important to ensure you are able to see more data in the Secure Endpoint console, if you are only installing the connector on a limited number of sytems. Step 2: Select your favorite Scenario. The PDF is designed to guide you through the investigation process, and understanding the data. |
 |
Use SecureX threat response to begin and manage investigations
|
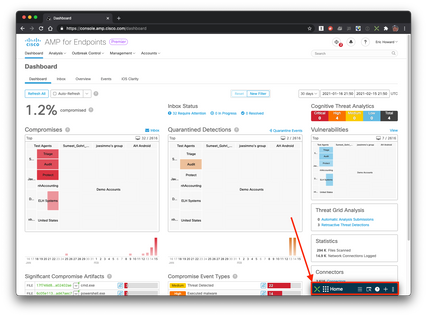
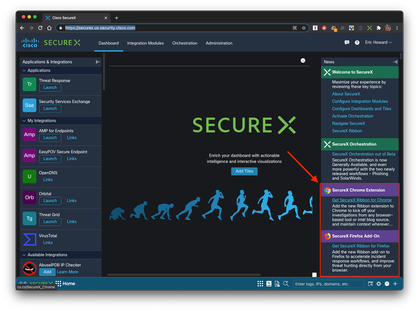
The Cisco SecureX Ribbon is a powerful tool to quickly inspect observables derived from web content directly from your Chrome or Firefox browser. Casebook Investigations are shared over Secure Endpoint Console, Cisco Malware Analytics (former Threat Grid), Cisco SecureX threat response or Cisco Secure Network Analytics (formerly Stealthwatch). Step 1: Read the Information in the SecureX Ribbon page. Step 2: Enable SecureX and connect Secure Endpoint to your SecureX instance as outlined here. Step 3: From the SecureX dashboard page, install the SecureX Ribbon Extension and configure the settings. While the in-console Ribbon shows up in Cisco Secure products, the Ribbon browser extension enables you to quickly pivot from observables to investigation mode while in any product, or viewing any website. Step 4: If not already done - enable the demo data as described above. Our use case (Olympic Destroyer) is part of the demo data set, so you can test our investigation functionality. This will search the page and load all Indicator of Compromise (IOC) related information [IP addresses, domains, file hashes, etc) from the page you are viewing and provides a disposition lookup via SecureX Cloud services. Click Investigate in Threat Response to start investigating presence, file transfers, traffic flow and other pertinent details. |
SecureX Ribbon - in the Secure Endpoint console
SecureX Ribbon browser extension install link |
Secure your environment with Automated Actions
| The Automated Actions Page lets you set actions that automatically trigger when compromise events at your specified severity level occur on a computer, in your selected computer groups. You can access the page from Outbreak Control → Automated Actions - here you can enable a policy to automatically retrieve Forensic Snapshots from compromised hosts, place systems under Isolation so that they can only be managed by your preferred systems, submit files for sandboxed analysis, and more. | 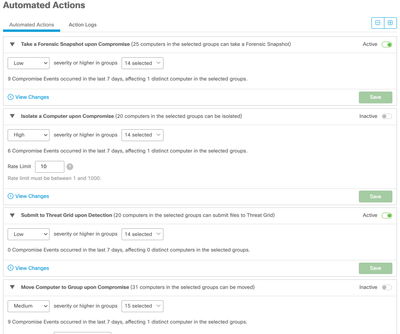 |
Use Indicators to understand a Threat
|
Secure Endpoint determines Cloud Indications of Compromise (IOCs) based on multiple events or sequences of events observed on an endpoint within a certain time period. The purpose of a Cloud IOC is to act as a notification of suspicious or malicious activity on an endpoint. A Cloud IOC trigger on a host needs to be investigated further to determine the exact nature and source of suspicious activity outlined in the IOC description. The Indicators page lets you search for Cloud IOCs. You can access the page from Analysis → Indicators on the main menu. Each indicator includes a brief description along with information about the tactics and techniques employed based on the MITRE ATT&CK knowledge base. Tactics represent the objective of an attack, such as executing malware or exfiltrating confidential information. Techniques are the methods attackers use to achieve the objectives or what they gain. For more information, see Getting Started with ATT&CK. You can search for specific indicators by name, or filter the list based on tactics, techniques, and severity. The number of compromises in your business that are associated with an indicator are also shown and you can filter the list to only display these.
|
 |
What's Next
Secure Endpoint Integrations
|
Secure Endpoint and Secure Access by Duo Secure Endpoint has native cloud-to-cloud integration with Duo to extend protection to users and trusted assets based on risk profile and posture. Secure Endpoint and Duo are key components to building your Zero-Trust architecture and benefit each other via native, out-of-the-box integration. Watch the video to learn more! |
|
Secure Endpoint and Umbrella SecureX pivots enable Umbrella users to quick question the assets they are tasked with securing, to ensure if additional actions beyond the network-based block might be needed. Secure Endpoint enables system snapshots, host isolation, and more containment and quarantine actions with just a click of the SecureX Pivot menu. |
- Security Technical Alliance Partners: https://www.cisco.com/c/m/en_us/products/security/technical-alliance-partners.html
Helpful Notes
Secure Endpoint Communication Addresses, Protocols, and Ports
| Purpose | Server | Port |
| Cloud Server |
cloud-ec-asn.amp.cisco.com cloud-ec-est.amp.cisco.com enrollment.amp.cisco.com |
TCP/443 Outbound |
| AMP Console | console.amp.cisco.com | TCP/443 Outbound |
| Management Server | mgmt.amp.cisco.com | TCP/443 Outbound |
| Event Server | intake.amp.cisco.com | TCP/443 Outbound |
| Policies | policy.amp.cisco.com | TCP/443 Outbound |
| Connector Downloads and Updates | upgrades.amp.cisco.com | TCP/80 OutboundTCP/443 Outbound |
| Error Reporting | crash.amp.cisco.com | TCP/443 Outbound |
| Endpoint IOCs | ioc.amp.cisco.com | TCP/443 Outbound |
| A/V Update Server | tetra-defs.amp.cisco.com | TCP/80 OutboundTCP/443 Outbound |
| Remote File Fetch |
rff.amp.cisco.com submit.amp.cisco.com |
TCP/443 Outbound |
| Behavior Protection | apde.amp.cisco.com | TCP/443 Outbound |
 |
|
Endpoint Connector
Secure Endpoint Cloud
|
Find answers to your questions by entering keywords or phrases in the Search bar above. New here? Use these resources to familiarize yourself with the community:


