- Cisco Community
- Technology and Support
- Security
- Security Knowledge Base
- ISE - Slow Replication
- Subscribe to RSS Feed
- Mark as New
- Mark as Read
- Bookmark
- Subscribe
- Printer Friendly Page
- Report Inappropriate Content
- Subscribe to RSS Feed
- Mark as New
- Mark as Read
- Bookmark
- Subscribe
- Printer Friendly Page
- Report Inappropriate Content
01-06-2023 07:56 PM - edited 03-20-2025 09:00 AM
- Introduction
- What is the Slow Replication ?
- How to check ?
- Slow Replication
- 1.ISE GUI
- 2.ISE CLI
- totalPendingMsgCound and totalTimeDiffInMinutes
- Effect of Slow Replication !!!
- Recommendations during a Slow Replication issue !!!
- Troubleshooting - Slow Replication ("external actors")
- CPU & RAM Reservation
- Hyper-Threading
- CPU Ready
- tech top command
- Live Logs
- 1. Misconfigured Network Devices
- 2. Repeat Counter
- Authentication Summary
- RADIUS Error
- Active Directory Diagnostic Tool
- Bug IDs
- List
- CSCwb29140 Threads Getting Exhaust
- CSCwd45843 Auth Step Latency
- CSCwf38076 Block Posture port TCP/8905 and CPP port TCP/8443 for Non-Postured connections
- Field Notice
- FN74005 - ISE: Java Heap Size May Significantly Impact System Performance
- Conclusion
The Portuguese version of this Article can be found at: ISE - Slow Replication (versão Português).
| For an offline or printed copy of this document, simply choose ⋮ Options > Printer Friendly Page. You may then Print > Print to PDF or Copy & Paste to any other document format you like. |
Introduction
This document focus on ISE Slow Replication caused by "external actors" (not ISE), it briefly introduces the meaning of Slow Replication, how to deal with it, its impact on ISE Deployment. and last but not least a list of Bug IDs. : )
If you see the Slow Replication event, I highly recommend checking it out.
What is the Slow Replication ?
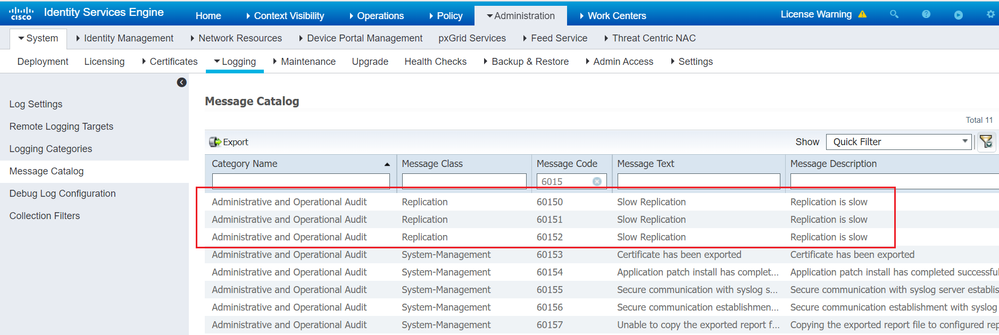
The Slow Replication message is part of the Category: Administrative and Operational Audit Category, Class: Replication and with the Message Codes: 60150, 60151 and 60152 (at Administration > System > Logging > Message Catalog) :
There are 3 Events that triggers the Slow Replication at a certain threshold level when messages for a specific Node has queued up beyond a safe level. They are triggered based on an ISE Node not consuming replicated messages for the past 15+ min:
- INFO at least 15K totalPendingMsgCount & at least 15 min totalTimeDiffInMinutes
- WARNING at least 20K totalPendingMsgCount & at least 15 min totalTimeDiffInMinutes
- ERROR at least 40K totalPendingMsgCount & at least 15 min totalTimeDiffInMinutes
The totalPendingMsgCount is the pending messages of the Secondary Node in relation to the Primary Node (the Primary PAN).
The totalTimeDiffInMinutes is the difference in minutes between the time of the 1st unconsumed Primary message and the Secondary time.
How to check ?
Slow Replication
You are able to check the Slow Replication via:
1. ISE GUI
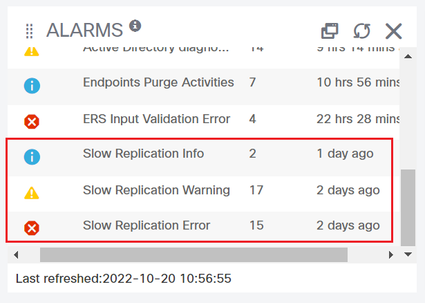
At ISE > Home you may see the Slow Replication record in the Alarms dashboard:
2. ISE CLI
Using the following command:
ise/admin# show logging application deployment.log
...
2022-10-18 10:24:39,148 INFO [Deployment-RegistrationPoller][] cpm.infrastructure.deployment.notifier.NodeChangeLogger -::::- Slow replication Warn level alarm will be generated for host <PSN HOSTNAME>
message : Node <PSN HOSTNAME> has slow replication since this node is not consuming messages for past 18 minutes. The number of pending messages are 32103
Status of this node is SYNC COMPLETED
Below are the overrall details of the nodes
a. Seq No in Primary : 799879069
b. Seq No in Secondary : 799846966
c. Current Time : 27768324
d. Primary Seq Time: 27768324
e. Secondary Seq Time: 27768319
f. Time of first unconsumed message in Primary: 27768306
2022-10-18 10:24:39,148 INFO [Deployment-RegistrationPoller][] cpm.infrastructure.deployment.notifier.NodeChangeLogger -::::- Inside logAuditMessages to raise slow replication alarm with level [WARN] for node [<PSN HOSTNAME>]
2022-10-18 10:24:39,150 INFO [Deployment-RegistrationPoller][] cpm.infrastructure.deployment.notifier.NodeChangeLogger -::::- Slow replication alarm is generated successfully for node <PSN HOSTNAME>
...
2022-10-18 10:24:39,181 INFO [Deployment-RegistrationPoller][] cpm.infrastructure.deployment.notifier.NodeChangeLogger -::::- Slow replication Critical level alarm will be generated for host <PSN HOSTNAME>
message : Node <PSN HOSTNAME> has slow replication since this node is not consuming messages for past 23 minutes. The number of pending messages are 44006
Status of this node is SYNC COMPLETED
Below are the overrall details of the nodes
a. Seq No in Primary : 799879070
b. Seq No in Secondary : 799835064
c. Current Time : 27768324
d. Primary Seq Time: 27768324
e. Secondary Seq Time: 27768322
f. Time of first unconsumed message in Primary: 27768301
2022-10-18 10:24:39,181 INFO [Deployment-RegistrationPoller][] cpm.infrastructure.deployment.notifier.NodeChangeLogger -::::- Inside logAuditMessages to raise slow replication alarm with level [CRITICAL] for node [<PSN HOSTNAME>]
2022-10-18 10:24:39,183 INFO [Deployment-RegistrationPoller][] cpm.infrastructure.deployment.notifier.NodeChangeLogger -::::- Slow replication alarm is generated successfully for node <PSN HOSTNAME>
...
IMPORTANT: at ISE GUI we have the Slow Replication: Info, Warning and Error ... at ISE CLI we have the Slow Replication: Info, Warn and Critical.
totalPendingMsgCound and totalTimeDiffInMinutes
You have the following options to check the totalPendingMsgCount and totalTimeDiffInMinutes:
1. you can easily check the totalPendingMsgCount at Administration > System > Deployment > check the Messages to be Synced:
2. you can check the totalTimeDiffInMinutes at ISE PPAN CLI (in the example below: the totalTimeDiffInMinutes = 26, the Time of first unconsumed message in Primary = 27712123 and the Secondary Seq Time = 27712149
ise/admin# show logging application deployment.log
...
2022-09-09 10:09:41,795 INFO [Deployment-RegistrationPoller][] cpm.infrastructure.deployment.notifier.NodeChangeLogger -::::- Slow replication Critical level alarm will be generated for host <PSN Hostname>
message : Node <PSN Hostname> has slow replication since this node is not consuming messages for past 26 minutes. The number of pending messages are 74872
Status of this node is SYNC COMPLETED
Below are the overrall details of the nodes
a. Seq No in Primary : 775241426
b. Seq No in Secondary : 775166554
c. Current Time : 27712149
d. Primary Seq Time: 27712149
e. Secondary Seq Time: 27712149
f. Time of first unconsumed message in Primary: 27712123
...
3. you are also able to check the totalPendingMsgCount & totalTimeDiffInMinutes via ISE PPAN CLI:
ise/admin# show logging application deployment.log
...
2022-12-20 10:40:30,284 INFO [Deployment-RegistrationPoller][] cpm.infrastructure.deployment.notifier.NodeChangeLogger -::::- Sequence details for host <PSN Hostname> replicationStatus[SYNC COMPLETED] primarySequenceCount[838148783] primaryTimeInMins[27859060] currentTimeInMins[27859060] firstUnconsumedPrimarySeqTime[ 27859031] secondarySequenceCount[838107650] secondaryTimeInMins[27859060] totalPendingMsgCount[41133] totalTimeDiffInMinutes [29]
...
Effect of Slow Replication !!!
Examples and possible effects of the Slow Replication:
- when unpublished message count goes beyond 2,000,000, then ALL Nodes will be marked Out of Sync, please take a look at: CSCvv10712 Sec_txnlog_master table should be truncated post 2M record count.
- If the replication backlog hits 1,000,000 Messages, the Node will be disconnected and require a manual resync, at ISE > Administration > System > Deployment > select the Node > click the Syncup button:
-
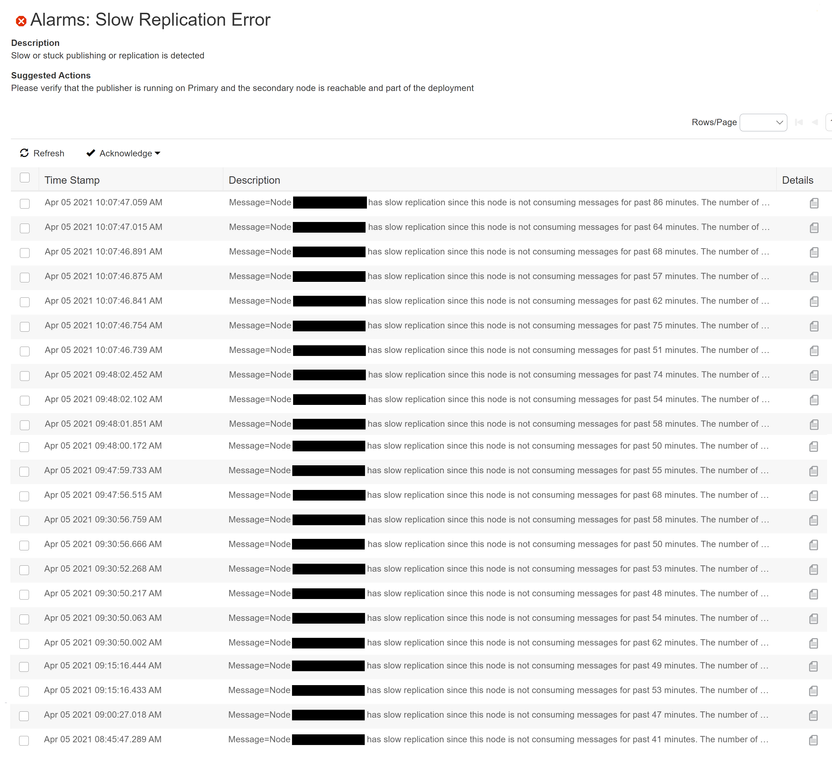
the Slow Replication Error event is very harmful for the ISE Deployment (especially when it is triggered repeatedly, as the Node may not consume Message for hours, in the example bellow: 86 min at 10:07AM
- unable to enter ISE GUI (in this scenery, you are only able to enter ISE via CLI)
- ISE GUI very slow !!!
- configuration changes take a long time to propagate to PSNs.
Recommendations during a Slow Replication issue !!!
During a Slow Replication issue avoid the generation of:
- Support Bundle
- Backup
- big Reports (for example: Last 7 days and Last 30 days)
Troubleshooting - Slow Replication ("external actors")
CPU & RAM Reservation
Reservation in VMWare VM is a MUST to mitigate Slow Replication, obviously your infrastructure needs to have enough capacity to support these reservations as these resources will be NO MORE SHARED (i.e. you MUST specify a Reservation if you need to guarantee that the minimum required amounts of CPU or Memory are always available for the VM).
At VMWare Host Summary double check the CPU Cores info (for example: 80 CPUs with 2.39GHz each) and the Processor Type:
At Performance and Scalability Guide for Cisco ISE double check:
1. at Cisco ISE Hardware Appliance, if your Processor Type is greater than the Processor Specification:
2. at Cisco ISE on Virtual Appliance, if your CPU & Memory is compatible with the vCPU & Memory Specification:
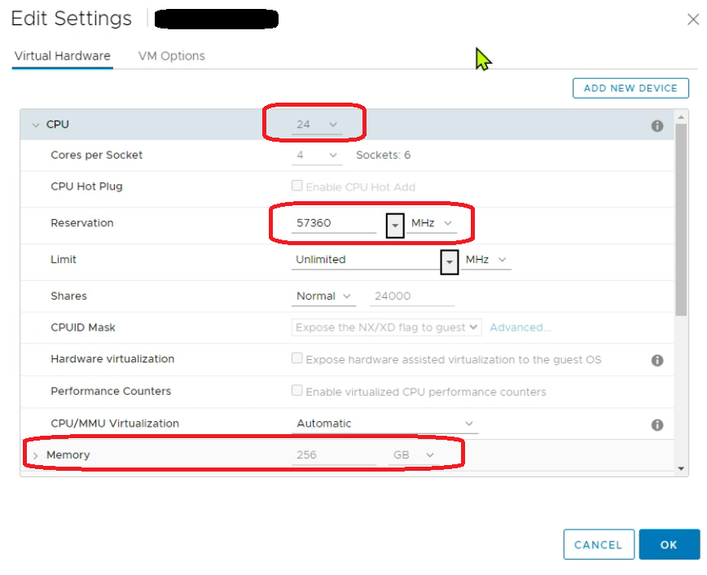
At VMWare VM Summary click the Edit Settings button:
and double check the Reservation info:
IMPORTANT 1: in this example we have 24x CPU, each with 2.39GHz clock, with a total of 57.36 GHz (24x 2.39 GHz).
IMPORTANT 2: when you Power On a VM, the system checks the amount of CPU and Memory Resources that have not yet been reserved. Based on the available unreserved resources, the system determines whether it can guarantee the reservation for which the VM is configured (if any). This process is called Admission Control.
IMPORTANT 3: VMWare DRS and VMWare HA "impact" the CPU & Memory Reservation, take a look at:
Note 1: you are able to double check your CPU & Memory and Processor Type info via ISE CLI:
ise/admin# show inventory
NAME: "ISE-VM-K9 chassis", DESCR: "ISE-VM-K9 chassis"
PID: ISE-VM-K9 , VID: V01 , SN: <Serial Number>
Total RAM Memory: 263972560 kB
CPU Core Count: 24
CPU 0: Model Info: Intel(R) Xeon(R) CPU E7- 4870 @ 2.40GHz
CPU 1: Model Info: Intel(R) Xeon(R) CPU E7- 4870 @ 2.40GHz
....
CPU 22: Model Info: Intel(R) Xeon(R) CPU E7- 4870 @ 2.40GHz
CPU 23: Model Info: Intel(R) Xeon(R) CPU E7- 4870 @ 2.40GHz
Hard Disk Count(*): 1
Disk 0: Device Name: /dev/sda
Disk 0: Capacity: 644.20 GB
NIC Count: 1
NIC 0: Device Name: eth0:
NIC 0: HW Address: <MAC Addr>
NIC 0: Driver Descr: VMware vmxnet3 virtual NIC driver

(*) Hard Disk Count may be Logical.
Note 2: for more details about the CPU info:
ise/admin# show tech-support
...
*****************************************
Displaying /proc/cpuinfo...
*****************************************
processor : 0
vendor_id : GenuineIntel
cpu family : 6
model : 47
model name : Intel(R) Xeon(R) CPU E7- 4870 @ 2.40GHz
stepping : 2
microcode : 0x3b
cpu MHz : 2394.000
cache size : 30720 KB
...
or
ise/admin# show cpu
processor : 0
model : Intel(R) Xeon(R) CPU E7- 4870 @ 2.40GHz
speed(MHz): 2394.000
cache size: 30720 KB
...
processor : 23
model : Intel(R) Xeon(R) CPU E7- 4870 @ 2.40GHz
speed(MHz): 2394.000
cache size: 30720 KB
Note 3: to check the Reservation via ISE CLI:
ise/admin# show tech-support
...
*****************************************
Displaying UDI (Unique Device Identifier) information...
*****************************************
UDI PID: ISE-VM-K9
UDI SN: <Serial Number>
UDI VID: V01
UDI Platform type: VM
VM Memory Reservation: 262144 MB
VM CPU Reservation: 57360 MHz
VM Memory Limit: 4294967295 MB
VM CPU Limit: 4294967295 MHz
VM Swap Utilization: 0 MB
VM Memory Balloon Size: 0 MB
VM Session ID: 0x6ddb3ead2740836a
VM CPU Speed: 2394 MHz
VM Host Time: 20 Dec 2022 12:20:33
...
Hyper-Threading
Hyper-Threading allows more than one Thread to run on each Core.
When Hyper-Threading is active, one Physical Core works like "two Logical Cores" that can work through tasks more efficiently by taking advantage of Idle Time when the Core would formerly be waiting for other tasks to complete.
IMPORTANT 1: Hyper-Threading improves CPU throughput by up to 30%.
IMPORTANT 2: if you are planning to use Hyper-Threading, remember the "up to 30% throughput" and avoid the CPU Ready issue !!!
IMPORTANT 3: more info at What is Hyper-Threading?.
CPU Ready
CPU Ready Time is a vSphere metric that records the amount of time a VM is ready to use CPU but was unable to schedule time because ALL CPU Resources (on a ESX Host) are busy.
As a rule of thumb, the CPU Ready Time:
- < 5%: generally no problem
- 5% - 10%: minimal contention that should be monitored during peak times
- > 10%: contention to be investigated & addressed where the end user experience is being impacted
Note 1: a VM's CPU Usage and CPU Ready metrics are NOT directly correlated. A VM can have a serious issue with CPU Ready when its CPU Usage doesn't appear to be that high. In order to have a full picture of your CPU Performance, you need to look at both CPU Ready and CPU Usage.
Note 2: please take a look at:
- Converting between CPU summation and CPU % ready values
- Troubleshooting ESX/ESXi virtual machine performance issues
- Troubleshooting a virtual machine that has stopped responding: VMM and Guest CPU usage comparison
tech top command
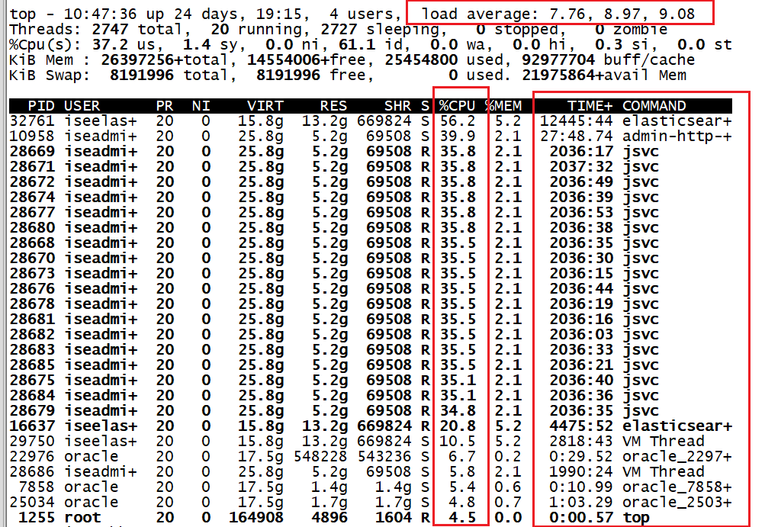
A high Load Average usually mean that the system is being used heavily and the response time is correspondingly slow !!!
Check the Load Average in the last 5 min and identity the Threads that's wasting more CPU resources is an important step, to do that, use the ISE PPAN CLI > tech top command, with the P (to sort by CPU Usage) and H (to list the Threads), for example:
IMPORTANT 1: you MUST use the tech top command during the Slow Replication issue !!! : )
IMPORTANT 2: this information MUST be shared with TAC !!!
Live Logs
ISE Live Logs (at Operations > RADIUS > Live Logs) has two important dashboards:
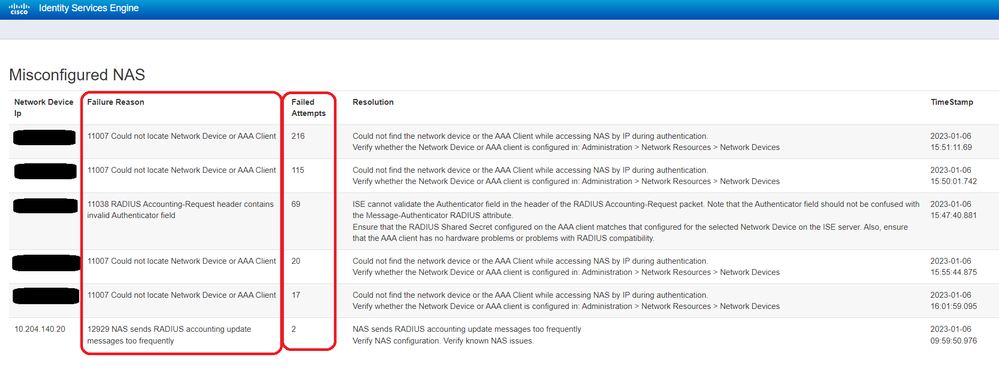
1. Misconfigured Network Devices
Click the Misconfigured NAS, check and solve the Failure Reason of the NAS with the most Failed Attempts:
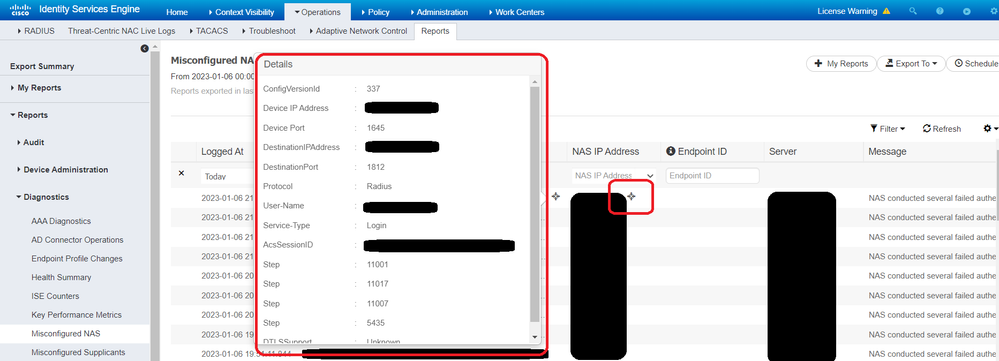
Note: at Operations > Reports > Reports > Diagnostics > Misconfigured NAS, you are able to check more details about the Misconfigured NAS that may help you solve the issue:
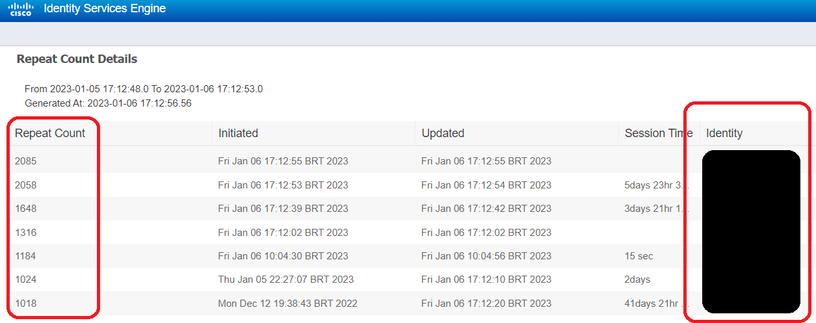
2. Repeat Counter
Click the Repeat Counter, check the Identity/Endpoint ID with the most Repeat Count:
Note 1: at Live Logs you are unable to use an Advanced Filter to filter by "Repeat Count greater than a Value", the following enhancement was created to deal with this situation:
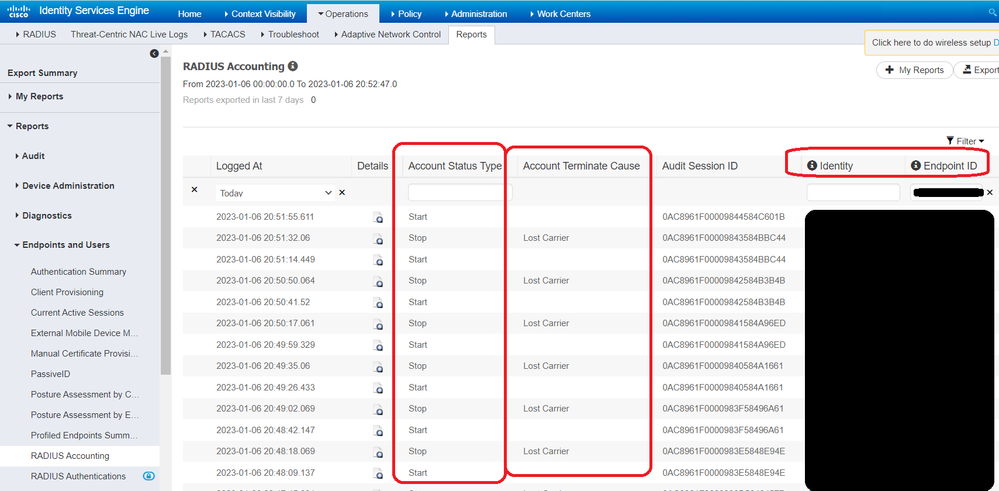
Then get the Identity/Endpoint ID and at Live Logs (at Operations > RADIUS > Live Logs > filter by Identity/Endpoint ID) to double check the info and at RADIUS Accounting (at Operations > Reports > Reports > Endpoint and Users > filter by Identity/Endpoint ID) check the Account Terminate Cause column, for example:
Note 2: at this point work with your R&S Team about the Account Terminate Cause is a MUST !!!
Note 3: values of Account Terminate Cause: (take a look at RFC 2866 - Acct-Terminate-Cause)
- User Request: user requested termination of service.
- Lost Carrier: DCD was dropped on the port.
- Lost Service: service can no longer be provided; for example, user's connection to a host was interrupted.
- Idle Timeout: idle timer expired.
- Session Timeout: maximum session length timer expired.
- Admin Reset: administrator reset the port or session.
- Admin Reboot: administrator is ending service on the NAS, for example prior to rebooting the NAS
- Port Error: NAS detected an error on the port which required ending the session.
- NAS Error: NAS detected some error (other than on the port) which required ending the session.
- NAS Request: NAS ended session for a non-error reason NOT defined for other values of Terminate-Cause.
- NAS Reboot: the NAS ended the session in order to reboot non-administratively ("crash").
- Port Unneeded: NAS ended session because resource usage fell below low-water mark (for example, if a bandwidth-on-demand algorithm decided that the port was no longer needed).
- Port Preempted: NAS ended session in order to allocate the port to a higher priority use.
- Port Suspended: NAS ended session to suspend a virtual session.
- Service Unavailable: NAS was unable to provide requested service.
- Call Back: NAS is terminating current session in order to perform callback for a new session.
- User Error: input from user is in error, causing termination of session.
- Host Request: Login Host terminated session normally.
Authentication Summary
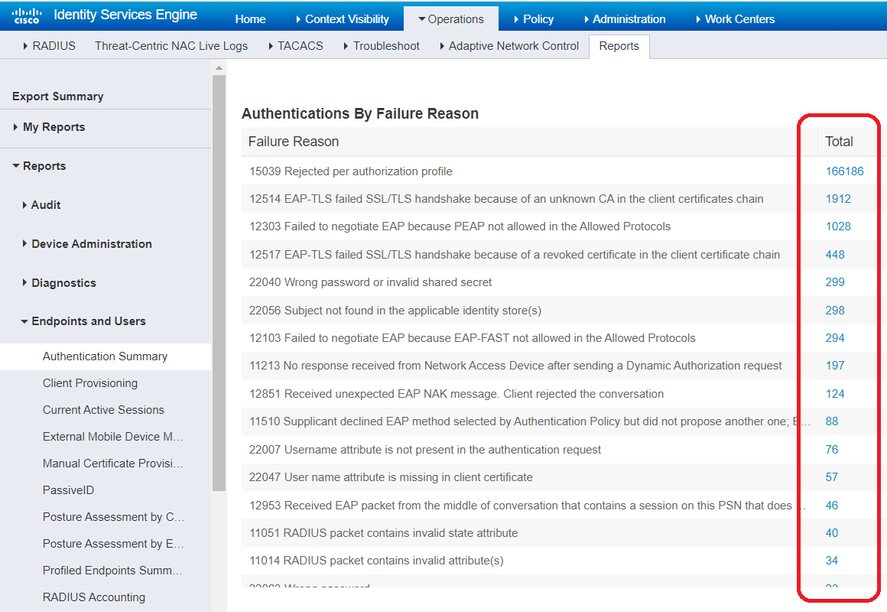
At Operations > Reports > Reports > Endpoints and Users > Authentication Summary > check the Authentication by Failure Reason (you can also check this at Operations > Reports > Reports > Endpoints and Users > Top N Authentication by Failure Reason), try to solve or minimize the top Failure Reason, for example:
RADIUS Error
At Operations > Reports > Reports > Diagnostics > RADIUS Error > filter by Failure Reason = 5440 (Endpoint abandoned EAP Session and started new) and Export To = Repository (CSV) to check the Endpoints with the most 5440 Failure Reason counts:
Note: at this point work with your R&S Team and the Team responsible for the Supplicant is a MUST !!!
IMPORTANT 1: if you filter by Failure Reason = 5440 at Operations > Reports > Reports > Endpoint and Users > RADIUS Authentication or Operations > Reports > Reports > Endpoint and Users > Authentication Summary you will receive a No Data Found, that is why you have to check this on RADIUS Error.
IMPORTANT 2: the following enhancement was created to deal with this situation:
Active Directory Diagnostic Tool
Your Slow Replication issue could be caused by Application Server "flapping" (from running to initializing state), double check your Active Directory Diagnostic Tool - Schedule Tests configuration (at Administration > Identity Management > External Identity Sources > Active Directory > Advanced Tools > Diagnostic Tools > check the Run Schedule Tests
please take a look at the following Bug IDs:
- CSCvy98352 ISE 3.0 patch 2 PAN crashes when AD Diagnostic Tool runs everyday in a large deployment
- CSCvx58736 3.1:Maxscale: Core generated by /opt/CSCOcpm/prrt/diag/bin/diagRunner start
- CSCvw81130 ISE 2.7 - Unable to disable Active Directory Diagnostic Tool scheduled tests
Bug IDs
List
Attention to the following Bug IDs:
- CSCvs53148 Multiple EP's profiled every second causing ISE nodes to go out of sync
- CSCwa59237 Deployment-RegistrationPoller causing performance issues on PAN node with 200+ internal certificates
- CSCvx58839 3.1:Maxscale:45 node Deployment went out of sync with 1.5M Endpoints
- CSCvx30276 ISE 2.7 : On Re-creating Root CA, Jedis DB connection pool is not re-created
- CSCvx97970 Jedis connections exhausted in deployment causing issues for replication/performance
- CSCvu70683 Alarm Suppression required for ERS queries along with suppression on iselocalstore.log
- CSCwc23593 LSD is causing high CPU
- CSCwa90930 Need hard Q cap on RMQ
- CSCwc93451 Profiler should ignore non-positive RADIUS syslog messages for forwarding from default RADIUS probe
- CSCwc15013 Add serviceability & fix "Could not get a resource since the pool is exhausted" Error on ISE 3.0
- CSCwc91923 Uploading the AnyConnect Agent from UI, Triggered a High CPU on the PAN and took ~7 hours to complete
- CSCwc74531 ISE hourly cron should cleanup the cached buffers instead of the 95% memory usage
- CSCwd41773 Application server crashes if CRL is downloaded frequently having size 5 MB or more.
- CSCwh08440: Live Log Events 5422 and 5434 Do Not Show Any Data in the Authentication and Authorization Columns.
- CSCwk95341 RADIUS Accounting "OFF" and "ON" Messages Cause Increased Processing Latency.
- CSCwm43211 ISE Reporting Wrong Latency for RequestLatency and TotalAuthenLatency RADIUS Accounting.
- CSCwj39533 High CPU caused by RMQforwarder.
- CSCwm33110 Heap Space is Fully Utilized by RMQ Consumer.
IMPORTANT: it's always a best practice to double check if your environment is up to date or if you are not using a Deferred Release, please check ISE Software Download.
CSCwb29140 Threads Getting Exhaust
This is one I'd like to explain in more detail, as it's the one that gave me "the most headache". : )
Take a look at: CSCwb29140 Threads getting exhaust post moving to latest patches were nss rpm is updated (Only 3.0p5&2.7p7,3.1P1).
Symptom: " ... you start having performance issues on HTTPS Portals like: Guest Portal, Posture Portal. Example of this are: Portal takes more time than usual to load. Another symptom is Application Server going to initializing state ... "
Known Fixed Releases: " ... 2.6 P11, 2.7 P8, 3.0 P6, 3.1 P3, 3.2 ... "
Before the Fixed Release you are able to check the issue at Operations > Reports > Reports > Audit > Operations Audit, take a look at Request = Maximum Resource Limit Reached.
IMPORTANT: the HP-2.7P7-CSCwb29140 Hot Patch solves the initializing state issue, but not the Maximum Resource Limit Reached issue.
CSCwd45843 Auth Step Latency
This is another one I'd like to explain in more detail, as it's one of the highest number of Support Cases.
Take a look at: CSCwd45843 Auth Step latency for policy evaluation due to Garbage Collection activity.
Symptom: " ... include, but are no limited to the following:
- Authentication Step Latency on multiple Policy evaluation steps.
- High Average Request Latency during times of peak load.
- Authentication Request Latency does not recover until after the System is reloaded.
- Profiler Queue Full Alarms ... "
Known Fixed Releases: " ... 2.7 P8, 3.0 P7, 3.1 P5, 3.2 P1 ... "
The ONLY workaround without patching or upgrading the System is to reduce the traffic volume being sent to individual Nodes or spread the traffic across additional ISE Nodes. A reboot of the System may temporarily alleviate the issue but it may come back within minutes after reloading.
CSCwf38076 Block Posture port TCP/8905 and CPP port TCP/8443 for Non-Postured connections
Take a look at: CSCwf38076 Block Posture port TCP/8905 and CPP port (default is TCP/8443) for Non-Postured connections .
Symptom: " ...
- "Maximum resource limit reached" reports for "Portal service thread pool reached threshold value" events. Navigate to Operations > Reports > Reports > Audit > Operations Audit to see the reports.Known Affected Releases: " ... 2.7, 3.0, 3.1 and 3.2 ... "
The ONLY workaround " ... block traffic from the Endpoints to all ISE PSNs for TCP/8905 and Client Provisioning Portal port (default is TCP/8443). This action is recommended for Posture with redirection and redirectionless. ...".
Field Notice
FN74005 - ISE: Java Heap Size May Significantly Impact System Performance
This is a very important FN, please take a look at:
This issue starts with ISE 2.7 P2 and reloading the system may temporarily alleviate the issue ... upgrading ISE is recommended !!!
Conclusion
Solve or minimize the Slow Replication issue is definitely far from easy : )
Work with TAC is highly recommended and gathering all of this troubleshooting information during the Slow Replication issue is a MUST !!!
I hope this document helps you "get through the dark times" of Slow Replication !!! : )
- Mark as Read
- Mark as New
- Bookmark
- Permalink
- Report Inappropriate Content
Hello Marcelo, another amazing document my friend.
Thank you for your effort and time to take all this information with evidences also listing the issues related to this problem in a very well explained way.
I hope this document helps many VMware teams to verify their points and feel the sensibility of this subject.
Regards,
Gustavo Garcia
- Mark as Read
- Mark as New
- Bookmark
- Permalink
- Report Inappropriate Content
Hi @ggomezga ,
thanks for the comment !!!
I hope it makes life easier for those who are facing or will face this type of issue.
Best regards
- Mark as Read
- Mark as New
- Bookmark
- Permalink
- Report Inappropriate Content
Excelente documento, bem detalhado
- Mark as Read
- Mark as New
- Bookmark
- Permalink
- Report Inappropriate Content
muito obrigado !!!
- Mark as Read
- Mark as New
- Bookmark
- Permalink
- Report Inappropriate Content
Excelente documento !!!
- Mark as Read
- Mark as New
- Bookmark
- Permalink
- Report Inappropriate Content
muito obrigado. Espero que ajude !!!
- Mark as Read
- Mark as New
- Bookmark
- Permalink
- Report Inappropriate Content
Perfect Marcelo Morais, it will certainly help in other cases. Congratulations!
- Mark as Read
- Mark as New
- Bookmark
- Permalink
- Report Inappropriate Content
Excellent support base for future cases! Congratulations Marcelo!
- Mark as Read
- Mark as New
- Bookmark
- Permalink
- Report Inappropriate Content
Hi @Henrique Gonzaga ,
thanks a lot for the feedback !!!!
- Mark as Read
- Mark as New
- Bookmark
- Permalink
- Report Inappropriate Content
Hi @Marcel Prado ,
thanks !!! Hope this helps others with the same issue.
- Mark as Read
- Mark as New
- Bookmark
- Permalink
- Report Inappropriate Content
Impeccable document, @Marcelo Morais! Thanks for sharing with us the knowledge you have, all with a lot of experience. Congratulations!
- Mark as Read
- Mark as New
- Bookmark
- Permalink
- Report Inappropriate Content
@orqjr2 , thanks !!! Always a pleasure !!!
- Mark as Read
- Mark as New
- Bookmark
- Permalink
- Report Inappropriate Content
Excellent guide, It would be interesting to have the case where you do not have that many Physical cores/Memory/Disk. I guess you are not using hyperthreading because it is not needed for your case.
For example, CISCO documentation indicates that with a CPU = 24 (12 cores/24 threads - hyperthreading enabled, Cisco indicates 24000 MHZ reservation for a 3655 VM).
So for a server with 20 cores/2.6GHz each and Hyperthreading enabled, you can get the 24 vCPU's for the 3655 VM but the reservation would be limited to 24000 (as per cisco doc) or I guess as much as 12 cores x 2.6 = 31200 MHZ.
- Mark as Read
- Mark as New
- Bookmark
- Permalink
- Report Inappropriate Content
Hi @ajc ,
thanks and excellent point !!!
1st. Hyperthreading uses up to 30% of your Physical Core (pCPU), in your example: with 20 pCPU you can "simulate" up to an extra 6 CPU, in other words, 24 vCPU is a possible number when you have 20 pCPU with Hyperthreading.
2nd. Reservation is best used when you relate it to the pCPU, in your example: 20 pCPU x 2.6 GHz = 5.2 GHz.
Note 1: at Performance and Scalability Guide for Cisco Identity Services Engine the SNS 3655 has 12 pCPU with 2.1 GHz each, in other words, 12 pCPU x 2.1 GHz = 25.2 GHz, if you use 2.0 GHz (not the exact number) then you have 12 pCPU x 2.0 GHz = 24 GHz.
Note 2: in my Case with a huge Slow Replication Error, I have to use only pCPU to minimize the CPU Ready issue.
If you have anything else you'd like to add to this Guide, I'd appreciate it !!!
- Mark as Read
- Mark as New
- Bookmark
- Permalink
- Report Inappropriate Content
Hi Marcelo, thanks for replying, What would be the value you recommend for the Virtual Hardware -- > CPU and Virtual Hardware -- > Cores x Socket if you are having a significant slow replication issue (keep in mind there is no option to get a better server) AND hyperthreading is disabled (assume a 3655 or 3595 VM) with the same server of 20 pCPU's?. Thanks again for your insight on this since that you have expert knowledge on this topic.
Find answers to your questions by entering keywords or phrases in the Search bar above. New here? Use these resources to familiarize yourself with the community:

