- Cisco Community
- Technology and Support
- Service Providers
- Service Providers Knowledge Base
- ASR9000/XR Understanding and troubleshooting Fabric issues in the A9K
- Subscribe to RSS Feed
- Mark as New
- Mark as Read
- Bookmark
- Subscribe
- Printer Friendly Page
- Report Inappropriate Content
- Subscribe to RSS Feed
- Mark as New
- Mark as Read
- Bookmark
- Subscribe
- Printer Friendly Page
- Report Inappropriate Content
on 03-10-2014 11:09 AM
Introduction
As you know troubleshooting the ASR9000 and XR is close to my heart. In this document we are going to expand on the fabric troubleshooting and operation.
Previous articles have expanded on the NP counters and NP troubleshooting. In this document we'll focus on the fabric specific.
Note this is just the first version of the document. I realize that some commands need to be explained better or what the output really means, but hopefully this gives a good impression to get started on the fabric.
Before we start
For this purpose it is important to know which type of linecard we have, a Trident or Typhoon.
the following cards are Trident based:
40G linecards: A9K-40GE, A9K-2T20G, A9K-4T, A9K-8T/4
80G linecards: A9K-8T, A9K-16T/8
Typhoon cards:
A9K-24x10, A9K-36x10, A9K-MOD80/160, A9K-2x100
This document does not pertain directly to the SIP700 linecard. Although the sip700 interfaces with its own FIA to the RSP fabrics like any other linecard would. Most of the commands for fabric verification can be used due to the fact that the SIP700 has the same FIA as the Trident linecard, but in this reference we are not specifically zooming in on the SIP700.
High level forwarding overview
The following picture gives an overview as to how packets are going from ingress to egress interface/linecard with the different forwarding asics in place.
The article https://supportforums.cisco.com/docs/DOC-15552 deepdived into the NP and its operation and verification.
In this article we're going to get a closer look at the FIA (Fabric interface Asic) and the Fabric itself.
One key thing to notice is here that:
- Trident does not have a fabric stage on the linecard whereas typhoon does.
- Typhoon does not have bridge asics.
For forwarding this doesn't really matter in terms of troubleshooting difference.
the reason why Trident has a bridge is because of the memory interfae on the NPU is XAUI whereas the FIA speaks DDR2, the bridge converts in between. It is a non blocking asic, but it can assist with backpressure when it receives it from the fabric.
The reason why Typhoon has a linecard fabric stage is to reduce the number of fabric links. As you can see, all FIA's connect with the fabric chips. High density linecards such as the 24x10 have 4 FIA's and the 36x10 has 6 of them. If all of these FIA's would directly connect to the RSP fabric chips, we'd run out of fabric links in the higher slot chassis such as the 9010.
The linecard fabric stage reduces the number of fabric links.
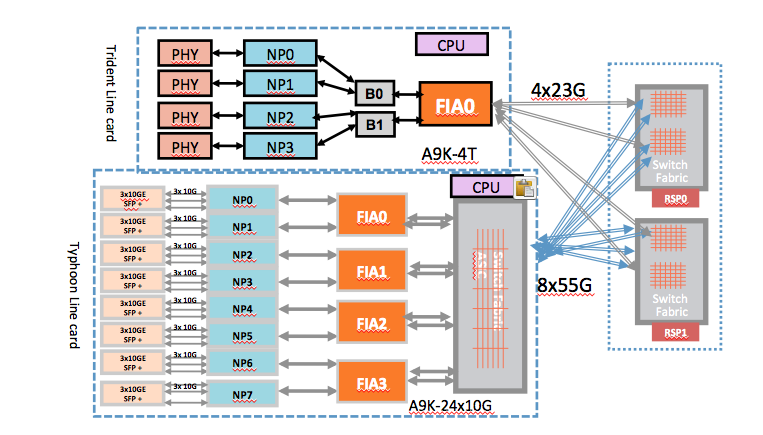
the 9922 and the 9911 have separate fabric cards. What is drawn here in the picture is the RSP440 (serving 55G per link for typhoon).
Using the 9922/11 with separate fabric cards is not a story changer either, we just have pulled the fab chips off the RSP and called them FC (fabric cards) and RP's (route processors). this gives a higher redundancy due to the ability to serve more fabric cards and higher fabric capacity per slot.
Troubleshooting fabric issues
Steps to debug packet drops
Please follow the below steps for fabric related issues:
Step 1) Look for active PFM alarms on LC as well as RSPs.
CLI: show pfm location all
Step 2) Check if your hardware FPGA versions are up-to-date
(see also Fabric hardware sanity section)
CLI: show controllers np summary all
CLI: admin show hw-module fpd all location all
Step 3) Follow the steps mentioned in packet drop debugging sections
(see Debugging Traffic Issues section).
Step 4) Exclude all "known" related fabric issues
%PLATFORM-PFM_NP-0-TMA_CLUSTER_PARITY
signifies a hardware error
%PLATFORM-DIAGS-3-PUNT_FABRIC_DATA_PATH_FAILED
signifies that diag packets from the RP have not been returned properly by the NP hardware. This can either be a software problem or a hardware problem. Check this article and reference for the latest detail to verify and troubleshoot this issue:
- https://supportforums.cisco.com/docs/DOC-32083
- http://www.cisco.com/c/en/us/support/docs/routers/asr-9000-series-aggregation-services-routers/116727-troubleshoot-punt-00.html
%PLATFORM-BRIDGE-3-NPU_0_SCH_MEMP_ERR_0
was seen on older bridge versions on Trident linecard, make sure the revision of the bridge FPGA is > 0.41 for 40G Trident linecards
and > 0.5 on the 80G Trident linecards
Visualization of the show commands and what they are checking
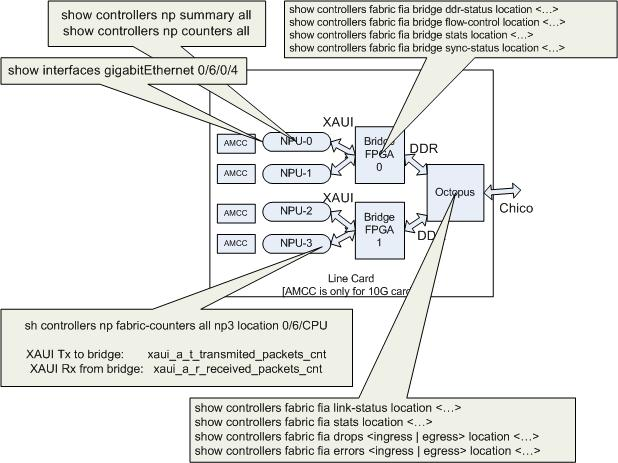
Legend:
- Octopus is the Trident Fabric Interface Asic
- NPU is Network Processing Unit, the Trident processor
- Chico is the name of the link between FIA and Fabric (on the RSP), using SERDES.
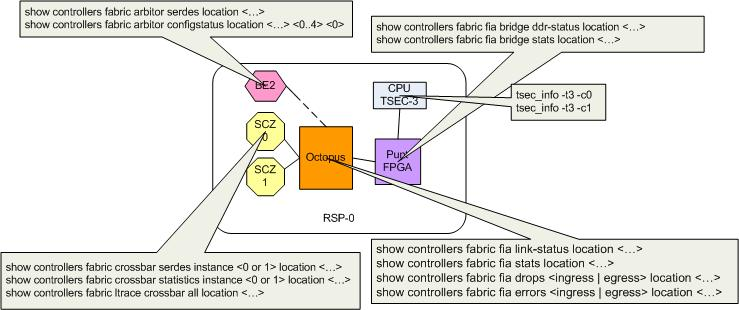
Legend:
- SCZ is Santa Cruz, the actual Fabric chip (there are 2 on the RSP4 and RSP440).
- Octopus is Fabric Interface ASIC. The RSP has one too for the punt path (remember that the RP/CPU is just another linecard to the fabric.
- BE is Bellagio, that is the Fabric Arbiter.
Data path packet drop debugging
The path a data packet travels is:
Incoming interface on LC--> NPU mapped to incoming interface on LC --> Bridge3 on LC --> FIA on LC --> Crossbar switch on RSP --> FIA on LC ---> Bridge3 on LC ---> NPU mapped to outgoing interface ---> Outgoing Interface
Clear all the counters:
Before beginning to debug traffic issues, please clear all counters and start afresh.
1) Clear Interface counters
RP/0/RSP0/CPU0:ROSH06_jetfire#clear counters all
Thu Jan 1 04:17:32.676 UTC
Clear "show interface" counters on all interfaces [confirm]
RP/0/RSP0/CPU0:ROSH06_jetfire#
2) Clear NP counters
RP/0/RSP0/CPU0:ROSH06_jetfire#clear controller np counters all
3) Clear Fabric counters
To clear FIA counters on LC and RSP:
RP/0/RSP0/CPU0:ROSH06_jetfire#clear controller fabric fia location
To clear all fabric crossbar counters:
RP/0/RSP0/CPU0:ROSH06_jetfire#clear controller fabric crossbar-counters location
To clear bridge counters on LC
Check all the relevant traffic counters
After clearing counters, start traffic pattern that caused the drop.
1) Check the counters at input interface
RP/0/RSP0/CPU0:ROSH06_jetfire#show interfaces tenGigE 0/1/0/0
Thu Jan  1 01:10:01.908 UTC
TenGigE0/1/0/0 is up, line protocol is up
  Interface state transitions: 1
  Hardware is TenGigE, address is 001e.bdfd.1736 (bia 001e.bdfd.1736)
  Layer 2 Transport Mode
  MTU 1514 bytes, BW 10000000 Kbit
     reliability 255/255, txload 0/255, rxload 0/255
  Encapsulation ARPA,
  Full-duplex, 10000Mb/s, LR, link type is force-up
  output flow control is off, input flow control is off
  loopback not set,
  Maintenance is enabled,
  ARP type ARPA, ARP timeout 04:00:00
  Last clearing of "show interface" counters never
  5 minute input rate 0 bits/sec, 0 packets/sec
  5 minute output rate 0 bits/sec, 0 packets/sec
     0 packets input, 0 bytes, 0 total input drops
     0 drops for unrecognized upper-level protocol
     Received 0 broadcast packets, 0 multicast packets
              0 runts, 0 giants, 0 throttles, 0 parity
     0 input errors, 0 CRC, 0 frame, 0 overrun, 0 ignored, 0 abort
     0 packets output, 0 bytes, 0 total output drops
     Output 0 broadcast packets, 0 multicast packets
     0 output errors, 0 underruns, 0 applique, 0 resets
     0 output buffer failures, 0 output buffers swapped out
     1 carrier transitions
2) Check NPU counters
RP/0/RSP0/CPU0:ROSH06_jetfire#show controllers NP counters all location
Fields of interest in NPU counters from data path standpoint:
800 PARSE_ENET_RECEIVE_CNT      -- Num of packets received from external interface
970 MODIFY_FABRIC_TRANSMIT_CNT  -- Num of packets sent to fabric
801 PARSE_FABRIC_RECEIVE_CNT    -- Num of packets received from fabric
971 MODIFY_ENET_TRANSMIT_CNT    -- Num of packets sent to external interface
Run the following command to figure out NPU to interface mapping:
RP/0/RSP0/CPU0:ROSH06_jetfire#show controllers np ports all
Thu Jan  1 02:18:48.264 UTC                Node: 0/0/CPU0:
----------------------------------------------------------------

NP Bridge Fia                       Ports
-- ------ --- ---------------------------------------------------

0  1      0   GigabitEthernet0/0/0/30 - GigabitEthernet0/0/0/39
1  1      0   GigabitEthernet0/0/0/20 - GigabitEthernet0/0/0/29
2  0      0   GigabitEthernet0/0/0/10 - GigabitEthernet0/0/0/19
3  0      0   GigabitEthernet0/0/0/0 - GigabitEthernet0/0/0/9
3) Check NPU - Bridge3 counters
RP/0/RSP0/CPU0:ROSH06_jetfire#show controllers np fabric-counters ?
  all  all counters
  rx   receive counters
  tx   transmit counters

RP/0/RSP0/CPU0:ROSH06_jetfire#show controllers np fabric-counters all ?
  all  All NP instances
  np0  NP0 instance
  np1  NP1 instance
  np2  NP2 instance
  np3  NP3 instance
  np4  NP4 instance
  np5  NP5 instance
  np6  NP6 instance
  np7  NP7 instance

RP/0/RSP0/CPU0:ROSH06_jetfire#show controllers np fabric-counters all np0 location <>
Using above CLI you can check the NPU-bridge rx/tx counters for each NPU on a given LC. The fields of interest here are:
xaui_a_t_transmited_packets_cnt -- Num pkt sent by NPU to bridge
xaui_a_r_received_packets_cnt   -- Num pkt sent by bridge to NPU
4) Check Bridge counters
RP/0/RSP0/CPU0:ROSH06_jetfire#show controllers fabric fia bridge stats location <>
Thu Jan 1 02:23:34.163 UTC
UC - Unicast , MC - Multicast
LP - LowPriority , HP - HighPriority
--------------------------------------------------------------------------------
                                 FIA  0
                                 ******
Cast/   Packet            Packet              Error            Threshold
Prio    Direction         Count               Drops            Drops
--------------------------------------------------------------------------------
Unicast Egress Stats
********************
UC HP   Fabric to NP-0    0                   0                0
UC LP   Fabric to NP-0    0                   0                0
UC HP   Fabric to NP-1    0                   0                0
UC LP   Fabric to NP-1    0                   0                0
UC HP   Fabric to NP-2    0                   0                0
UC LP   Fabric to NP-2    0                   0                0
UC HP   Fabric to NP-3    0                   0                0
UC LP   Fabric to NP-3    0                   0                0
----------------------------------------------------------------
UC      Total Egress      0                   0                0
Multicast Egress Stats
*********************
MC HP   Fabric to NP-0    0                   0                0
MC LP   Fabric to NP-0    0                   0                0
MC HP   Fabric to NP-1    0                   0                0
MC LP   Fabric to NP-1    0                   0                0
MC HP   Fabric to NP-2    0                   0                0
MC LP   Fabric to NP-2    0                   0                0
MC HP   Fabric to NP-3    0                   0                0
MC LP   Fabric to NP-3    0                   0                0
---------------------------------------------------------------
MC      Total Egress      0                   0                0
Cast/   Packet            Packet
Prio    Direction         Count
--------------------------------------------------
Unicast Ingress Stats
*********************
UC HP   NP-0 to Fabric    255
UC LP   NP-0 to Fabric    0
UC HP   NP-1 to Fabric    255
UC LP   NP-1 to Fabric    0
UC HP   NP-2 to Fabric    255
UC LP   NP-2 to Fabric    0
UC HP   NP-3 to Fabric    255
UC LP   NP-3 to Fabric    0
-------------------------------------------------
UC      Total Ingress     1020
Multicast Ingress Stats
***********************
MC HP   NP-0 to Fabric    0
MC LP   NP-0 to Fabric    0
MC HP   NP-1 to Fabric    0
MC LP   NP-1 to Fabric    0
MC HP   NP-2 to Fabric    0
MC LP   NP-2 to Fabric    0
MC HP   NP-3 to Fabric    0
MC LP   NP-3 to Fabric    0
--------------------------------------------------
MC      Total Ingress     0
Ingress Drop Stats (MC & UC combined)
**************************************
PriorityPacket            Error            Threshold
        Direction         Drops            Drops
--------------------------------------------------
LP      NP-0 to Fabric    0                   0
HP      NP-0 to Fabric    0                   0
LP      NP-1 to Fabric    0                   0
HP      NP-1 to Fabric    0                   0
LP      NP-2 to Fabric    0                   0
HP      NP-2 to Fabric    0                   0
LP      NP-3 to Fabric    0                   0
HP      NP-3 to Fabric    0                   0
--------------------------------------------------
      Total IngressDrops  0                   0
5) Check FIA counters
RP/0/RSP0/CPU0:ROSH06_jetfire#show controllers fabric fia stats location
Thu Jan  1 01:51:37.097 UTC

FIA:0 DDR Packet counters:
=========================
From Bridge#[0]  510
To Bridge  #[0]  510
From Bridge#[1]  510
To Bridge  #[1]  510

FIA:0 SuperFrame counters:
=========================
To Unicast Xbar[0]     19
To Unicast Xbar[1]     20
To Unicast Xbar[2]     0
To Unicast Xbar[3]     0
To MultiCast Xbar[0]   0
To MultiCast Xbar[1]   0
To MultiCast Xbar[2]   0
To MultiCast Xbar[3]   0

From Unicast Xbar[0]   19
From Unicast Xbar[1]   20
From Unicast Xbar[2]   0
From Unicast Xbar[3]   0
From MultiCast Xbar[0] 0
From MultiCast Xbar[1] 0
From MultiCast Xbar[2] 0
From MultiCast Xbar[3] 0

FIA:0 Total Drop counters:
=========================
Ingress drop: 0
Egress drop: 0
Total drop: 0

RP/0/RSP0/CPU0:ROSH06_jetfire#show controllers fabric fia q-depth location 0/0$
Thu Jan  1 02:16:37.227 UTC

FIA  0
------
Total Pkt queue depth count = 0
6) Check Crossbar counters
RP/0/RSP0/CPU0:ROSH06_jetfire#show controllers fabric crossbar statistics instance 0 location
Thu Jan  1 01:54:07.721 UTC

  Location: 0/RSP0/CPU0 (physical slot 4)
  Asic Instance: 0
  Fabric info for node 0/RSP0/CPU0 (physical slot: 4)

  Dropped packets             :            mcast            unicast
  +---------------------------------------------------------------+
  Input buf bp pkts           :                0                  0
  Output buf bp pkts          :                0                  0
  Xbar timeout buf bp pkts    :                0                  0
  HOL drop pkts               :                0                  0
  Null POE drop pkts          :                0                  0
Puntpath packet drop debugging
RSP puntpath
The punt path is: Incoming Interface --> NPU --> LC CPU --> NPU --> Bridge3 --> LC FIA --> RSP Crossbar
--> Punt FPGA on RSP --> RSP CPU Local interface Ping path is: RSP CPU --> RSP FIA --> RSP Crossbar --> LC FIA --> LC CPU --> NP0 ---> LC FIA ---> Crossbar ---> RSP FIA ---> RSP CPU
To debug packet drop issues on any of the above paths:
1) Clear all packet counters as described earlier.
2) Start traffic.
3) Check traffic counters at each component
a) Check NPU counters for NPU mapping to interface and NPU0 for inject packet count. In case of NPU counters the following fields are of interest:801 PARSE_FABRIC_RECEIVE_CNT 820 PARSE_LC_INJECT_TO_FAB_CNT 872 RESOLVE_INGRESS_L2_PUNT_CNT 970 MODIFY_FABRIC_TRANSMIT_CNT 822 PARSE_FAB_INJECT_IPV4_CNTb) Check Fabric related counters.RP/0/RSP0/CPU0:UUT#show controllers fabric crossbar statistics instance 0 location 0/RSP0/CPU0 RP/0/RSP0/CPU0:UUT#show controllers fabric fia stats location 0/7/CPU0 RP/0/RSP0/CPU0:ROSH06_jetfire#show controllers fabric fia bridge stats location <>
c) Check Punt FPGA counters
d) Check Tsec counters
run tsec_info -t3 -c0

If pkts are lost inside fabric and not accounted in the fabric CLIs listed in the above diagram then check the output of following cmds
- sh contr fabric fia link-status location <lc>
- sh contr fabric fia trace location <lc>
- attach to lc#
- fiashell -c nzerrorcnt -l 1000 -i <skt intance #>
- fiashell -c intr -i <skt intance #>
Legend:
- SKT is Skytrain, the Fabric Interface ASIC for typhoon linecards
- XBAR is the Crossbar Fabric ASIC. Remember that Typhoon linecards have a fabric on the LC too.
Troubleshooting Back-pressure Issues
Although this is generally more QOS related, it is useful to understand backpressure and the verification of that within this fabric troubleshooting guide.
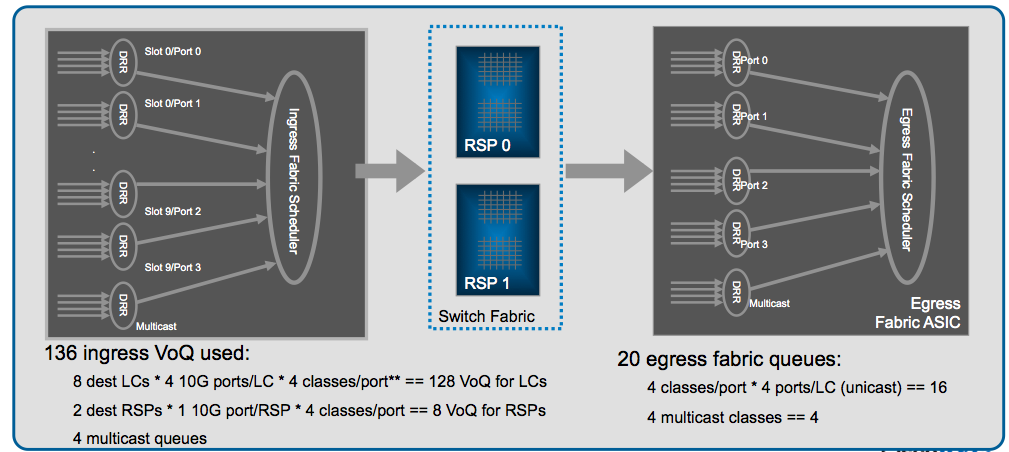
Every FIA has a set of VOQ's, this is a set of queues that represent a 10G entity in the system.
Every 10G entity (that means that 10x1G are represented with a single VOQ has different priority classes. Generally we see the default queue flowed off during backpressure scenario.
Only when the NPU is getting overloaded that is serving more BPS/BW or PPS then the circuits can handle, it will start to exert backpressure to the ingress Linecards. This is represented by a VOQ flow off on the FIA on that ingress linecard:
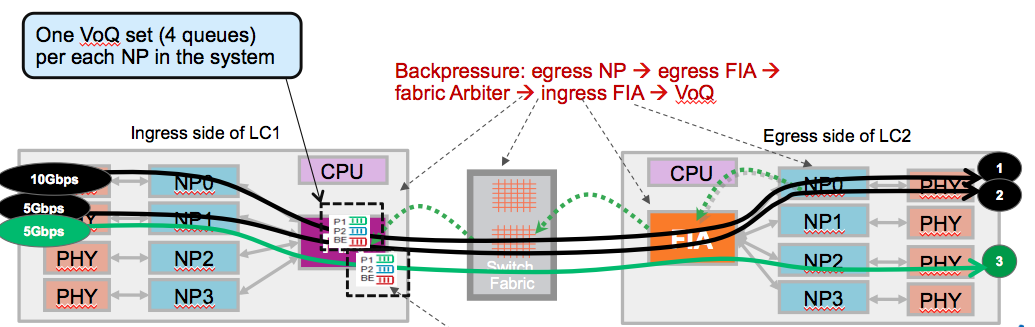
Zooming into the Fabric Interface Asic (FIA):
Identify the VOQ for an interface
RP/0/RSP1/CPU0:ios#show controllers pm interface tenGigE 0/5/0/0 loc 0/5/CPU0
Ifname(1): TenGigE0_5_0_0, ifh: 0xe000100 :
switch_fabric_port 0x17
VQI 23 is for interface ten0/5/0/0
NOTE: the SFP/Switch Fabric port is reported in HEX and represented in decimal (lovely  ) in the show fabric commands.
Check if you are seeing FIA drops
RP/0/RSP1/CPU0:ios#show drops location 0/0/CPU0
=== snip ===
FIA 0 Drops:
----------------------------------------------------------------
Ingress Drops 287078960
Egress Drops 1
Total Drops 287078961
Ingress Generic Hard Drop-2 287078960
Egress Mcast RxFab Hdr-1 1
----------------------------------------------------------------
RP/0/RSP1/CPU0:ios#show controller fabric fia q-depth location 0/0/CPU0
FIA 0
VoQ | ddr | pri | pkt_cnt
------+-----+-----+---------
23 | 0 | 2 | 118
Total Pkt queue depth count = 118 Packets in the queue. Not good.
Useful commands to check for any hardware errors
1) Check for asic-errors for fia
Commands to check for asic errors for various fabric components.
show asic-errors arbiter 0 all location 0/RSP0/CPU0
show asic-errors crossbar 0 all location 0/RSP0/CPU0
show asic-errors fia 0 all location 0/1/CPU0
2) Check for pfm alarms
show pfm location <>
3) Checking link status
RP/0/RSP0/CPU0:ROSH06_jetfire#show controllers fabric fia bridge ddr-status loc <>
Thu Jan 1 02:23:07.757 UTC
FIA 0
------
FIA DDR# Status
-------- ------
0 SYNCED
1 SYNCED
RP/0/RSP0/CPU0:ROSH06_jetfire#show controllers fabric fia bridge sync-status loc <>
Thu Jan 1 02:23:09.314 UTC
FIA 0
------
Bridge# NP# Status
------- --- ------
0 0 SYNCED
0 1 SYNCED
1 2 SYNCED
1 3 SYNCED


RP/0/RSP0/CPU0:ios#show controllers fabric fia link-status location 0/0/CPU0
Wed Jan 21 18:01:09.812 UTC

Fia 0 to Arbiter sync status
ARB   0              SYNCED
ARB   1              SYNCED

Fia 0 to Crossbar sync status
Fabric Link 0              SYNCED
Fabric Link 1              SYNCED
Fabric Link 2              SYNCED
Fabric Link 3              SYNCED


Fia 1 to Arbiter sync status
ARB   0              SYNCED
ARB   1              SYNCED

Fia 1 to Crossbar sync status
Fabric Link 0              SYNCED
Fabric Link 1              SYNCED
Fabric Link 2              SYNCED
Fabric Link 3              SYNCED


4) Check NP status and counters

NP issues can cause packet drops in and outside fabric. NP(s) could be locked up or

display error counters which may provide clues of the problem. Following is an example

of NP lockup symptom: NP0, NP1 and NP2 all shows no non-zero counters, a good indication

that they are locked up.

RP/0/RSP0/CPU0:cork#show controller np counters all loc 0/4/CPU0
Sat Jan  3 18:25:44.795 EST

               Node: 0/4/CPU0:
----------------------------------------------------------------

Show global stats counters for NP0, revision v3

 No non-zero data counters found


Show global stats counters for NP1, revision v3

 No non-zero data counters found


Show global stats counters for NP2, revision v3

 No non-zero data counters found


Show global stats counters for NP3, revision v3

Read 15 non-zero NP counters:
Offset Counter                                        FrameValue   Rate (pps)
-------------------------------------------------------------------------------
  23 PARSE_FABRIC_RECEIVE_CNT                                586           0
  29 MODIFY_FABRIC_TRANSMIT_CNT                                2           0
  34  RESOLVE_EGRESS_DROP_CNT                                 578           0
  70 RESOLVE_INGRESS_L2_PUNT_CNT                              10           0
  74 RESOLVE_LEARN_FROM_NOTIFY_CNT                           544          0
  80 RESOLVE_VPLS_MAC_MOVE_CNT                                 2           0
 286 RESOLVE_MAC_NOTIFY_CTRL_DROP_CNT                        544           0
 287 RESOLVE_MAC_DELETE_CTRL_DROP_CNT                         34           0
 420 PARSE_FAB_MACN_RECEIVE_CNT                              546           0
 422 PARSE_FAB_MAC_DELETE_RECEIVE_CNT                         18           0
 423 PARSE_FAB_DEST_MAC_DELETE_RECEIVE_CNT                    16           0
 720 DIAGS                                                     4           0
 832  PUNT_STATISTICS                                         184           1
 834 PUNT_DIAGS_RSP_ACT                                        3           0
 836 PUNT_DIAGS_RSP_STBY                                       3           0


5) Check NP fabric counters

This can be used to verify if packets are really transmitted out of NPs or if there are

any errors between NP and FIA.

Example:

<span style="font-family: Courier New; color: #7a4707;">RP/0/RSP0/CPU0#sh controllers np fabric-counters all np0 loc 0/2/cpu0</span>

<span style="font-family: Courier New; color: #7a4707;">                Node: 0/2/CPU0:
----------------------------------------------------------------
Egress fabric-to-bridge interface 0 counters for NP 0
 INTERLAKEN_TX_PACKETS                         0x00000000 00000000
 INTERLAKEN_TX_BYTES                           0x00000000 00000000
 INTERLAKEN_TX_BAD_PACKETS                     0x00000000 00000000
 -------------------------------------------------------------
Egress fabric-to-bridge interface 1 counters for NP 0
 INTERLAKEN_TX_PACKETS                         0x00000000 02ce40bd
 INTERLAKEN_TX_BYTES                           0x00000000 c20dff82
 INTERLAKEN_TX_BAD_PACKETS                     0x00000000 00000000
 -------------------------------------------------------------</span>

<span style="font-family: Courier New; color: #7a4707;">                Node: 0/2/CPU0:
----------------------------------------------------------------
Ingress fabric-to-bridge interface 0 counters for NP 0
 INTERLAKEN_RX_PACKETS                         0x00000000 00000000
 INTERLAKEN_RX_BYTES                           0x00000000 00000000
 INTERLAKEN_RX_BAD_PACKETS                     0x00000000 00000000
 INTERLAKEN_RX_CRC_ERROR                       0x00000000 00000000
 INTERLAKEN_RX_ALIGNMENT_ERROR_0               0x00000000 00000000
 INTERLAKEN_RX_ALIGNMENT_ERROR_1               0x00000000 00000000
 INTERLAKEN_RX_ALIGNMENT_ERROR_2               0x00000000 00000000
 INTERLAKEN_RX_ALIGNMENT_ERROR_3               0x00000000 00000000
 INTERLAKEN_RX_ALIGNMENT_FAILURE               0x00000000 00000000
 INTERLAKEN_RX_ALIGNMENT_FAILURE_1             0x00000000 00000000
 INTERLAKEN_RX_ALIGNMENT_FAILURE_2             0x00000000 00000000
 INTERLAKEN_RX_ALIGNMENT_FAILURE_3             0x00000000 00000000
 INTERLAKEN_RX_BLK_TYPE_ERROR_AGGR             0x00000000 00000000
 INTERLAKEN_RX_DIAG_CRC_ERROR_AGGR             0x00000000 00000000
 INTERLAKEN_RX_WORD_SYNC_ERROR_AGGR            0x00000000 00000000
 INTERLAKEN_LAST_CNT                           0x00000000 00000000
                                               0x00000000 00000000
 -------------------------------------------------------------
Ingress fabric-to-bridge interface 1 counters for NP 0
 INTERLAKEN_RX_PACKETS                         0x00000000 03e3a8a4
 INTERLAKEN_RX_BYTES                           0x00000000 dec9c1ce
 INTERLAKEN_RX_BAD_PACKETS                     0x00000000 00000000
 INTERLAKEN_RX_CRC_ERROR                       0x00000000 00000000
 INTERLAKEN_RX_ALIGNMENT_ERROR_0               0x00000000 00000000
 INTERLAKEN_RX_ALIGNMENT_ERROR_1               0x00000000 00000000
 INTERLAKEN_RX_ALIGNMENT_ERROR_2               0x00000000 00000000
 INTERLAKEN_RX_ALIGNMENT_ERROR_3               0x00000000 00000000
 INTERLAKEN_RX_ALIGNMENT_FAILURE               0x00000000 00000000
 INTERLAKEN_RX_ALIGNMENT_FAILURE_1             0x00000000 00000000
 INTERLAKEN_RX_ALIGNMENT_FAILURE_2             0x00000000 00000000
 INTERLAKEN_RX_ALIGNMENT_FAILURE_3             0x00000000 00000000
 INTERLAKEN_RX_BLK_TYPE_ERROR_AGGR             0x00000000 00000000
 INTERLAKEN_RX_DIAG_CRC_ERROR_AGGR             0x00000000 00000000
 INTERLAKEN_RX_WORD_SYNC_ERROR_AGGR            0x00000000 00000000
 INTERLAKEN_LAST_CNT                           0x00000000 00000000
                                               0x00000000 00000000
 -------------------------------------------------------------
Related Information
The following documents are good references also:
Punt fabric datapath failures:
- http://www.cisco.com/c/en/us/support/docs/routers/asr-9000-series-aggregation-services-routers/116727-troubleshoot-punt-00.html
- https://supportforums.cisco.com/docs/DOC-32083
Quality of Service architecture for the ASR9000
- Mark as Read
- Mark as New
- Bookmark
- Permalink
- Report Inappropriate Content
hi adam, trident/typhoon follow the same logic.
TM is traffic manager, the portion that handles the queuing.
There are 2 TM's for egress, there is one TM for ingress.
In search of a preservation of high prio traffic, you'd want to set a pmap on ingress that marks that to the right prio level. this will ensure that traffic follows the designated high priority queues.
cheers
xander
- Mark as Read
- Mark as New
- Bookmark
- Permalink
- Report Inappropriate Content
Thank you very much Xander,
That is excellent news,
As you might know it’s not always as simple as just mapping the traffic to a correct queue, so just want to make sure that on ASR9K all chokepoints on all components would not drop HP traffic especially FIA to NPU and NPU to line as well as line to NPU.
Would the LC CPU issue pause-frames if the NPU is being overloaded by the input from line port please?
Thank you
adam
- Mark as Read
- Mark as New
- Bookmark
- Permalink
- Report Inappropriate Content
think you misunderstood what I meant, when you define the pmap with the priority level 1 or 2 it would move the traffic into the HP1/HP2 queues in all the forwarding asics like NP, FIA etc. The HP1/HP2 is not flowed off when there is egress backpressure hence you have your priority preservation right there.
pause frames the a9k mac can do, but it is not dependent on the npu load.
it would be not good to send pause frames when an egress npu is backpressuring, since other destinations/npu's may be able to accept, the ingress MAC doesn't know what egress destination is going to be taken.
For the ingress NPU load, a pause could be sent, but that is not implemented as such. in IOS devices pause frames would be sent when the ingress hold Q on the phy/mac was not drained fast enough, that is the general application of pause frames, but since there is no controlled ingress ring for a9k it wouldnt apply as such much...
xander
xander
- Mark as Read
- Mark as New
- Bookmark
- Permalink
- Report Inappropriate Content
Hi Xander,
Thank you very much.
I’d like to ask if it is possible to monitor the EFD drops on the Input Classification Frame Descriptor Queues.
I’d like to design a test where the NPU with no features enabled would be subject to full load at a given packet size –but no drops
And then I’d enable various features or combination of features intended for production to see by what margin will they affect the performance of the NPU under the test.
Seeing the EFD drops at various ICFDQs would indicate that indeed the NPU under the test is dropping the traffic (sort of validity test).
Would that be possible please?
Of course if portion of the traffic is marked as HP1/HP2 on ingress to the box that portion of traffic should experience no drops.
Thank you
adam
- Mark as Read
- Mark as New
- Bookmark
- Permalink
- Report Inappropriate Content
on typhoon or tomahawk based linecards you'd want to look at the np counter _DISCARD_ that can be pulled via:
show controller np counters npX loc 0/Y/cpu0 | i DISCARD
xander
(it's discard indeed, not efd as I had earlier typed, sorry)
 - Emeritus")
- Mark as Read
- Mark as New
- Bookmark
- Permalink
- Report Inappropriate Content
hi Adam,
you can easily identify EFD drops. Just look for these NP counters:
RP/0/RSP0/CPU0:our9001#sh controllers np descriptions loc 0/0/cpu0 | i PRIORI
Thu Feb 13 21:18:38.624 CET
PARSE_FAST_DISCARD_LOW_PRIORITY_DROP_0 Drop
PARSE_FAST_DISCARD_LOW_PRIORITY_DROP_1 Drop
PARSE_FAST_DISCARD_LOW_PRIORITY_DROP_2 Drop
PARSE_FAST_DISCARD_LOW_PRIORITY_DROP_3 Drop
/Aleksandar
- Mark as Read
- Mark as New
- Bookmark
- Permalink
- Report Inappropriate Content
Thank you so much Xander, Aleksandar
adam
- Mark as Read
- Mark as New
- Bookmark
- Permalink
- Report Inappropriate Content
Hi Gents,
I would like to ask whether the ICU and EFD, or similar functionality to favour high priority packets for NPU pipeline, is available also in the nPower X1e NPUs (CRS X and NCS6K) please?
Thank you very much
adam
- Mark as Read
- Mark as New
- Bookmark
- Permalink
- Report Inappropriate Content
that exists! if the pipeline is getting clogged, and EFD kicks in, a basic check on:
ISIS/LACP and exp/cos/prec exists to prioritize those packets of high priority and serve them to prevent routing flaps, bfd and member flaps etc.
xander
- Mark as Read
- Mark as New
- Bookmark
- Permalink
- Report Inappropriate Content
Hey Xander,
Excellent, thank you very much.
Also I’d like to ask if there are some plans to implement NPU telemetry to monitor utilization.
adam
- Mark as Read
- Mark as New
- Bookmark
- Permalink
- Report Inappropriate Content
Oh and forgot to ask can it also prioritize/protect EF(VoIP) traffic?
- Mark as Read
- Mark as New
- Bookmark
- Permalink
- Report Inappropriate Content
yes this is part of XR 62 which will be telemetry heavy!
x
- Mark as Read
- Mark as New
- Bookmark
- Permalink
- Report Inappropriate Content
if it is marked with a desginated prec or cos (or exp) then yes we can match like that, but it will be ALL traffic that has that prec setting, so no custom filters or anything... (that'd be too much processing defeating the EFD capability :)
xander
- Mark as Read
- Mark as New
- Bookmark
- Permalink
- Report Inappropriate Content
Wow you guys are the best,
Thank you so much.
adam
- Mark as Read
- Mark as New
- Bookmark
- Permalink
- Report Inappropriate Content
Hi Xander
From my understood ASR9K separate control plane and data plane. But when I look inside architecture then I have question here.
- Base on communication control plane messages (such as BFD) between LC-CPU and RSP-CPU, What's channel for this messages? Is it traverse through gigabit ethernet link or via the FIA?
- Any control plane messages traverse via FIA?
My concern is if we have some congestion or overload issue on egress-cpu then how FIA can treat control plane messages. I hope FIA will not drop any control plane messages even egress-npu overload.
Thank you
Pichet
Find answers to your questions by entering keywords or phrases in the Search bar above. New here? Use these resources to familiarize yourself with the community: