- Cisco Community
- Technology and Support
- Service Providers
- Service Providers Knowledge Base
- ASR9K NetFlow White Paper
- Subscribe to RSS Feed
- Mark as New
- Mark as Read
- Bookmark
- Subscribe
- Printer Friendly Page
- Report Inappropriate Content
- Subscribe to RSS Feed
- Mark as New
- Mark as Read
- Bookmark
- Subscribe
- Printer Friendly Page
- Report Inappropriate Content
on 09-13-2013 09:59 AM
Audience
This white paper is intended to help customers obtain a quick understanding on Netflow feature in general and how it has been implemented in ASR9k including the configuration detail. It also includes a ‘frequently asked questions’ (FAQ) section, which cover some of the potential field questions that might pop up while deploying this feature using ASR9k. Overall, this white paper can be a quick reference guide for anyone working on this feature. Although, NetFlow is introduced in generic sense, focus is on ASR9K implementation; i.e., not all of the features supported by IOS platforms are supported by ASR9K platform and some feature implementation may be specific to ASR9K.
SIP700, CPP-based and SIP700 imply the same line card (QuantumFlow Processors based cards). This are modular SPA based LineCards to support legacy interfaces, Sonet, SDH, channelized etc…
Ethernet LC (NP3c, Ethernet) & Enhanced Ethernet LC (NP4c, Enhanced Ethernet) are Ethernet based line cards. Except for performance, sampler, and policer rate, the NetFlow feature support is similar, but not necessarily same. For example, most of the feature enhancements in releases 4.3.0 & above are done for Enhanced Ethernet LC LCs only.
* Since, originally document was written with Ethernet LC in mind, some spots in the document might still be referring to Ethernet LC only, but in all possibility it might apply to Enhanced Ethernet LC also. We can’t have Might in the above line, it has to be either it does or it doesn’t, and we need to call these places out.
1. Netflow Overview
Figure 1: Netflow deployment
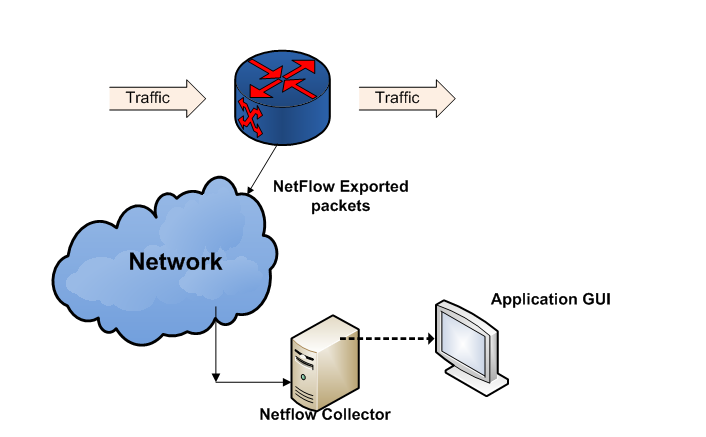
Netflow is a dynamic traffic accounting feature, which is used for billing, capacity planning, security monitoring, application, user profiling and traffic accounting in IP networks.
NetFlow on the router captures certain attributes, such as, flow tuple (src/dst IP/port + protocol), ToS/Exp, MPLS labels, input/output interfaces, timestamps, packet & byte counts, etc., for the traffic flowing across NetFlow enabled interfaces. It then exports this data to a specified device, which is the ‘Collector’. The ‘Collector’, aggregates and presents this collected data in a very user-friendly format. It often facilitates this through a feature rich GUI. This interaction is described in Figure 1.
1.1 Why Netflow?
NetFlow Services capitalizes on the flow nature of traffic in the network to provide detailed traffic accounting information with minimal impact on router/switch performance. NetFlow data can be used for a variety of purposes, including network management and capacity planning, enterprise accounting, departmental chargeback, usage-based billing, data warehousing/mining for marketing purposes, etc.
NetFlow can be categorized as follows:
• Full NetFlow: All packets are monitored & reported for a given type of protocol.
• Sampled NetFlow (SNF): Only some packets are selected and reported. This is known as Sampled NetFlow (SNF).
• Flexible NetFlow (FNF): As the name suggests, Flexible NetFlow is very flexible in identifying traffic including deep packet inspection, entire IPv4 & IPv6 headers, in addition to what the above two types NetFlow facilitate.
1.2 Key Components of Netflow
Figure 2 Key Components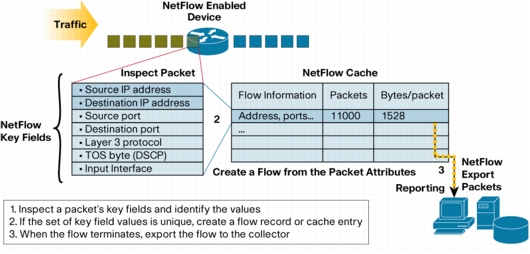
The set of key fields shown in the figure above are only for the sake of example. There are many other such fields that distinguish a NetFlow record from another.
NetFlow has a number of key components:
• NetFlow cache
• Flow export timers
• NetFlow Flow Record
• NetFlow exporter
• NetFlow Sampler
• NetFlow Monitor
• NetFlow Templates
• NetFlow Collector for collection and reporting
1.2.1. NetFlow Cache
There are two types of flow caches that are supported in NetFlow:
• Normal cache
The normal cache uses flow timers to expire and exports flows to a NetFlow collector. This is a great advantage for tracking security incidents where open or partial flows might be recorded (ie: SYN flood attack).
• Permanent caches
The permanent cache is very different from a normal cache and will be most useful for accounting or security monitoring. The permanent cache will be a fixed size chosen by the user. After the permanent cache is full, all new flows will be dropped. A good example of the usage of this type of cache would be the tracking of traffic matrix, where a fixed set of flows are used to track traffic between specific end points.
NOTE: Cache-type permanent is NOT supported for CPP-based cards.
FAQ section has further details on this.
1.2.2. Flow Export Timers and events
Once extracted, this flow data resides in a cache in memory and is viewable through router CLI commands. In order to be combined with NetFlow data from all other routers, however, the flow records must be exported to a NetFlow collector. This export occurs when data in the cache is recycled. Recycling can occur in one of three ways:
1) The cache entry expires due to not matching incoming traffic for a specified amount of time – the inactive timer.
2) The cache entry, though still matching incoming packets, has been in the cache so long that it exceeds another time limit – the active timer.
3) The cache becomes full, so some of the oldest entries are purged to make room for new entries. The NetFlow cache has a predefined size depending on platform and/or amount of memory available.
4) When flows terminate, e.g., for TCP flows when a FIN or RST has been received.
Note:The FAQ section has further details on this.
1.2.3. NetFlow Flow Record
A Flow Record is a set of key and non-key NetFlow field values used to characterize flows in the NetFlow cache. The Flow Record is created by inspecting packet headers and other adding a description of packet information to the NetFlow cache as the Flow Record.
1.2.4. NetFlow Exporter
NetFlow exporter is a router or a switching device that is exporting the NetFlow records to the collector. There are two primary methods to access NetFlow data: the Command Line Interface (CLI) with show commands on the exporter or utilizing an application reporting tool receiving export. NetFlow exporter pushes information periodically to the NetFlow reporting collector. In general, the NetFlow cache is constantly filling with flows, and software in the router or switch is searching the cache for flows that have terminated or expired, and these flows are exported to the NetFlow collector server. Flow export is optional but it's the only method to get a complete view of all NetFlow data in a set of Cisco devices. The NetFlow Exporter allows the user to define where the exported data can be sent and properties for the export. Multiple exporters can be configured per Flow Monitor or same exporter can be used by multiple monitors. For example, the user may want to send the same data to a billing device as well as a traffic analysis server. The NetFlow Exporter also has the capability to send optional data such as tables of information to a NetFlow collector. An example of table export would be the interface If-index to interface name mapping. The exporter can also allow the class of service to be marked for the export stream.
1.2.5. NetFlow Sampler
Sampler defines the rate at which the packet sampling is done at the interface level when NetFlow is enabled on it. This is carried out through CLI as 1 out-of every N packets where N is in the range of <1-65535>. For very high speed switching and forwarding interfaces, N is selected high such that the sampling, replication & processing does not affect the overall performance adversely. The sampler configuration usually propagates to data path context to facilitate selection of the packet.
1.2.6. NetFlow Monitor
NetFlow Monitor defines the type of traffic to be monitored (IPv4, IPv6, MPLS, etc), the type of cache & its size to be employed for NetFlow records, cache entry timeouts, and the exporter to be used for exporting the records. This is achieved by means of CLI. For sampled NetFlow, the monitor & sampler together define NetFlow configuration for an interface. For full NetFlow, sampler tie up is not required for an interface as all packets are sampled.
1.2.7. Netflow Collector
Cisco NetFlow Collector (NFC) is a best-in-class data collection and aggregation product that provides a centralized view of data analysis and reporting. The Netflow Collector collects the netflow packets exported by the netflow exporter, and presents, and nice web tabular view or graph view of the netflow data. It collects data from a number of exporters in the network to give a holistic view of the network usage for capacity planning, usage & billing, security analysis, etc., as explained before.
2. NetFlow on ASR9K
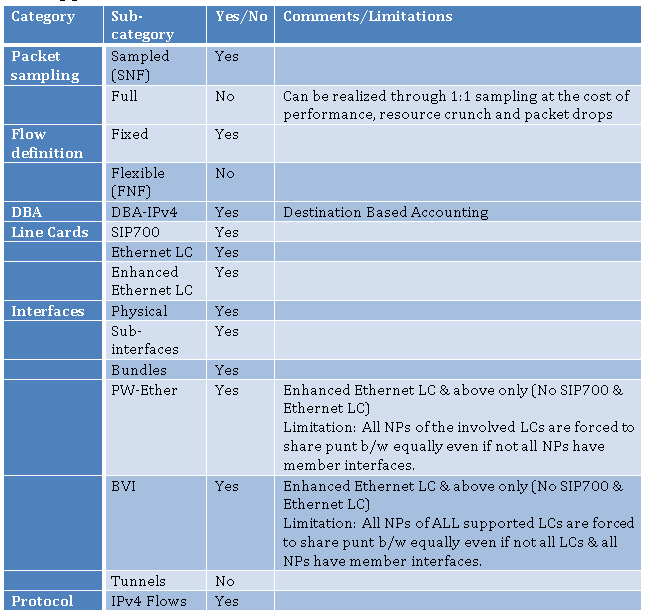
2.1 Support Matrix
Table 1 NetFlow support matrix
2.2 Architecture
ASR9000 is one of the platforms under the umbrella of IOS-XR platform independent (PI) features. The other such platforms are CRS & 12000. All processes and data structures common to all platforms belong in the PI domain. Only the platform dependent (PD) processes and data structures are implemented by individual platforms. Following diagram describes the interaction between the PI, PD & the forwarding hardware.

It’s beyond the scope to describe the architecture in detail. In brief, the nfma spawns nfea when NetFlow is configured on an interface through CLI for the first time. Nf_producer is spawned by PD DLL. The entities shown in RP are to take care of virtual interfaces like, bundle, pw-ether, bvi, etc. The entities in LC are for physical interfaces. Nfea PD DLL programs the hardware (e.g., NP) when one of its interfaces is configured with netflow. Datastructures programmed are interface uidb, punt table, punt policer and sampler. Sampled packets are summarized into NetFlow records and sent to NetFlow Producer through SPP/SPIO interface. It forwards these records to the NetFlow Server, which caches them and eventually exports them to the external collector through NetIO.
The recording of different flow attributes in supported line cards is done by LC CPU. All flow packets from the NPs are punted to LC CPU. To avoid flow packets arriving from the NP at overwhelming rate, punt-path needs to be policed by means of programming policers on all the NPs that have interfaces with NetFlow monitoring enabled. The policer rate would be determined based on CPU capable rate divided by number of Net-flow turned ‘ON’ NPs. This rate would be dynamically adjusted based on user-configuration of net-flow (like adding and removing of Net-flow to the interface).
For bundles interfaces that have netflow applied, NFEA will interact with IIR to receive member interface up and down information and program punt path policer rate based on number of NPs that has member of the bundle interface. For PW-Ether interfaces, nfma & nfea use IM-Client infrastructure to program the policer rates on all NPs of LCs that own physical interfaces of the PW-Ether generic member lists. For BVI, all NPs of all Enhanced Ethernet LC LCs are police-rate programmed equally sharing the 200Kpps b/w.
Netflow behavior differs in case of CPP based cards, where the entire feature handling is done by CPP. CPP Net flow client is Configured through appropriate DLLs, which include the information about monitor maps, sampler-maps and exporter-maps. The CPP Net flow datapath is responsible for exporting the flow records to the external Net flow-collector, unlike the case of Ethernet LC where there is a separate control path ( NP -••à CPU) where CPU is responsible for exporting the flow attributes to NFC.
Ethernet LC based net-flow is required to support 1:N traffic sampling where N ranges from 1--64k. The sampling rate is user-configurable where 1 out of N packets would be processed by the Net-flow. This rate is set by user through a sampling-map applied to the interface for which Net-flow is configured. Each sampling profile map corresponds to one sampling rate. It is the function of nfea to configure this in NP Search result memory. This consumes lot of space in the NP result memory, so only limited sampling profiles can be used in Viking. In the initial Viking release Punt bandwidth for each of the NPs follow the procedure outlined above. This is the policer-rate configured on each of the NPs which has interfaces configured with Net flow.
Enhanced Ethernet LC & later line cards use the similar procedure for programming the sampler & policer-rates. They don’t have the same memory restrictions as Ethernet LC for this programming.
SIP LC doesn’t have flow export punt to the CPU. The flow export is handled by the CPP itself, so there is no policer rate configured for CPPs for the Net flow. There is also no NetFlow Producer process on SIP.
2.3 Netflow Commands unique to SIP and Ethernet LC/Enhanced Ethernet LC
Some of the Net flow specific commands for CPP (SIP) and Ethernet LC/Enhanced Ethernet LC-based cards are listed below.
Commands Unique to Ethernet LC:
1) show flow platform nfea policer np <np-id> location < >
#ing_lnks #egr_lnks cur_rate policer_id root_hdl node_hdl chkpt_id
======================================================
In the above command, ing_links would be ‘1’ if Net flow is configured in ingress direction for a particular interface corresponding to the NP. Cur_rate specifies the Net flow policer rate for a particular NP. It would be 1,00,000 (200K for Enhanced Ethernet LC) if the interface under only 1 NP is configured with Netflow in the given LC, else it would be 1,00,000/(Number of NPS configured). If no interface is configured with NF, it would be ‘0’.
2) show flow platform producer statistics location < >
IPv4 Egress Packets: 0
IPv6 Ingress Packets: 0
IPv6 Egress Packets: 0
MPLS Ingress Packets: 0
MPLS Egress Packets: 0
Drops (no space): 0
Drops (other): 0
Unknown Ingress Packets: 0
Unknown Egress Packets: 0
Worker waiting: 0
SPP Packets: 0
Flow Packets: 0
Flow Packets per SPP Frame: 0
This is one more command unique to Ethernet LC which displays the nf_producer( NF PD CLIENT process) statistics like V4, V6 and MPLS Ingress, Egress packets. Nf_producer client on LC CPU gets the flow export packets from NP using the SPP frame-work, the counter of which is shown in SPP packer counter.
3) show flow platform nfea samp [detail] location < >
Sampler Name: smm
id: 11, sp_id: 0, interval: 1, ref_count: 2
The interval in the above command shows the configured sample-rate on all the interfaces on the given LC.
Commands Unique to SIP LC:
1) show controllers pse qfp feature fnf datapath sampler [intf-type] location < >
Monitor 0 < -------- Stats for ingress Monitor
Sampler 0x89368c00
id 55, type 1, window 100, position 0x1
packets_seen 0, samples_taken 0
Monitor 0 < ------- Stats or egress monitor
Sampler 0x8c63f800
id 55, type 1, window 100, position 0x1
packets_seen 0, samples_taken 0
The above o/p contains the sampler-map attributes [sampler-id ] configured on CPP, in ingress as well as egress directions. The samples_taken is the cumulative number of packets seen by NF, of a particular record type configured for that.
[[NOTE1:]] Even though the above command is executed on the interface, the stats will increment based on the packets seen by the NF, configured on any of the interfaces in the given LC. In short, the command is not implemented based on /intf, the stats are /LC.
[[NOTE2:]] The clear statistics for the above command is not implemented on SIP700. It gives the cumulative stats of all the NF sampled packets of all the interfaces configured in the given LC. Once the monitor map is removed and re-applied on the interface, the stats will be cleared [work-around for clearing stats]
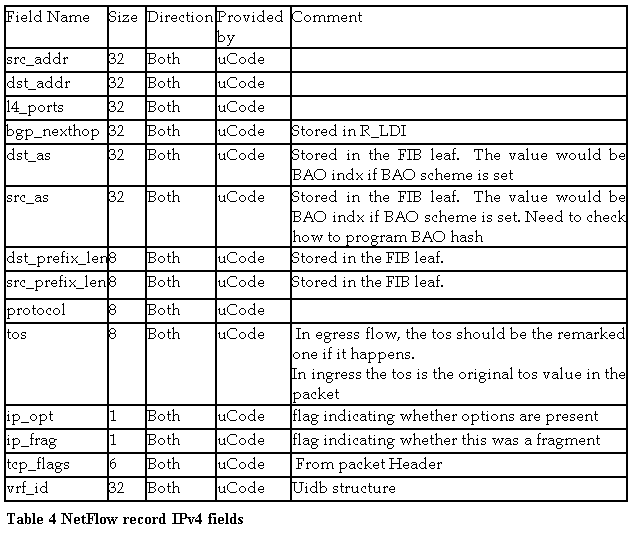
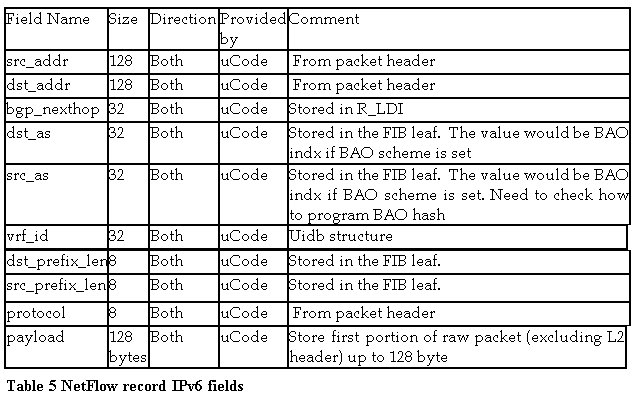
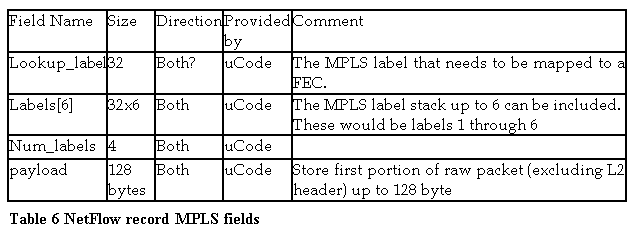
2.4 NetFlow record formats
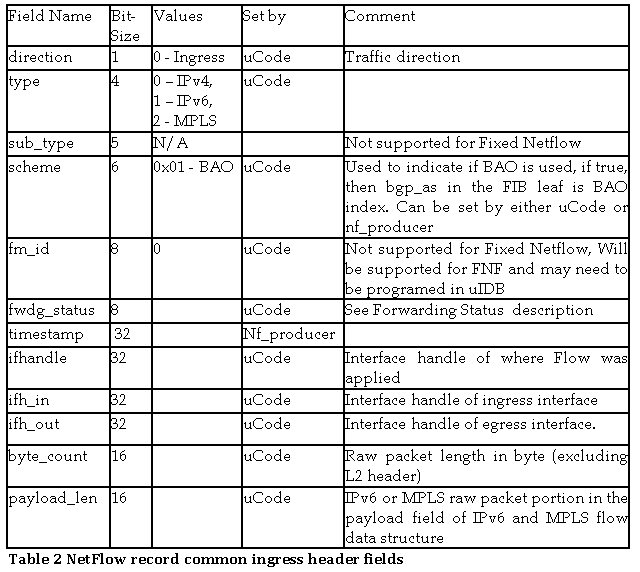
We support three flow types: IPv4, IPv6, and MPLS. When a packet is sampled, the uCode will construct a flow packet and set most of the required fields.
The table below lists all the fields that are common to all flow types.
Flow Packet Common Header fields for Ingress Flow Packet
Flow Packet Common Header fields for Egress Flow Packet

IPv4 Flow Packet Data Fields
IPv6 Flow Packet Data Fields
MPLS Flow Packet Data Fields
2.5 Netflow sampling limit
In Ethernet LC/Enhanced Ethernet LC card NF flow export happens in the control plane (NP punts the flow-export packet to the LC CPU), which is totally independent of forwarding-plane unlike in the case of SIP700, where the flow export happens in the forwarding plane itself. In Ethernet LC NF sampling limit depends on the Policer-rate configured on particular NP (The policer-rate is configured on NP based on the interfaces that are configured with Netflow on NPs and the sampling rate interval that is specified). Once the traffic exceeds the Policer-rate configured for a particular NP, Net flow will start dropping the packets in the control plane, the forwarding-plane is not affected though.
In SIP700, since the flow export happens in the data-plane, the NF sampling limit is limited by ‘LINE RATE’. However some factors listed below, affect the NF sampling limit.
- Flow type (e.g., ipv4, ipv6 etc)
- What is NDR(No Drop Rate) without netflow?
- What is NDR with netflow?
- Packet size
- What is the impact of IMIX
It is understood that with number of features (e.g., MPLS + IP) the processing rate may go down. So in some cases CPP can’t handle the LR.
2.6 Differences between SIP and Ethernet LC/Enhanced Ethernet LC Netflow:
Type | Ethernet LC/Enhanced Ethernet LC | SIP700 (SIP) |
1) Packet with BAD Source address | Netflow Records the flow | Netflow doesn’t record the flow. |
2) cache type “Permanent” | Net flow supports this cache type | Net flow doesn’t support this cache type. |
3)Packets with TTL ‘1’ | Net flow gives the FwdStatus as ‘DROP-BAD-TTL’ and the corresponding export is 137 | Net flow gives the Fwdstatus as ‘Drop’ and the Fwd status export is 128. |
4) V6 packet with fragment header included with Foff > 0 | Net flow will not set the L4-NotFound-Bit in the V6Optheader-mask | Net flow sets the L4-NotFound-Bit along with the FH bit in the opthdr mask. |
5) Exporter-map specified with the invalid src addr for NFC export packet. | NF won’t export the packet to NFC. The cmnd stats “show flow exporter-map < > loc < >” will show the NULL stats. | SIP700 NF won’t check the address while exporting, as a result Export packet will be exported to NFC and NFC will drop the packet as it is from invalid src addr. The cmnd “show flow exporter-map < > loc < >” will show increment stats. |
6) NF record of a L2VPN Packet. | Net flow won’t record the packets in L2VPN packets. | Net flow won’t record the packets in L2VPN packets. |
7) Exporter-map specified with same src and dest. Address for the packet export. ( Negative scenario: e.g. src address=dest address = Loopback address ) | NF will build the Export packet, gives it to NETIO, but the destination drops it. The drop counters in the “show flow exporter-map < > loc < >” will not be seen incrementing. | NF will not export the packet to destination. The drop counters can be seen incrementing in the “show flow exporter” cmnd. |
8) Number of exporter-maps that can be configured in a monitor-map. | Maximum number is ‘8’ and exceeding that config will fail. All 8 maps will be programmed in LC HW. | Maximum Number of maps that will be supported is ‘8’. After the user configuration exceeds ‘5’, NF throws a warning message. Will not get rejected even the exceeding maps will not be configured in the hardware. Side-effect of such scenario would be the removal of config during LC/RSP reload. |
9) Maximum number of flows that can be recorded /LC | 1M | 1M |
10) Flow Monitors /interface/direction/protocol | 1 | 1 |
11) Number of flows/sec that can be recorded by NF | Ethernet LC: 50K flows/sec, with LC CPU Usage upto 50% Enhanced Ethernet LC: 100K flows/sec with LC usage upto to 50% | No LC CPU intervention. So the recording is limited by CPP processing speed. |
12) NF Export | V9 with UDP | V9 with UDP |
13) Number of Flow-monitors /LC | 1 per interface per protocol per direction | 64 |
14) Flow exporters/ LC | 8 per Flow Monitor | 64 |
15) Flow samplers /LC | ‘4’ ranging from 1:1 to 1:64K per NP for Ethernet LC No such limit for Enhanced Ethernet LC | ‘64’ ranging from 1:1 to 1:64K |
16) NF sampling limit | Depends on the policer-rate, when exceeded, drops the packets in Control plane but forwarding data plane won’t be affected | Limited by ‘LR’ in addition to the factors listed above. |
17) Fwd status for the packet with reachable destination. | Fwdstatus = ‘Fwd’ , exported Fwd status = 64 | Fwdstatus = ‘FwdNoFrag’, exported Fwdstatus = 66 |
18) Performance numbers. | NF sampling depends on the policer rate configured on NP in an LC. If a single interface is configured with the Net flow, in an LC, the policer-rate configured would be 1,00,000 (Ethernet LC) & 2,00,000 (Enhanced Ethernet LC), and with the sampling rate configured 1 out-of 1, 1,00,000 pkts/sec (Ethernet LC) & 200Kpps (Enhanced Ethernet LC), will be sampled by the NF. Decreasing the sampling rate improves the NF performance. | V6 NF is observed to have full LR support for the packet sizes varying from 150-250 bytes, where-as MPLS-V6 packet recording is observed to have NDR of 95% LR with and without netflow enabled for packet sizes varying from 150-250 bytes. Sampling-rate is 1 out-of 1 in these cases. |
19) No. of bytes in the L3 header that Net flow can record | First 128 bytes of the header will be recorded by Netflow | No such limitation for SIP700 CPP. |
20) NF Implementation | Control plane | Data plane ( Forwarding plane) |
21) ‘TCP FIN FLAG’ COUNTER in the command “show flow monitor < > cache location < > “ | Updated based on the number of flows exported to the collector, containing ‘TCP FIN FLAG’ in it. | Not Updated in case of SIP700. |
22) Scale Numbers supported. | NF can be enabled in ingress and egress on 4K L3-Subif that are supported /LC | NF can be enabled in ingress as well as egress, on 1) 4K subif /Gi or TenG SPA. 2) 4K FR interfaces /LC 3) 8K FR interfaces /system. |
23) NF Support on interfaces | NF is supported on L3 interfaces, physical, subif, bundle, bundle sub-if, pw-ether, pw-ether sub-i/f, BVI | NF is supported on all kinds of SIP700 L3 interfaces( Gi, POS, Serial with PPP,FR,Multilink..) |
24) Police-rate exceeded packets. | NF will record the Fwd status as ‘DropPolicerDrop’ and the Fwd status exported = 138 | NF Fwd status as ‘Drop’ and the Fw-status is Unknown (128). |
25) Policer rate | Ethernet LC: 100Kpps per LC Enhanced Ethernet LC: 200Kpps per LC | No LC CPU intervention. So the recording is limited by CPP processing speed. |
2.7 Netflow configuration on ASR9k
The example below shows a sample config for IPv4 netflow configuration:
The example assumes the following pre configuration present before configuring Netflow:
- Netflow collector ‘s IP address : 10.10.10.190
- Interface where netflow needs to be enabled is “Gi 0/0/0/1”
- Loopback 0 is configured on a router with IP address “1.1.1.1”
There are 4 steps for configuring Netflow on a router:
- Exporter –Map (Optional if you don’t want to export Netflow packets )
flow exporter-map fem
version v9
!
dscp 40
transport udp 9002
source loopback0
destination 10.10.10.179
!
- Monitor-Map
flow monitor-map fmm
record ipv4
exporter fem
cache entries 10000
cache timeout active 15
cache timeout inactive 5
!
- Sampler-Map
sampler-map fsm
random 1 out-of 1
!
- Apply Monitor-Map to an interface
interface GigabitEthernet0/0/0/1
flow ipv4 monitor fmm sampler fsm ingress
flow ipv4 monitor fmm sampler fsm egress
!
3. Destination Based Accounting (DBA)
Destination-based NetFlow accounting (DBA) is a usage-based billing application that tracks and records traffic according to its destination and enables service providers to do destination-specific accounting and billing. The destination-based NetFlow accounting record includes the destination peer autonomous system (AS) number and the BGP next-hop IP address. DBA can be applied only in the ingress direction.
All packets are monitored and reported in DBA; in that sense, it’s equivalent to full-mode NetFlow with all the limitations mentioned below.
DBA is supported on ASR9000 Gigabit Ethernet and ASR9000 Enhanced Gigabit Ethernet line cards. SIP line cards do not support this feature.
In destination-based NetFlow accounting, the following fields are collected and exported:
- Destination peer AS number
- BGP next-hop IP address
- Ingress interface
- Egress interface
- Forwarding status
- Incoming IPv4 TOS
- Counter of packets in the flow
- Counter of bytes in the flow
- Timestamp for the first and last packets in the flow
Destination-based NetFlow accounting supports the following features:
- Only IPv4 addresses
- Configuration on physical interfaces, bundle interfaces, BVI, and logical sub-interfaces
- IPv4 unicast and multicast traffic
- Only ingress traffic
- Only full mode NetFlow
- NetFlow export format Version 9 over User Datagram Protocols (UDPs)
Destination-based NetFlow accounting does not support the following features:
- IPv6 addresses
- MPLS IPv4 and IPv6
- Configuration for individual odular QoS Command-Line Interface (MQC) classes
- Simultaneous configuration of destination-based NetFlow accounting with IPv4 sampled NetFlow on the same interface, in the same direction.
- Layer 2 switched MPLS traffic
- Egress traffic
- Sampled mode NetFlow
- NetFlow export formats version 5, version 8, IP Flow Information Export (IPFIX), or Stream Control Transmission Protocol (SCTP).
3.1 DBA configuration
Export map for DBA is same as for NetFlow. There is no sampler map as all packets are monitored. So, DBA configuration involves only exporter, monitor maps and applying the monitor on the ingress interface.
3.1.1. Monitor Map
configure
flow monitor-map map_name
record ipv4 destination-tos
commit
*Note the ‘destination-tos’ keyword to indicate the destination based accounting.
3.1.2. Interface configuration
configure
interface type interface-path-id
flow ipv4 monitor name ingress
commit
*Note that the monitor is applied only in the ‘ingress’ direction under the interface.
** The debugging & troubleshooting procedures of DBA are similar to those of NetFlow and hence, not being covered separately.
4. FAQs
Q: Which hardware supports Netflow on ASR9k?
All Ethernet LC NP based line cards – 1G and 10G
All Enhanced Ethernet LC NP based line cards – 1G, 10G, 40G and 100G
Only Netflow for IPv4 is supported on SIP-700 LCs
Q: What Netflow Types are supported?
Following netflow types are supported on all LC types.
- LCFS5725 LCLCLClllll will support IPv4 flow type.
- LCFS4148 LCLC will support IPv6 flow type.
- FS4149 LC will support MPLS flow type.
Q: Does Netflow support Multicast Flow types?
Yes, Netflow feature will support Multicast flow types.
Q: Does Netflow support L2 Flow types?
No, Netflow feature does not support L2 flow types.
Q: How does NetFlow account for IP fragmentation?
Because IP fragments do not include application-level port information, NetFlow treats them as new flows.
Q: Does Netflow support export of BGP attributes?
Yes, to enable netflow exports of BGP attributes, configure “bgp attribute-download” under “router bgp <as#>” on the router.
When BGP attribute download is enabled, BGP downloads the attribute information for prefixes (community, extended community, and as-path) to the Routing Information Base (RIB) and Forwarding Information Base (FIB). This enables FIB to associate the prefixes with attributes and send the NetFlow statistics along with the associated attributes.
Example:
router bgp 200
address-family ipv4 unicast
bgp attribute-download
Q: How is a flow defined in the context of NetFlow?
A network flow is identified as a unidirectional stream of packets between a given source and a destination---both being defined by network- layer (IP) address and transport-layer port number.
Specifically, a flow is identified as the combination of the following fields:
- Source IP address
- Destination IP address
- Source TCP/UDP application port number
- Destination TCP/UDP application port number
- IP protocol type
- IP ToS (Type of Service)
- Input physical interface
Q: What types of Interfaces are supported by netflow?
- L3 interfaces
- FS4153 Physical main interfaces.
- FS4154 L3 subinterfaces
- FS4155 Bundle interfaces
- FS4155 Bundle sub-interfaces
- PW-Ether interfaces
- BVI interfaces
- VRF interfaces.From
- In case of CPPIn case of CPP-based cards, Net flow is supported on Gig, tenGi, POS, Multilink, Sub-if, serial interfaces with PPP and FR encapsulations.
Q: What directions of interface types are supported by netflow?
- FS4157 Netflow feature will be supported on the ingress direction of interface types listed above.
- FS4158 Netflow feature will be supported on the egress direction of interfaces types listed above.
Q: What Sampling mode is supported?
Netflow will support Random Sampling Mode
Q: Is Full mode Netflow supported?
No, Only Sampled Netflow is supported by the netflow.
Q: How can a netflow function as a full mode netflow?
Enabling 1:1 sampling will make the netflow work like a full mode netflow (but it is still a sampling netflow that will sample all the packets.)
Q: What sampling rate is supported by netflow?
Netflow will support both sample rate (1 in N) and (1 in 1).
Where N ranges from 1 to 64K.
Q: Which flow record contents are supported?
- Netflow will support Fixed IPv4 flow format.
- Netflow will support Fixed IPv6 Flow format.
- Netflow will support MPLS flow format.
- Netflow will support MPLS-IPv4 flow format.
- Netflow will support MPLS-IPv6 flow format.
- Netflow will support MPLS-IPv4-IPv6 flow format.
Q: What are the types of Cache aging supported by Netflow?
Netflow will support “Normal (aging), and permanent (never age) ”
Q: What is the NetFlow cache? What are the rules for expiring NetFlow cache entries?
The NetFlow cache stores information that identifies unique flows. The NetFlow cache management software contains a highly sophisticated set of algorithms for efficiently determining if a packet is part of an existing flow or should generate a new flow cache entry, dynamically updating per-flow accounting measurements residing in the NetFlow cache, and cache aging/flow expiration determination. Rules for expiring NetFlow cache entries include:
- Flows which have been idle for 15 seconds are expired and removed from the cache.
- Long-lived flows are expired and removed from the cache. Flows are not allowed to live more than 30 minutes by default, although the underlying packet conversation remains undisturbed. The flow expiration parameter is user configurable.
- As the cache becomes full, a number of heuristics are applied to aggressively age groups of flows simultaneously.
- TCP connections which have reached the end of byte stream (FIN) or which have been reset (RST)
Q: What is NetFlow Export data? How does NetFlow Data Export operate? When is NetFlow data exported?
Expired flows are grouped together into NetFlow Export UDP datagrams for export from the NetFlow-enabled device. Flow datagrams are exported from NetFlow-enabled devices at least once per second, or, as soon as a full UDP datagram of expired flows is available. NetFlow functionality is configured on a per-interface basis. To configure NetFlow Export capabilities, the user simply needs to specify the IP address and application port number of the Cisco NetFlow Collector (an application that provides NetFlow Export data filtering) configured to receive the exported flow data.
Q: What happens to new flows when the NetFlow cache becomes full?
Each time a new flow is added to the NetFlow cache, the number of available NetFlow cache entries is checked. If there are only a few free flows remaining, NetFlow attempts to age 30 flows using an accelerated timeout. If there is only one free flow remaining, NetFlow automatically ages 30 flows regardless of their age. The intent is to ensure free flow entries are always available.
Q: What export protocol is used by Netflow exporter?
Netflow will use Netflow V9 Export format to export Netflow packets.
Q: Is Netflow Aggregation scheme supported?
No.
Q: What transport layer protocol is used by Netflow exporter to export netflow packets?
Netflow uses UDP as a transport layer protocol to export netflow packets.
Q: What are Netflow specific scales and Limitations?
Netflow specific scale and Limitations are described below:
- Supports configurable Sampling Rate 1:1 ~ 1: 65535
- Supports only up to 4 Sampling Rates (or Intervals) per Ethernet LC LC; no such limit for Enhanced Ethernet LC.
- Up to 4k interfaces/sub-interfaces (4K system limitation) can be configured with flow monitor per system.
- Supports up to 8 flow exporters per flow monitor
- Supports up to 1 million flow entries per LC
- Supports up to 50k flows per second with LC CPU usage up to 50% per Ethernet LC LC
- Supports upto 100K flows per second with LC CPU usage up to 50% per Enhanced Ethernet LC LC
- Netflow scale is increased to 200Kpps on Enhanced Ethernet LC based LCs
- Supports exporting packet rates up to 50k flows per second (100K flows per sec on Enhanced Ethernet LC based LCs) with LC CPU usage up to 50%
Q: More information about exporter behaviour ?
Irrespective of the rate at which the NP punts the records to CPU, exporter picks up a maximum of 2000 records at a time from the cache that are eligible for export (timers, network/TCP session events, etc). This is basically to avoid NetIO dropping the packets due to lack of b/w. When the exporter wakes up again, it repeats the same.
Q: What is not supported in Netflow?
- No Support of Full Mode Sampling
- No Support of Deterministic Sampling Algorithm
- No Support of V5, V7, V8 Netflow Export formats
- No Support of Flexible Netflow
- No Support of Netflow for L2 traffic.
- No Support for Netflow MIB.
Q: What are the configuration Rules and Restrictions for Netflow?
- One Flow Monitor only per flow type per interface per direction per protocol.
- No Flow Monitor replace on interfaces supported.
- No Sampler Map replace on interfaces supported.
- Sampler Map needs to be specified with flow monitor when binding them to interface.
- One Sampler Map only per interface per direction per protocol.
Q: What is Punt Path Policer and how is the policer rate calculated?
All flow packets are punted from the NPs to LC CPU through a punt switch. To avoid flow packets arrives at the CPU at an overwhelming rate, punt path policer needs to be applied on all NPs that have netflow feature applied.
The policer rate will be determined by dividing the maximum CPU capable rate by the number of netflow turned “ON” NPs. Policer rate will be dynamically adjusted when NF application among NPs changes by user configuration.
For bundles interfaces that have netflow applied, NFEA will interact with IIR to receive member interface up and down information and program punt path policer rate based on number of NPs that has member of the bundle interface.
The Maximum rate that netflow can punt the packets to CPU is 100K packets per sec.
For example:
Consider the following scenarios:
- Netflow is enabled on one interface on one NP.
In this case, the Policer rate on the Netflow enabled NP will be 100K pps
- Netflow is enabled on two interfaces on two NPs (i.e. one intf on each NP).
In this case the Policer rate is divided between the two Netflow enabled NPs, and the policer rate will be 50Kpps on each NP.
- Netflow is enabled on four interfaces on four NPs (i.e. one intf on each NP).
In this case the Policer rate is divided between the four Netflow enabled NPs, and the policer rate will be 25Kpps on each NP.
- Netflow is enabled on a Bundle interface that has member interfaces from 4 NPs.
In this case the Policer rate is divided between 4 NPs (i.e NPs whose interfaces are members of Bundle interfaces) so the policer rate will be 25Kpps on each NP.
Q: Does Netflow support High Availability?
Yes, Netflow supports High Availability.
- The netflow MA, netflow Manager, netflow EA processes are individually restartable without impacting the exporting path.
- The SPP/SPIO, netflow producer, netflow server and NETIO component are restartable. Flow traffic will be affected during the process restart.
- The FEA PD DLL will maintain the state of sampler and policer so NFEA will recover to its pre-restart state when restart is complete.
Q: What are the Memory and Performance Impact of Netflow?
The IPv4 cache flow record size is sizeof(flow_record_header_st) + 40 = 92 bytes. The IPv6 cache flow record size is sizeof(flow_record_header_st) + 60 = 112 bytes. The MPLS cache flow record size is 92 bytes. Based on the 1 million flow record supported, nfsvr will consume up to (112 + 92)x 1 million = 204 Mbytes of memory for the largest flow size of IPv6+MPLS.
Q: Does NetFlow require any changes to an existing network or have any implications for compatibility or interoperability?
No. NetFlow is based on identifying packet flows, performing access list processing, and gathering traffic accounting data within a NetFlow-enabled device. It does not involve any connection-setup protocol either between NetFlow-enabled devices or to any other networking device or end station and does not require any change externally---either to the traffic or packets themselves or to any other networking device. Thus NetFlow is completely transparent to the existing network, including end-stations, application software and network devices.
Also, because NetFlow Switching is performed independently on each internetworking device, it does not need to be operational on each NetFlow-enabled device in the network. Network planners can therefore selectively invoke NetFlow (and NetFlow data export) on a router/switch/interface basis to gain traffic performance, control, or accounting benefits in specific network locations. Note that NetFlow does consume additional memory and CPU resources compared to non NetFlow enabled switching modes. Therefore, it’s important to understand the resources required on our router/switch before enabling NetFlow.
Q: How does NetFlow first identify a flow and then subsequently switch packets on a flow basis?
NetFlow operates by creating a flow cache that contains the information needed to account for and perform access list checks for all active flows. The NetFlow cache is built by processing the first packet of a flow through the standard switching path. Each flow is associated with an incoming and outgoing interface port number. The flow cache includes entries for traffic statistics that are updated in tandem with the switching of subsequent packets. Once the NetFlow cache is created, packets identified as belonging to an existing flow can be switched based on the cached information, and security access list checks bypassed. Flow information is maintained within the NetFlow cache for all active flows.
Q: Is NetFlow a Quality of Service (QoS) feature?
No, NetFlow itself is not a QoS feature; it simply captures the Quality of Service level of each flow by recording the IP Type of Service (ToS) byte for each flow.
Q: Can Netflow be used in conjunction with the Set QoS Policies?
Yes, But NetFlow accounting will record packet’s Qos values as they enter the input interface (i.e for ingress Netflow), prior to any TOS modification by Set QoS Policies. Similarly, Netflow will record Packet’s QoS values as they exit on the interface (i.e for egress netflow), after the TOS modification by Set QoS policy.
Q: How does NetFlow determine the start and end of a TCP flow, and how does this process differ for UDP?
NetFlow defines a new flow as one that is not already in the flow cache. Thus, when a packet arrives and NetFlow determines it is not already represented in the NetFlow cache, a new flow cache entry is created. NetFlow will look for TCP FINs and RSTs as one of its techniques to expire flows. The process differs for UDP only in that flow aging is the only mechanism used to expire UDP flows.
Q: Does Cisco offer any applications for the collection and processing of NetFlow data export?
Yes, Cisco currently provides the NetFlow application. The Flow Collector application collects, filters, and aggregates NetFlow export data.
Q: What are the differences in traffic data collected between the existing IP accounting feature and NetFlow Export data?
NetFlow Export data provides time durations and absolute time stamps for each flow. This data is not available with IP accounting. NetFlow Export Data Export also provides application and protocol information for each flow.
Q: What happens if different packets in a flow have the Type of Service (TOS) field set to different values? Which TOS value gets stored for that particular flow?
Since TOS is part of the identifier for a flow, packets with different TOS values are treated as different flows.
Q: Give configuration example to configure Netflow for IPv6, MPLS, MPLS-IPv4 and MPLS-IPv6?
Refer to the example in section 2 to see the configuration of Exporter-Map and Sampler-Map.
The Following configuration collects IPv6 Payloads:
flow monitor-map fmm
record ipv6
cache permanent
!
interface GigabitEthernet0/0/0/1
flow ipv6 monitor fmm sampler fsm ingress
The Following configuration collects MPLS Payloads:
flow monitor-map fmm
record mpls labels 5
cache permanent
!
interface GigabitEthernet0/0/0/1
flow mpls monitor fmm sampler fsm ingress
The Following configuration collects MPLS-IPv4 Payloads:
flow monitor-map fmm
record mpls IPv4-fields labels 5
cache permanent
!
interface GigabitEthernet0/0/0/1
flow mpls monitor fmm sampler fsm ingress
The Following configuration collects MPLS-IPv6 Payloads:
flow monitor-map fmm
record mpls IPv6-fields labels 5
cache permanent
!
interface GigabitEthernet0/0/0/1
flow mpls monitor fmm sampler fsm ingress
For the questions that follow, assume the below topology and configuration

Figure 4 Configuration topology
Router:
flow exporter-map fem
version v9
!
dscp 40
transport udp 9002
source loopback0
destination 10.10.10.179 ----- this is the IP address of Netflow Collector
!
flow monitor-map fmm
record ipv4
exporter fem
cache entries 10000
cache timeout active 15
cache timeout inactive 5
!
sampler-map fsm
random 1 out-of 1
!
interface GigabitEthernet0/0/0/1
ipv4 address 13.0.0.1 255.255.255.0
flow ipv4 monitor fmm sampler fsm ingress
!
interface TenGigE0/1/0/0
ipv4 address 21.1.1.2 255.255.255.0
flow ipv4 monitor fmm sampler fsm ingress
The Traffic is ingressing to Te0/1/0/0 and Egressing from Gi0/0/0/1
Q: How to check flow exporter map configuration on a router.
RP/0/RSP0/CPU0:VKG-18#show flow exporter-map fem2
Mon Feb 22 14:55:09.988 UTC
Flow Exporter Map : fem2
-------------------------------------------------
Id : 3
DestinationIpAddr : 10.10.10.179
SourceIfName : Loopback0
SourceIpAddr : 21.0.0.2
DSCP : 40
TransportProtocol : UDP
TransportDestPort : 9002
Export Version: 9
Common Template Timeout : 1800 seconds
Options Template Timeout : 1800 seconds
Data Template Timeout : 1800 seconds
Interface-Table Export Timeout : 0 seconds
Sampler-Table Export Timeout : 0 seconds
RP/0/RSP0/CPU0:VKG-18#
Q: How to check flow monitor map configuration on a router.
RP/0/RSP0/CPU0:VKG-18#show flow monitor-map fmm
Mon Feb 22 14:56:52.504 UTC
Flow Monitor Map : fmm
-------------------------------------------------
Id: 3
RecordMapName: ipv4-raw
ExportMapName: fem
CacheAgingMode: Normal
CacheMaxEntries: 10000
CacheActiveTout: 15 seconds
CacheInactiveTout: 5 seconds
CacheUpdateTout: N/A
RP/0/RSP0/CPU0:VKG-18#
Q: How to check sampler map configuration on a router.
RP/0/RSP0/CPU0:VKG-18#show sampler-map fsm
Mon Feb 22 14:58:00.910 UTC
Sampler Map : fsm
-------------------------------------------------
Id: 2
Mode: Random (1 out of 1 Pkts)
RP/0/RSP0/CPU0:VKG-18#
Q: How to check the flows captured by Netflow ?
RP/0/RSP0/CPU0:VKG-18#show flow monitor fmm cache location 0/0/CPU0
Mon Feb 22 15:05:29.877 UTC
Cache summary for Flow Monitor fmm2:
Cache size: 10000
Current entries: 10
High Watermark: 9500
Flows added: 60644
Flows not added: 0
Ager Polls: 512914
- Active timeout 120
- Inactive timeout 60474
- TCP FIN flag 40
- Watermark aged 0
- Emergency aged 0
- Counter wrap aged 0
- Total 60634
Periodic export:
- Counter wrap 0
- TCP FIN flag 0
Flows exported 60634
IPV4SrcAddr IPV4DstAddr L4SrcPort L4DestPort BGPDstOrigAS BGPSrcOrigAS BGPNextHop IPV4DstPrfxLen IPV4SrcPrfxLen IPV4Prot IPV4TOS InputInterface OutputInterface L4TCPFlags ForwardStatus FirstSwitched LastSwitched ByteCount PacketCount Dir
51.0.0.6 61.0.0.6 4369 8738 201 101 13.0.0.2 24 24 tcp 0x20 Te0/1/0/0 0 U|A|P|R|S|F| Fwd 40 02:22:41:177 40 02:22:42:998 179706 183 Egr
51.0.0.3 61.0.0.3 4369 8738 201 101 13.0.0.2 24 24 tcp 0x20 Te0/1/0/0 0 U|A|P|R|S|F| Fwd 40 02:22:41:174 40 02:22:42:995 179706 183 Egr
51.0.0.8 61.0.0.8 4369 8738 201 101 13.0.0.2 24 24 tcp 0x20 Te0/1/0/0 0 U|A|P|R|S|F| Fwd 40 02:22:41:180 40 02:22:42:990 178724 182 Egr
51.0.0.7 61.0.0.7 4369 8738 201 101 13.0.0.2 24 24 tcp 0x20 Te0/1/0/0 0 U|A|P|R|S|F| Fwd 40 02:22:41:179 40 02:22:42:999 179706 183 Egr
51.0.0.2 61.0.0.2 4369 8738 201 101 13.0.0.2 24 24 tcp 0x20 Te0/1/0/0 0 U|A|P|R|S|F| Fwd 40 02:22:41:174 40 02:22:42:994 179706 183 Egr
51.0.0.11 61.0.0.11 4369 8738 201 101 13.0.0.2 24 24 tcp 0x20 Te0/1/0/0 0 U|A|P|R|S|F| Fwd 40 02:22:41:182 40 02:22:42:993 178724 182 Egr
51.0.0.9 61.0.0.9 4369 8738 201 101 13.0.0.2 24 24 tcp 0x20 Te0/1/0/0 0 U|A|P|R|S|F| Fwd 40 02:22:41:180 40 02:22:42:991 178724 182 Egr
51.0.0.5 61.0.0.5 4369 8738 201 101 13.0.0.2 24 24 tcp 0x20 Te0/1/0/0 0 U|A|P|R|S|F| Fwd 40 02:22:41:177 40 02:22:42:997 179706 183 Egr
51.0.0.10 61.0.0.10 4369 8738 201 101 13.0.0.2 24 24 tcp 0x20 Te0/1/0/0 0 U|A|P|R|S|F| Fwd 40 02:22:41:181 40 02:22:42:992 178724 182 Egr
51.0.0.4 61.0.0.4 4369 8738 201 101 13.0.0.2 24 24 tcp 0x20 Te0/1/0/0 0 U|A|P|R|S|F| Fwd 40 02:22:41:176 40 02:22:42:996 179706 183 Egr
Matching entries: 10
RP/0/RSP0/CPU0:VKG-18#
Q: How to check Netflow producer statistics?
Egress statistics for LC 0/0/CPU0:
------------------------------------------------
RP/0/RSP0/CPU0:VKG-18#show flow platform producer statistics location 0/0/CPU0
Mon Feb 22 15:10:32.167 UTC
Netflow Platform Producer Counters:
IPv4 Ingress Packets: 1
IPv4 Egress Packets: 10001
IPv6 Ingress Packets: 0
IPv6 Egress Packets: 0
MPLS Ingress Packets: 0
MPLS Egress Packets: 0
Drops (no space): 0
Drops (other): 0
Unknown Ingress Packets: 0
Unknown Egress Packets: 0
Worker waiting: 0
SPP Packets: 10002
Flow Packets: 10002
Flow Packets per SPP Frame: 1
Statistics last cleared: Mon Feb 22 15:10:08 2010
RP/0/RSP0/CPU0:VKG-18#
Ingress statistics for LC 0/1/CPU0:
------------------------------------------------
RP/0/RSP0/CPU0:VKG-18#show flow platform producer statistics location 0/1/CPU0
Mon Feb 22 15:15:07.845 UTC
Netflow Platform Producer Counters:
IPv4 Ingress Packets: 10000
IPv4 Egress Packets: 0
IPv6 Ingress Packets: 0
IPv6 Egress Packets: 0
MPLS Ingress Packets: 0
MPLS Egress Packets: 0
Drops (no space): 0
Drops (other): 0
Unknown Ingress Packets: 0
Unknown Egress Packets: 0
Worker waiting: 0
SPP Packets: 10000
Flow Packets: 10000
Flow Packets per SPP Frame: 1
Statistics last cleared: Mon Feb 22 15:14:43 2010
RP/0/RSP0/CPU0:VKG-18#
Q: How to check netflow exporter statistics?
RP/0/RSP0/CPU0:VKG-18#sh flow exporter fem location 0/0/CPU0
Mon Feb 22 15:17:27.301 UTC
Flow Exporter: fem
Flow Exporter memory usage: 3280812
Used by flow monitors: fmm
Status: Normal
Transport UDP
Destination 10.10.10.179 (9002)
Source 21.0.0.2 (5531)
Flows exported: 14 (770 bytes)
Flows dropped: 0 (0 bytes)
Templates exported: 0 (0 bytes)
Templates dropped: 0 (0 bytes)
Option data exported: 0 (0 bytes)
Option data dropped: 0 (0 bytes)
Option templates exported: 0 (0 bytes)
Option templates dropped: 0 (0 bytes)
Packets exported: 2 (780 bytes)
Packets dropped: 0 (0 bytes)
Total export over last interval of:
1 hour: 0 pkts
0 bytes
0 flows
1 minute: 2 pkts
780 bytes
14 flows
1 second: 0 pkts
0 bytes
0 flows
RP/0/RSP0/CPU0:VKG-18#
Q: How to check the policer rate configured on NPs?
RP/0/RSP0/CPU0:VKG-18#show flow platform nfea policer np 3 location 0/0/CPU0
Mon Feb 22 15:21:44.965 UTC
#ing_lnks #egr_lnks cur_rate policer_id root_hdl node_hdl chkpt_id
=================================================================
1 1 100000 476778 0xefaa24 0x7b 11928
RP/0/RSP0/CPU0:VKG-18#
Q: Any useful Debug/Trace commands that might come handy while debugging any Netflow related problems ?
show flow platform nfea ?
bundle Display bundle ctrl blk data structure
chkpt checkpoint information
interface Displays the Netflow information on this interface
policer Display policer related data structure
samp nfea Sampler List Information
sp Display sampling profile info
debug flow ?
ea Netflow EA debug information
ma Netflow MA debug information
mgr Netflow manager debug information
platform Netflow platform specific debug information
server Netflow server debug information
debug flow ea ?
error Error events
level Specify a verbosity level
location Specify a location
trace Trace function calls
<cr>
debug flow platform producer ?
error Turn on netflow producer errors
info Turn on informational debug on
level specify a verbosity level
location Specify a location
trace Turn on netflow producer trace
<cr>
show flow trace ?
all Include traces from all flow subsystems
ea Include traces from execution agent
ma Include traces from management agent
mgr Include traces from manager
platform Include traces from platform specific component
server Include traces from server
worker Include traces from the worker thread
To check
- If flow packets are generated and punted from forwarding plane to Host CPU;
- If correct flow types are punted in the configured directions;
- If there is any flow packet drops at nf_producer;
- The flow packet counts of each flow packet types in each directions,
Then use:
show flow platform producer statistics location <>
To check nfea PD level configuration info and setting, use:
show flow platform nfea ?
To capture error event during configuration, then use:
debug flow ea error location <>
To capture all ea & ma logs to correlate ma ••ó ea interactions that result in control plane & data plane structure programming:
NetFlow:
debug flow ea level 3 location <>
debug flow ma level 3 location <>
PRM: infrastructure to program h/w
debug prm traceback server location <>
debug prm traceback client location <>
debug prm client error location <>
To capture major nfea PD info during configuration, then use:
debug flow ea trace level 1 location <>
To capture complete nfea PD info during configuration, then use:
debug flow ea trace level 3 location <>
To retrieve past logged errors/events, then use:
show flow trace ea location <>
show flow trace platform producer location <>
5. Troubleshooting
When NetFlow is enabled on an interface, following programming takes place:
- uidb NetFlow flags get set (uidb is the ucode instance of a logical interface in control plane)
- Sampler gets programmed
- NetFlow punt table gets programmed
5.1 Uidb programming
When the packets enter the NetFlow enabled interface, the uidb flags tell the NP which type of traffic (IPv4 or IPv6 or MPLS) to be monitored. The following CLI displays the uidb NetFlow flags:
E.g., if ingress NetFlow is enabled for IPv4 traffic on tenGig 0/0/0/0:
sh uidb data location 0/0/CPU0 tenGigE 0/0/0/0 ingress | include NetFlow
IPV4 Netflow Enable 0x1
IPV6 Netflow Enable 0x0
MPLS Netflow Enable 0x0
* If these flags are not set, then something must have failed in the uidb programming and one needs to enable the full ea, ma & prm debugs described in the FAQ section above and study them to figure out the failure.
5.2 Sampler programming
When traffic is correctly monitored, the packets will be sampled based on the sampler programming which involves a key & a result:
Key has the following fields:
- uidb index (interface reference for which NetFlow is enabled)
- protocol (traffic type being monitored)
- direction (ingress or egress)
Result includes:
- sampling rate & mask
- window counter
For line cards Enhanced Ethernet LC & above the window counter is set to 0.
This programmed value can be viewed through the CLI:
Example: Enhanced Ethernet LC LC
#sh run int tenGigE 0/0/0/0
interface TenGigE0/0/0/0
flow ipv4 monitor v4-map sampler s-map ingress
flow ipv4 monitor v4-map sampler s-map egress
#sh run sampler-map
sampler-map s-map
random 1 out-of 100
#sh uidb index location 0/0/CPU0 tenGigE 0/0/0/0
-------------------------------------------------------------------------------------------------------
Location Interface-handle Interface-name Interface-Type Ingress-index Egress-index
-------------------------------------------------------------------------------------------------------
0/0/CPU0 0x000000c0 TenGigE0_0_0_0 Main interface 2 2
#sh control np struct NETFLOW det all interpret np0 lo 0/0/CPU0
Wed Apr 3 12:50:22.092 UTC
Node: 0/0/CPU0:
----------------------------------------------------------------
NP: 0
Struct 99: SNF_INFO_STR (maps to uCode Str=69)
Struct is a PHYSICAL entity
Reserved Entries: 0, Used Entries: 2, Max Entries: 16384
Entries Shown: 2
-------------------------------------------------------------
Entry 1: >>
KEY:020000 KEY SIZE:3
MASK:ffffff MASK SIZE:3
RESULT:190000000064007f205de80000000000 RESULT SIZE:16
Entry 2: >>
KEY:020004 KEY SIZE:3
MASK:ffffff MASK SIZE:3
RESULT:190000000064007f245de80000000000 RESULT SIZE:16
End NP Show Structure Display
Since, IPv4 ingress & egress netflow is enabled on the interface, two entries are used. The uidb index for the interface is 2 which is what displayed in the first 2 bytes of the KEY (little endian: 0200 => 00002 big-endian). Since, the following values are used for ingress dir=0 & egress dir=1 and IPv4 protocol ID=0, the KEYs are 020000 & 020004.
Ingress IPv4 in little endian format (020000):
0000 0010 0000 0000 (uidb index: 2 bytes)
0 (direction)
00 (protocol)
Engress IPv4 in little endian format (020004):
0000 0010 0000 0000 (uidb index: 2 bytes)
1 (direction)
00 (protocol)
The result structure has a lot of unused bytes (reserved, hence, uninitialized). The relevant fields are sampling rate & sampling mask, marked in italics & red. 0x64=100, which matches the sampling rate. 0x64 uses 7 bits and hence the mask is 0x7f.
5.3 NP counters for SNF (Sampled NetFlow)
Once a packet is decided to be sampled, it goes through several processing logic instructions inside the NP and at every meaningful stage a stat counter is incremented.
For example, for IPv4, the following counters are incremented:
*Note: At this point of time, we could have a missed to described a few NetFlow counters used in NP
Index | |||||
592 | STATS_STATIC_RESOLVE_SNF_SAMPLE_PKT | RSV_SNF_SAMPLE_PKT | Frames which are sampled by Netflow processing and punted to local LC CPU | ||
593 | STATS_STATIC_RESOLVE_SNF_IPV4 | RSV_SNF_IPV4 | Frames which are sampled by Netflow processing and send to 2nd pass processing for Source IP lookup. | ||
594 | STATS_STATIC_RESOLVE_SNF_ING_PUNT | RSV_SNF_ING_PUNT | Ingress frames which are sampled by Netflow processing | ||
595 | STATS_STATIC_RESOLVE_SNF_EGR_PUNT | RSV_SNF_EGR_PUNT | Egress frames which are sampled by Netflow processing | ||
1209 | STATS_STATIC_MODIFY_PUNT_NF_MSG | MDF_PUNT_NF_MSG | - | - | All NetFlow sampled packet to be looped back for src-ip lookup |
1210 | STATS_STATIC_MODIFY_PUNT_NF_IPV4 | MDF_PUNT_NF_IPV4 | - | - | All IPv4 NetFlow sampled packet to be looped back for src-ip lookup |
1212 | MODIFY_NF_PUNT_RFD_PREFETCH_FAIL | MDF_PUNT_NF_RFD_PREFETCH_FAIL |
Table 8 NP counters for NetFlow
For DBA:
Index | |||||
624 | STATS_STATIC_RESOLVE_DBA_FLOW_ADD | RSV_DBA_FLOW_ADD | DBA flow add request from Resolve to Learn in DBA ADD 2nd pass processing | ||
625 | STATS_STATIC_RESOLVE_DBA_FLOW_DEL | RSV_DBA_FLOW_DEL | DBA flow delete request from Resolve to Learn in DBA DEL 2nd pass processing | ||
626 | STATS_STATIC_RESOLVE_DBA_LEARN_LIMIT_REACHED | RSV_DBA_LEARN_LIMIT_REACHED | Indicates DBA flow table is full & we cannot add anymore flows | ||
627 | STATS_STATIC_LRN_DBA_SCAN_CNT | DBA_LRN_SCAN_MSG_CNT | DBA scan machine interrupt received | ||
628 | STATS_STATIC_LRN_DBA_FLOW_ADD_REQ | DBA_LRN_FLOW_ADD_REQ | DBA flow add request in Learn | ||
629 | STATS_STATIC_LRN_DBA_FLOW_ADD_CNT | DBA_LRN_FLOW_ADD_CNT | DBA flow add count in Learn | ||
630 | STATS_STATIC_LRN_DBA_IDX_Q_EMPTY_CNT | DBA_LRN_IDX_Q_EMPTY_CNT | DBA Learn counter indicating IDX_Q is empty | ||
631 | STATS_STATIC_LRN_DBA_ADD_ABORT_CNT | DBA_LRN_ADD_ABORT_CNT | DBA flow ADD aborted | ||
632 | STATS_STATIC_LRN_DBA_ADD_WAIT_4_IDX_Q_CNT | DBA_LRN_ADD_WAIT_4_IDX_Q_CNT | DBA Learn counter indicating a wait on IDX_Q to pickup stat-ptr | ||
633 | STATS_STATIC_LRN_DBA_ADD_FAIL_CNT | DBA_LRN_ADD_FAIL_CNT | DBA add failed in Learn | ||
634 | STATS_STATIC_LRN_DBA_FLOW_DEL_REQ | DBA_LRN_FLOW_DEL_REQ | DBA flow delete request count in Learn | ||
635 | STATS_STATIC_LRN_DBA_FLOW_DEL_CNT | DBA_LRN_FLOW_DEL_CNT | DBA flow delete count in Learn | ||
636 | STATS_STATIC_LRN_DBA_FLOW_DEL_FAIL_CNT | DBA_LRN_FLOW_DEL_FAIL_CNT | DBA delete failed in Learn | ||
637 | STATS_STATIC_DBA_LRN_MSG_Q_FULL_CNT | DBA_LRN_MSG_Q_FULL_CNT | Learn msg queue full for interrupt message generated by TOPlearn for Parse | ||
640 | STATS_STATIC_RESOLVE_DBA_FLOW_DEL_drop | RSV_DBA_FLOW_DEL_drop | Error counter indicating an attempt to delete a DBA flow that is non-existent. | ||
641 | STATS_STATIC_RESOLVE_DBA_NG_LEARN_CNT | RSV_DBA_NG_LEARN_CNT | Indicates non-guaranteed learn engine is not available to cater to add/del request generated by Resolve. In this case, ignore the add/del request in Resolve | ||
970 | STATS_STATIC_PUNT_DBA | PUNT_DBA | Destination based netflow packets punted | ||
971 | STATS_STATIC_PUNT_DBA_EXCD | PUNT_DBA_EXCD | Frames dropped (rather than punted for the reason above) due to policing | ||
Table 9 NP counters for DBA
5.4 Interface level counters
Following CLI is a well-known one to see the type of traffic crossing an interface:
show interface <int/f name> accounting rate
E.g.:
#sh int gigabitEthernet 0/4/3/2 a r
GigabitEthernet0/4/3/2
Ingress Egress
Protocol Bits/sec Pkts/sec Bits/sec Pkts/sec
IPV4_UNICAST 95095000 99073 95435000 99412
IPV4_MULTICAST 0 0 0 0
ARP 0 0 0 0
So, the above CLI confirms that IPv4 traffic is surely crossing the interface in both directions (note that the rate is also non-zero – hence the counters are not stale!). In this situation if IPv4 NetFlow is enabled on the interface, we should see relevant NP counters incrementing in the previous section. If that’s not happening, one should see if there are packet drop counters going up in relevant NP owning the interface. *Note that for virtual interfaces like bundles, pw-ether or BVI, there could be many NPs hosting the actual physical members.
One should also issue CLIs in sections 5.1 & 5.2 to verify that the netflow programming is done as expected. If an issue is seen there, one should do further debugging by executing the debug CLI described before (in FAQ) and identify potential failures in logs/traces.
5.5 Punt table programming for NetFlow
Once packets are sampled, the NetFlow records are punted to LC CPU. There are many protocols and features that require packets to be punted to LC CPU. Since, the punt bandwidth from NP to LC CPU is limited and all features need to share this b/w. To guard a feature from using up all the b/w its punt traffic is policed based on pre-allocated b/w and dynamically calculated policer rates.
Following CLI are useful when debugging the punt path related issues:
#sh flow platform nfea policer np 0 location 0/0/cPU0
Wed Apr 3 13:40:08.015 UTC
#ing_lnks #egr_lnks cur_rate policer_id root_hdl node_hdl chkpt_id
=================================================================
1 1 200000 14876783 0xedef80 0x6f 12248
There is only one interface on the Enhanced Ethernet LC NP that’s netflow configured. Hence, this NP uses all the available b/w of 200000pps. The poicer ID for this is 14876783 or 0x e3006f . This is the information stored in the control plane.
#sh control np struct punt sear key 53 interpret np0 location 0/0/CPU0
Wed Apr 3 13:23:42.030 UTC
Node: 0/0/CPU0:
----------------------------------------------------------------
NP: 0
Struct 31: PUNT_REASON
Struct is a PHYSICAL entity
Reserved Entries: 0, Used Entries: 113, Max Entries: 256
Matching Entries: 1
-------------------------------------------------------------
Entry 1: >> KEY SIZE:1 KEY:53
MASK SIZE:1 MASK:ff
RESULT SIZE: 32 RESULT: 11680000 6f00e300 22000000 a8030032 08000a00 00000000 00000000 00000000
DECODE >>
is bfd : 0 slow policer: 0 rmt rack : 0
match : 0 valid : 1 local : 1
action : 2 cos : 4 check ttl : 0
min-ttl : 0 search ctrl : 0 listener tag: 0
policer id: e3006f TM QID : 22 stats ptr : 3a8
SID : 50 cpu mac lsb : 10 c3-hdr-ver : 0
fab-mcast : 0 vqi_or_fgid : 8 host port : 0
rack-id : 0 rmt slot idx: 0 flowtrap id : 0
is ptp : 0 bfd-tbl-lkup: 0 bfd-tbl-id : 0
This CLI dumps the netflow punt path policer programming. This is the information stored in the data plane (h/w). The policer IDs in CP & DP match (0xe3006f ). The NetFLow punt table KEY is 83 or 0x53. The stream ID used for NetFlow traffic that traverses the SPP/SPIO interface is 50. This info can be confirmed through the following CLI:
#sh spp sid table location 0/0/cPU0 | inc NETFLOW
Wed Apr 3 16:28:10.316 UTC
SID Stream-Name Traced Punt-Key Action/Disp Next-node Client Name
50 NETFLOW (N) 0x02000032 Spio_Default ASR9K SPIO client stream ID 50
The following CLI also shows useful information about Punt/Inject stats across SPP:
show spp sid stats location 0/0/cPU0
In general, ‘show spp ….” Is a useful CLI to debug SPP related data.
E.g.:
#sh spp client punt status location 0/0/CPU0
Wed Apr 3 16:36:49.934 UTC
Clients
=======
ASR9K SPIO client stream ID 50, JID 273
Punt Queue key 0x02000032
0 messages sent, 0 dropped, 0 on queue
SPP last pulsed at Never
Pulse last delivered at Never
Message last read at Never
Pulse retries succeeded after error: 0
Pulse retries failed after error: 0
Retry attempts for current pulse: 0
#sh spp client detail location 0/0/CPU0
Wed Apr 3 16:38:23.663 UTC
Client connections allowed: 1
Ctx allocator: 65536 items 58944 free 0 shortages
SPP Queues
==========
Main input queue at 0x0x7c575540
Persistent: F, Mutex: T, Pulse: T, Blocking: T Invalid: F
Head 409, Tail 409, Coalesced 0
Cur 0, Max 2048, Enqueues 35225, High WM: 2 (07:46:27.845 Mar 23 13 UTC) Drops: 0
elsize 4 coid 8 pid 45085 pulse_code 124 pulse_value 0 prio 10
Clients
=======
ASR9K SPIO client stream ID 50, JID 273 (pid 512166)
----------------------------------------------------------
Reconnect Pending: F, Exited: F, Keep Queues: F, Pakman Client: F
Quota:
Current: 0, Limit: 20000, Available: 0, Enqueued: 0, Drops 0
Queues:
Control Queue at 0x0x8a1ca140
Punt SF: nused 0, is not scheduled
Persistent: F, Mutex: T, Pulse: T, Blocking: F Invalid: F
Head 0, Tail 0, Coalesced 0
Cur 0, Max 10, Enqueues 0, High WM: 0 (15:15:49.202 Mar 22 13 UTC) Drops: 0
elsize 4 coid 0 pid 512166 pulse_code 0 pulse_value 0 prio 10
Punt Queue key 0x02000032 at 0x0x8a50b020
Punt SF: nused 0, is not scheduled
Persistent: F, Mutex: T, Pulse: T, Blocking: F Invalid: F
Head 0, Tail 0, Coalesced 0
Cur 0, Max 4096, Enqueues 0, High WM: 0 (15:15:49.206 Mar 22 13 UTC) Drops: 0
elsize 4 coid 0 pid 512166 pulse_code 0 pulse_value 0 prio 10
5.6 Control plane debugging
Control plane debugging, including about NetFlow record export path, is covered in detail in FAQ section. If records are not reaching the collector, please examine the exporter map configuration and make sure that the collector IP address is reachable and that there are no drops in that path. This debugging would become part of usual forwarding + NETIO path debugging which is outside the scope of this document.
5.7 ABF on NetFlow enabled interfaces
If ABF is configured on the traffic coming from/to src/dst prefixes - it leads to hitting the results that would not have BGP NextHop programmed (if ABF were not configured, a recursive leaf would result where we have the BGP NH programmed). Due to this the BGP NH displayed in the NetFlow records, the AS#s
and even the output interface all could be different from what is seen in the CEF CLI output, most of the times ZERO.
*This is an example from “CSCud86509 Netflow BGPNextHop is 0.0.0.0”
(IP addresses changed for obvious reasons here …)
Consider the entry with dest-ip as 12.34.56.57 =>
RP/0/RSP0/CPU0:hh-flug-rt-bpop-1#sh flow monitor v4_monitor cache loc 0/0/cpu0
IPV4SrcAddr IPV4DstAddr L4SrcPort L4DestPort BGPDstOrigAS
BGPSrcOrigAS BGPNextHopV4 IPV4DstPrfxLen IPV4SrcPrfxLen IPV4Prot IPV4TOS
InputInterface OutputInterface L4TCPFlags ForwardStatus
FirstSwitched LastSwitched ByteCount PacketCount Dir SamplerID
11.252.16.194 22.17.251.155 80 49710 0 34011
0.0.0.0 32 20 tcp 0
Te0/1/0/10 Te0/0/0/5 A| Fwd 41
13:43:22:773 41 13:43:22:773 1500 1 Ing 1
111.122.134.237 222.19.234.151 20030 3074 0 3356
0.0.0.0 32 18 udp 0 Te0/1/0/1
Te0/1/0/5 0 Fwd 41 13:43:25:193 41
13:43:25:193 716 1 Ing 1
1.92.71.174 1.7.209.11 51406 18630 0 0
0.0.0.0 32 19 udp 0xb8
Te0/1/0/23 Te0/0/0/0 0 Fwd 41
13:42:09:598 41 13:43:29:738 2400 12 Ing 1
56.78.90.249 12.34.56.57 49643 80 0 0
0.0.0.0 32 22 tcp 0
Te0/1/0/21 Te0/1/0/4 A| Fwd 41
13:43:27:820 41 13:43:27:820 40 1 Ing 1
=========
The CEF output shows that this IP is reachable through a recursive path with BGP NextHop properly programmed in the h/w.
RP/0/RSP0/CPU0:hh-flug-rt-bpop-1#sh cef 12.34.56.57 hardware egr detail lo 0/1/CPU0
Tue Feb 19 17:14:24.138 CET
12.34.56.0/24, version 55579622, internal 0x14000001 (ptr 0x964321d4) [1], 0x0
(0x0), 0x0 (0x0)
Updated Feb 12 09:06:48.506
Prefix Len 24, traffic index 0, precedence routine (0), priority 4
BGP Attribute: id: 0x6e28, Local id: 0x7f73, Origin AS: 20940, Next Hop AS: 20940
gateway array (0x8d4acab0) reference count 259984, flags 0x8020, source rib
(5), 0 backups
[1 type 3 flags 0x80111 (0x8d5e2f78) ext 0x0 (0x0)]
LW-LDI[type=0, refc=0, ptr=0x0, sh-ldi=0x0]
Level 1 - Load distribution: 0
[0] via 23.45.67.53, recursive
via 23.45.67.53, 3 dependencies, recursive [flags 0x6000]
path-idx 0 [0x8ea56940 0x0]
next hop 23.45.67.53 via 23.45.67.53/32
Load distribution: 0 1 2 3 4 5 (refcount 1)
Hash OK Interface Address
0 Y TenGigE0/0/0/0 remote
1 Y TenGigE0/0/0/1 remote
2 Y TenGigE0/0/0/10 remote
3 Y TenGigE0/1/0/0 34.56.203.33
4 Y TenGigE0/1/0/1 34.56.203.37
5 Y TenGigE0/1/0/10 34.56.203.45
LEAF - HAL pd context :
sub-type : IPV4, ecd_marked:0, has_collapsed_ldi:0, collapse_bwalk_required:0,
ecdv2_marked:0
Leaf H/W Result:
Physical Result: 0x11c4cf05 (LE)
Raw Data0: 0x51920000 00000000 00000000 00000000
Raw Data1: 0x5c040000 000007f7 30180000 0000a2ff
leaf_resolve_control_byte0
reserved: 0 match: 1
valid: 1
ifib_lookup: 0
txadj_internal: 0
rec_fs: 1
leaf_resolve_control_byte1
fwd: 1 default_rte: 0
dc_rte: 0
recursive_leaf: 1 fast_switch: 0
igp_pref: 0 recursive: 1
non_recursive: 0
leaf_resolve_control_byte2
reserved: 0 bgp_pa_valid: 0
fast_switch: 0
rx_adj_null0: 0
rp_destined: 0
rx_punt: 0
rx_drop: 0
ecmp_size: 0
recursive_fwd_entry
ldi_ptr: 0x5c0400 (LE)
LSP Array union:
BGP Output label:
label_msb[0]: 0 label_lsb[0]: 0
exp[0]: 0 eos[0]: 0
label_msb[1]: 0 label_lsb[1]: 0
exp[1]: 0 eos[1]: 0
label_msb[2]: 0 label_lsb[2]: 0
exp[2]: 0 eos[2]: 0
label_msb[3]: 0 label_lsb[3]: 0
exp[3]: 0 eos[3]: 0
lsp_array_ptr: 0x0
bgp_policy_accounting: 0
as_number: 7f73
prefix_length: 18
ecmp_stats_base: a2ff
QPPB Prec: 0 QPPB Prec_valid: 0
QPPB QOS Group: 0 QPPB QOS Group_valid: 0
REC-SHLDI HAL PD context :
collapse_bwalk_required:0, load_shared_lb:0
rLDI eng ctx:
flags: 0x1, rldi_table_idx: 0x45c, num_entries: 0x1, urpf_ptr: 0x0
rLDI HW data for path 0 [index: 0x45c (BE)] (common to all NPs):
Raw Data0: 0x11044004 9a050000 53a9b735 00000000
ldi_resolve_control_byte0:
match: 1 valid: 1
ldi_resolve_control_byte1:
ext_lspa: 0 leaf_ip: 1
leaf_mpls: 0
ldi_resolve_control_byte2:
first_rldi: 1
label_offset: 4
label_block_offset: 0
Other fields:
leaf_ptr: 0x9a0500(LE) bgp_next_hop: 0x53a9b735
urpf_ptr: 0
NextHopPrefix:23.45.67.53/32
Please use show cef or show mpls forwarding command again
with nexthop prefix specified for nexthop hardware details
As per CEF, the exact route that should be taken for this dest-IP by traffic from 56.78.90.249 is via TenGigE0/1/0/1:
RP/0/RSP0/CPU0:hh-flug-rt-bpop-1#sh cef exact-route 56.78.90.249 12.34.56.57 hardware egress detail location 0/1/CPU0
Tue Feb 19 17:24:35.301 CET
12.34.56.0/24, version 55579622, internal 0x14000001 (ptr 0x964321d4) [1], 0x0
(0x0), 0x0 (0x0)
Updated Feb 12 09:06:48.507
local adjacency 34.56.203.37
Prefix Len 24, traffic index 0, precedence routine (0), priority 4
BGP Attribute: id: 0x6e28, Local id: 0x7f73, Origin AS: 20940, Next Hop AS: 20940
via TenGigE0/1/0/1
via 23.45.67.53, 3 dependencies, recursive [flags 0x6000]
path-idx 0 [0x8ea56940 0x0]
next hop 23.45.67.53 via 23.45.67.53/32
However, this traffic enters through the interface TenGigE0/1/0/21. TenGigE0/1/0/21 has "ipv4 access-group SCE-Subscriber-Side ingress" configured.
*The forwarding policy in access-group SCE-Subscriber-Side overrides any CEF programming we have seen above.
This access group has the following ABF entry:
60750 permit ipv4 56.78.90.0 0.0.3.255 any nexthop1 ipv4 34.56.204.193
That means, the packets are forced to go via 34.56.204.193!! This is reachable
through TenGigE0/1/0/4. No recursive IP lookups happen in the forwarding path.
The nexthop to reach 12.34.56.57 would simply be 34.56.204.193. Since, there
is no recursive LDI in lookup results, the BGP nexhop would remain 0.0.0.0.
The AS#s also will not be as expected from the CEF programming seen above. Output interface also will be the forced one, which is TenGigE0/1/0/4, instead of TenGigE0/1/0/1 seen in CEF programmed output above.
To conclude, the netflow records show the output as expected!
6. Caveats
- CSCtb32287 Netflow: "show flow exporter <>" enhancement for unsupported fields for SIP700 based LCs
- L3VPN deaggregation context: For per-CE & per-prefix labeling, egress source AS# is not reported for egress IPv4/v6 NetFlow. This is because, the lookup happens on VPN label resulting in a label leaf which does not have AS# info. For per-VRF labeling this caveat is not there as the lookup happens on IP address.
- CSCuf86015(CSC.ena,upd,hassans)Source AS missing in ingress IPv6 Netflow Report
In 4.3.1, BGPv6 attribute reporting does not work when eBGP peering on CE happens with directly connected interface address of the CE router. This is because, eBGP on CE reports the nexthop prefixes to be reachable by link local address of the interface and hence, PE router FIB programs the eBGP prefixes as directly reachable. The BGP attributes won’t be available in direct-reach structures of the h/w.
- PW-Ether type interfaces: The NetFlow punt b/w (e.g., 200Kpps for Enhanced Ethernet LC) is shared equally among all the NPs of the LC even if only one NP has a member physical interface that is netflow enabled.
- BVI: It’s a global virtual interface. Hence, LC punt b/w is equally shared by all NPs on each supporting LC (Enhanced Ethernet LC and later LCs).
7. Glossary
NFC - Netflow Collector
NFEA – NetFlow Execution Agent
NFMA – NetFlow Management Agent
Nfsvr – NetFlow Server
Nfmgr – NetFlow Manager
Fem – flow exporter map
Fmm – flow monitor map
Fsm – Sampler Map
DBA – Destination Based Accounting
- Mark as Read
- Mark as New
- Bookmark
- Permalink
- Report Inappropriate Content
Would be nice to see support for L2 interfaces (EFPs) in the future, as the platform is supposed to be a Carrier Ethernet platform...
- Mark as Read
- Mark as New
- Bookmark
- Permalink
- Report Inappropriate Content
Hi Babu how are you... I have a question.. I need to send Deepfield the information of which rate of sampling is configured in the router 9K...
Could you tell me the configuration CLI to do that?
Best regards
Javier
- Mark as Read
- Mark as New
- Bookmark
- Permalink
- Report Inappropriate Content
Javier,
You can see that if you do show run | in random or show sampler-map <name of the sampler>
Eddie.
Find answers to your questions by entering keywords or phrases in the Search bar above. New here? Use these resources to familiarize yourself with the community: