Basic debugging
All XRv9k datapath commands for clear/show/debug are available under the following CLI set:
show controller dpa ...
debug controller dpa ...
clear controller dpa ...
Datapath Architecture
The control and dataplanes are separated into distinct linux containers.
The dataplane is a part of the Universal Virtual Forwarder (UVF) container. Its composed of two parts:
1. DataPath Agent (DPA) that communicates with a controller in the XR container to get the route/feature configuration that gets programmed into the datapath.
2. The datapath forwarding code which is comprised of DPDK (Intel's DataPath Dev Kit), VPP (infra code) and the XRv9k dataplane code.
The Punt/Inject packets travel from the SPP to the DPA.
![]()
![]() Show commands for VPP Graph Nodes
Show commands for VPP Graph Nodes
There are many VPP graph nodes under the RX, FWD, TM, TX and DPA blocks. A node processes a frame of packets (upto 256 packets) using batch processing. Batch processing gives cache efficiency gains. The infra (VPP) code is always running in the background even if there are no packets to process, therefore the CPUs will always run at 100%. This is by design.
VPP graph node show commands
show controller dpa graph ...
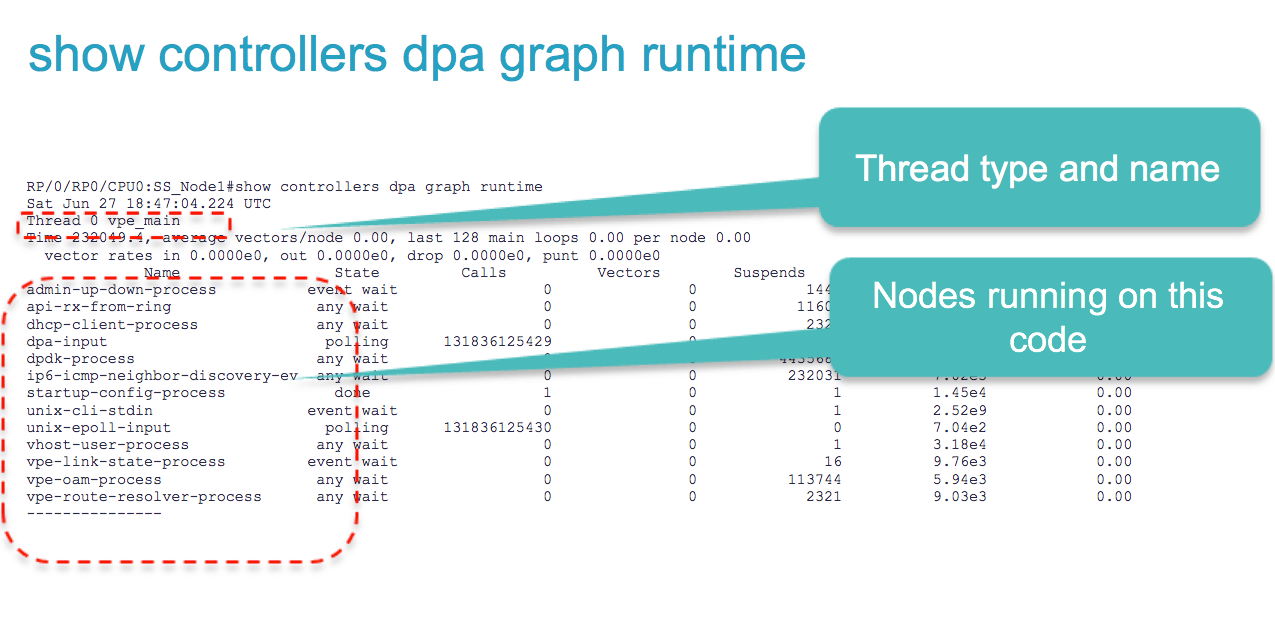
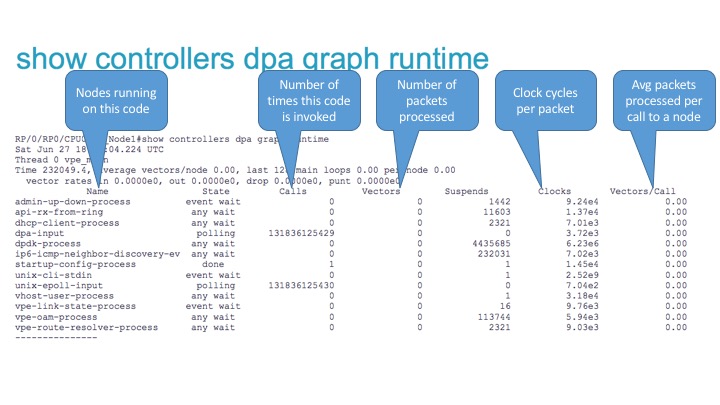
The running state of the VPP graph nodes is displayed by
show controller dpa graph runtime
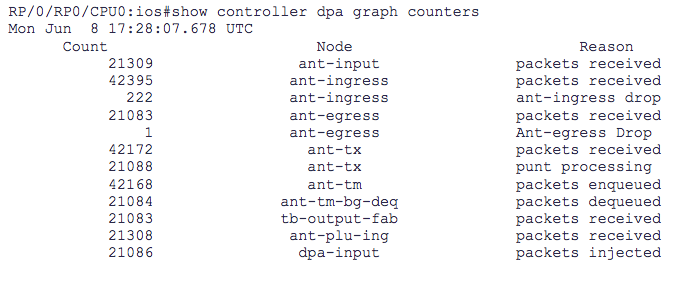
Per node counters are displayed with
show controller dpa graph counters
Inter-core frame queues are displayed with
show controller dpa graph frame-queue
Examples


Punt/Inject Packet Path
Use the following CLI to troubleshoot the punt/inject packet path:
- show spp sid [table|stats|node-counters|client]
- show netio forwarder stats
- show lpts pifib hardware entry [stat|brief|policer|context info]
- show lpts pifib stat
Packet Tracing
Packets arriving from the line or inject packets may be traced as follows:
- debug controllers dpa packet-trace [line|inject] <# to trace>
- show controllers dpa packet-trace
- clear controllers dpa packet-trace