- Cisco Community
- Technology and Support
- Networking
- Network Management
- DFM Ethernet Utilization Thresholds in LMS 4.0.1
- Subscribe to RSS Feed
- Mark Topic as New
- Mark Topic as Read
- Float this Topic for Current User
- Bookmark
- Subscribe
- Mute
- Printer Friendly Page
DFM Ethernet Utilization Thresholds in LMS 4.0.1


- Mark as New
- Bookmark
- Subscribe
- Mute
- Subscribe to RSS Feed
- Permalink
- Report Inappropriate Content
08-19-2011 12:46 PM
I've looked at a couple of thread regarding setting DFM thresholds to be other than the default 40%. (for instance, https://supportforums.cisco.com/message/3346767#3346767 ).
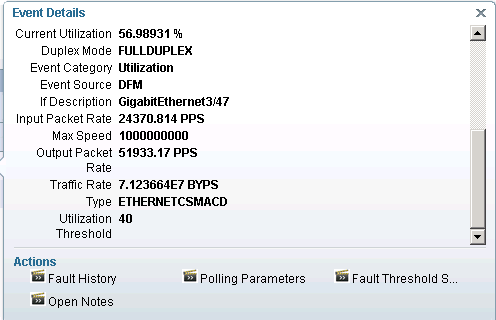
However, even after going into "Monitor, Fault Settings, Setup, Threshold Settings" and choosing DFM, System Defined Groups and changing the threshold for every instance of 1 GB Ethernet I could find (under Access Port, Interface and Trunk Port groups) LMS insists on generating DFM alerts for utilization exceeding the default 40% threshold. (And yes I did click on "Apply changes".)
Example below. What am I missing? (I looked for but cannot find any setting for ETHERNETCSMACD.)
- Labels:
-
Network Management


- Mark as New
- Bookmark
- Subscribe
- Mute
- Subscribe to RSS Feed
- Permalink
- Report Inappropriate Content
08-20-2011 02:53 PM
Check to see if you have any customizable groups (interface, trunk, or access port) that could be matching these ports. If so, then it is that group's thresholds that need to be modified.
- Mark as New
- Bookmark
- Subscribe
- Mute
- Subscribe to RSS Feed
- Permalink
- Report Inappropriate Content
08-20-2011 03:10 PM
I don't see any groups other than the default system-defined ones I mentioned. That's the only place I see any reference to port utilization.

- Mark as New
- Bookmark
- Subscribe
- Mute
- Subscribe to RSS Feed
- Permalink
- Report Inappropriate Content
08-20-2011 04:12 PM
If you click the View button next to each group, then click the "View ..." link in the resulting window you can hunt down the port in question and double-check that the threshold settings are correct for that group.
- Mark as New
- Bookmark
- Subscribe
- Mute
- Subscribe to RSS Feed
- Permalink
- Report Inappropriate Content
08-20-2011 05:22 PM
Drilling down as you suggested shows that CiscoWorks believes "The selected group has no devices." (for all three DFM groups with 1 Gb Ethernet interfaces).

When I go in via Fault device details and drill down on a device interface (port) which is reporting high utilization, it shows as type ETHERNETCSMACD but I can't find any DFM settings for that type ID.

- Mark as New
- Bookmark
- Subscribe
- Mute
- Subscribe to RSS Feed
- Permalink
- Report Inappropriate Content
08-20-2011 06:34 PM
On the CLI, run:
NMSROOT/objects/smarts/bin/dmctl -s DFM
From the dmctl prompt, type:
get Port::PORT-sw-hq0042-m03-3.sea.net.real.com/1.52
What output do you get?
- Mark as New
- Bookmark
- Subscribe
- Mute
- Subscribe to RSS Feed
- Permalink
- Report Inappropriate Content
08-20-2011 06:52 PM

- Mark as New
- Bookmark
- Subscribe
- Mute
- Subscribe to RSS Feed
- Permalink
- Report Inappropriate Content
08-20-2011 07:29 PM
Get the output of:
get Ethernet_Performance_Setting::"SET-CFG-Port Groups - Trunk Ports//DFM@CiscoWorks/System Defined Groups/Trunk Port Groups/1 GB Ethernet/Ethernet_Performance_Setting"
- Mark as New
- Bookmark
- Subscribe
- Mute
- Subscribe to RSS Feed
- Permalink
- Report Inappropriate Content
08-20-2011 07:38 PM
Here you go. I see that unwanted "40" in there, contrary to what the GUI reports. Could it be a bug?
BTW I am running 4.0.1 with all available package updates applied.
dmctl> get Ethernet_Performance_Setting::"SET-CFG-Port Groups - Trunk Ports//DFM
@CiscoWorks/System Defined Groups/Trunk Port Groups/1 GB Ethernet/Ethernet_Perfo
rmance_Setting"
Properties of Ethernet_Performance_Setting::SET-CFG-Port Groups - Trunk Ports//D
FM@CiscoWorks/System Defined Groups/Trunk Port Groups/1 GB Ethernet/Ethernet_Per
formance_Setting:
AnalysisModeOfSubInterfacePerformance = ENABLED
BroadcastThreshold = 15
CollisionThreshold = 10
CreationClassName = Ethernet_Performance_Setting
Description =
DiscardThreshold = 5
DisplayName = Ethernet Interface/Port Performance
ErrorThreshold = 10
ErrorTrafficThreshold = 2
IsEnabled = TRUE
Name = SET-CFG-Port Groups - Trunk Ports//D
FM@CiscoWorks/System Defined Groups/Trunk Port Groups/1 GB Ethernet/Ethernet_Per
formance_Setting
PartOf = { Configuration::CFG-Port Groups - T
runk Ports//DFM@CiscoWorks/System Defined Groups/Trunk Port Groups/1 GB Ethernet
}
QueueDropThreshold = 1
ServiceName =
SettingFeature =
SettingKey = Network Adapter Performance
TargetClass = ICIM_NetworkAdapter
Type = THRESHOLD
UtilizationThreshold = 40
dmctl>
- Mark as New
- Bookmark
- Subscribe
- Mute
- Subscribe to RSS Feed
- Permalink
- Report Inappropriate Content
08-20-2011 08:30 PM
This would appear that you have not properly applied the changes down to the DfmServer. Try applying the changes again.
- Mark as New
- Bookmark
- Subscribe
- Mute
- Subscribe to RSS Feed
- Permalink
- Report Inappropriate Content
08-20-2011 09:49 PM
I changed the settings (once again) for "DFM/System Defined Groups/Trunk Port Groups/1 GB Ethernet" to 75%. Clicked Save, OK, then Apply. System chews on that a minute and then reports changes applied. The dmctl get command above still reports the 40% setting.
Perhaps I should just open a TAC case and they can webex and/or debug. I thought I was missing some non-obvious (or obvious) step but it appears not.


dmctl> get Ethernet_Performance_Setting::"SET-CFG-Port Groups - Trunk Ports//DFM
@CiscoWorks/System Defined Groups/Trunk Port Groups/1 GB Ethernet/Ethernet_Perfo
rmance_Setting"
Properties of Ethernet_Performance_Setting::SET-CFG-Port Groups - Trunk Ports//D
FM@CiscoWorks/System Defined Groups/Trunk Port Groups/1 GB Ethernet/Ethernet_Per
formance_Setting:
AnalysisModeOfSubInterfacePerformance = ENABLED
BroadcastThreshold = 15
CollisionThreshold = 10
CreationClassName = Ethernet_Performance_Setting
Description =
DiscardThreshold = 5
DisplayName = Ethernet Interface/Port Performance
ErrorThreshold = 10
ErrorTrafficThreshold = 2
IsEnabled = TRUE
Name = SET-CFG-Port Groups - Trunk Ports//D
FM@CiscoWorks/System Defined Groups/Trunk Port Groups/1 GB Ethernet/Ethernet_Per
formance_Setting
PartOf = { Configuration::CFG-Port Groups - T
runk Ports//DFM@CiscoWorks/System Defined Groups/Trunk Port Groups/1 GB Ethernet
}
QueueDropThreshold = 1
ServiceName =
SettingFeature =
SettingKey = Network Adapter Performance
TargetClass = ICIM_NetworkAdapter
Type = THRESHOLD
UtilizationThreshold = 40
dmctl>
- Mark as New
- Bookmark
- Subscribe
- Mute
- Subscribe to RSS Feed
- Permalink
- Report Inappropriate Content
08-20-2011 09:55 PM
What you might try first is to shutdown Daemon Manager then kill off any remaining sm_server processes. Restart, and try to change your threshold settings again.
- Mark as New
- Bookmark
- Subscribe
- Mute
- Subscribe to RSS Feed
- Permalink
- Report Inappropriate Content
08-22-2011 08:24 AM
I tried the Daemon Manager shutdown. That is itself properly shutdown sm_server. Follwiing a restart (and server ready), I once again changed and re-applied the threshold setting. Same results.
I've opened a TAC case (618804161) and will advise on the outcome.
- Mark as New
- Bookmark
- Subscribe
- Mute
- Subscribe to RSS Feed
- Permalink
- Report Inappropriate Content
08-27-2011 08:00 AM
TAC had to escalate to Development Engineering. It turned out to be a corrupted couple of files (dfm.rps and dfm1.rps) that govern the behavior of fault management.
Removing those file and then rediscovering everything in DFM (Admin, Collection Settings, Fault, Fault Monitoring Device Administration) cleared up the issue.
Unfortunately, it will also remove any custom settings you had applied to devices (e.g., unmanage certain unreachable IPs) so some rework may be necessary after doing that.

- Mark as New
- Bookmark
- Subscribe
- Mute
- Subscribe to RSS Feed
- Permalink
- Report Inappropriate Content
08-28-2011 05:44 AM
Would be nice to know what caused the corruption. I have a similar issue at 2 customer sites.
250 and 850 devices to rediscover + stop DFM giving bogus alerts for the PRI's on the voice gateways and who knows how many interfaces that are just admin up but have nothing connected.
Normally this info should be kept when I do an getIP and getPortInterface in DFM utils.Lets hope for the best.
Cheers,
Michel

Discover and save your favorite ideas. Come back to expert answers, step-by-step guides, recent topics, and more.
New here? Get started with these tips. How to use Community New member guide