- Cisco Community
- Technology and Support
- Data Center and Cloud
- Data Center and Cloud Knowledge Base
- How to Read UCS B-Series Tech-Support Files - UCSM Detail
- Subscribe to RSS Feed
- Mark as New
- Mark as Read
- Bookmark
- Subscribe
- Printer Friendly Page
- Report Inappropriate Content
- Subscribe to RSS Feed
- Mark as New
- Mark as Read
- Bookmark
- Subscribe
- Printer Friendly Page
- Report Inappropriate Content
06-23-2011 06:02 AM - edited 03-01-2019 05:53 AM
- Introduction
- UCS B-Series Tech-Support Files: Overview
- Collecting a tech-support: CLI
- Collecting a tech-support: GUI
- Reading Through the UCSM Tech-Support
- Related Information
Introduction
The purpose of this document is to help you in collecting and understanding tech support log file bundle for the UCS system. UCS system has lots of components in it, i.e Blade server, Rack server, Fabric Extender, Fabric Interconnect. All these are managed by the UCS manager.
UCS B-Series Tech-Support Files: Overview
You will probably be asked to provide a tech-support file from your UCS system by Cisco TAC at one point or another. Tech-support files are extremely useful in troubleshooting a wide array of issues in a UCS environment. There are several different types of tech-support files that can be collected depending on which scope of the system needs investigation. The available options for collecting a tech-support file include: UCSM, chassis, fex, and server. More detailed options can be specified for the 4 options listed above as well. First, let's review how to collect a tech-support file.
Collecting a tech-support: CLI
In versions prior to 1.4(x), the only way to collect a tech-support was via the command line. The following commands illustrate how to grab a UCSM and chassis tech-support from a system:
Cisco-UCS-A# connect local-mgmt
Cisco-UCS-A(local-mgmt)# show tech-support ucsm detail
Cisco-UCS-A(local-mgmt)# show tech-support chassis 1 all detail
After executing each of the commands above, the system will complete a series of steps, which involve collecting and packaging up the relevant logs for the specific tech-support file that is being collected. Once it is complete, you will be left with a .tar file, stored in the workspace: partition, in the 'techsupport' folder:
"The detailed tech-support information is located at workspace:///techsupport/20110623125812_F340-31-11-UCS-01-B_UCSM.tar"
The following four protocols can be used in order to collect the files off of the system and send them over to Cisco TAC: FTP, SFTP, TFTP, or SCP.
The copy command is used in order to send the file from your UCS system to your local file server. In the below example, the file will be sent to a server that supports FTP transfers:
Cisco-UCS-A(local-mgmt)# copy workspace:/techsupport/20110623125812_F40-31-11-UCS-01-B_UCSM.tar ftp:
After the above command is executed, the user will be prompted to specify credential and IP address/hostname information for the remote server. The file can then be emailed to the TAC engineer, or uploaded via the File Upload Tool, built into Cisco's Service Request Tool: www.cisco.com/techsupport/servicerequest/
Collecting a tech-support: GUI
In UCS firmware versions 1.4(x) and greater, tech-support files can be downloaded from the GUI directly to a user's local machine.
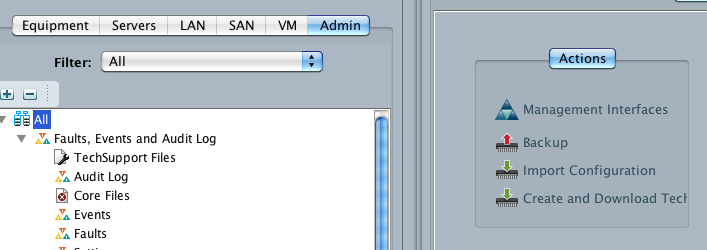
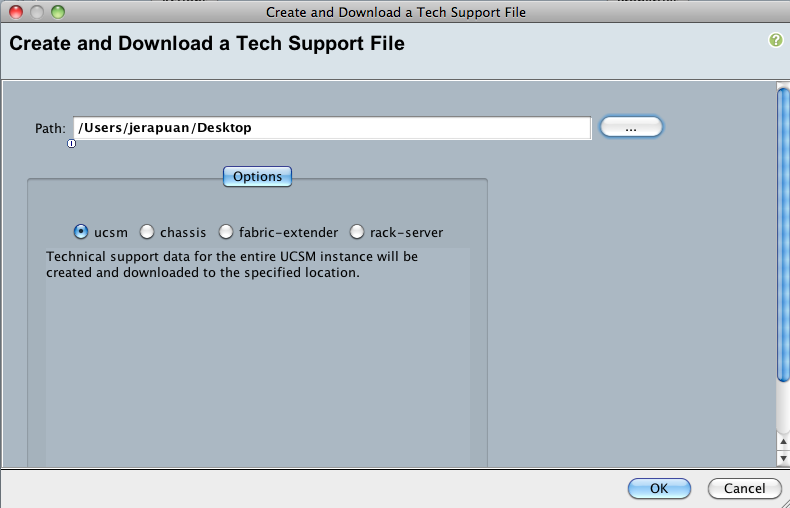
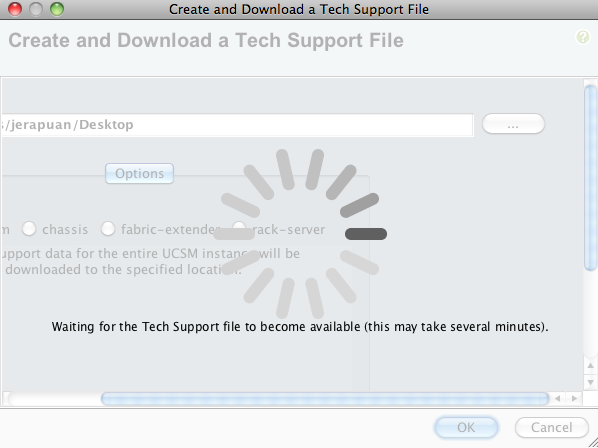
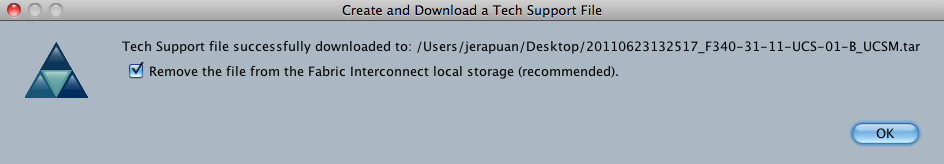
After logging into the UCSM web interface, you can navigate to the Admin tab, select 'All' from the tree structure on the left hand side, and then click on the 'Create and Download a Tech Support File' link on the right hand side in the Actions box. The button containing 3 periods on the right hand side can be used to browse to a specific location on the local machine. The radio buttons in the Options section are used to specify which component the tech-support should be generated for. The system will provide notification once the tech-support file has been successfully generated and copied to the local machine.
Reading Through the UCSM Tech-Support
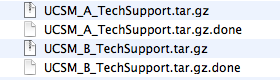
As previously stated, a tech-support can be generated for several different scopes in the system. I will start off with analyzing the UCSM tech-support file. This file contains information related to services that run on the Fabric Interconnect, and much of the same invormation you can gather from the UCSM web interface itself (i.e. - chassis/server inventory, faults, firmware/BIOS versions, etc). Upon extracting the UCSM .tar tech-support file, you will be left with a folder containing 4 files. Two of the files are .done files - this just signify that the steps involved in collecting the logs for the tech-support has completed. The other 2 files are the important ones - .tar.gz files from Fabric Interconnect A and Fabric Interconnect B.
Extracting the .tar.gz files will result in a folder from each Fabric Interconnect containing several different files and subfolders.
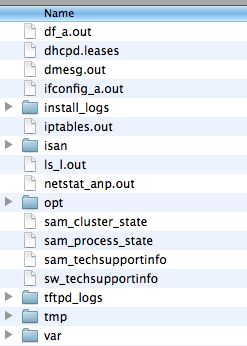
Two of the most important files in this folder are sam_techsupportinfo and sw_techsupportinfo.
sam_techsupportinfo
The sam_techsupportinfo file will only exist on the primary Fabric Interconnect. Upon opening this file, you will first be greeted with an inventory listing of the hardware in the system. Each chassis will be specified, as well as the inventory of the components and servers within the chassis and the inventory of the components within those servers. Depending on how many chassis are installed in your environment, this section could be quite long. This section is helpful for gathering part IDs/serial numbers for specific components within the system.
The following section in the tech-support file will provide details related to the IOMs within the environment. `show chassis iom detail` displays information related to each IOM in the system, including their current operational status.
Next, the tech-support file specifies a detailed inventory of each of the servers in each of the chassis. This section, beginning with `show server inventory expand` displays information related to DIMM location and operability, CPUs, mezzanine adapter(s), RAID controller, and local disks. This information, again, is very useful for verifying which hardware components are installed in the system, as well as the operability state of memory DIMMs. A bit further down in the tech-support file, you can search for `show server memory detail` this command provides even more granular detail about the DIMMs that are installed in a particular blade, including clock speed and vendor information.
`show server status detail` is the next section on the log file. This will show the current state of each server, it's managing instance, and any particular task it might be executing. The output of these commands are similar to what you would see if you navigated through the General tab of a blade in UCSM.
Two other important sections that can be analyzed in the sam_techsupportinfo file are `show event detail` and `show fault detail`. Both outputs provide a snapshot of the current state of the system, as well as a record of events from the past - the events and faults sections are extremely useful is determining when a particular issue may have started.
The remainder of the tech-support file contains further information about the confgiuration and running state of the Fabric Interconnects, as well as the different images installed and available to the system components.
In summary, the sam_techsupportinfo file can be used for several different purposes: timestamped events/faults that occurred on the system, gathering an inventory of system hardware, and viewing installed firmware versions.
sw_techsupportinfo
The sw_techsupportinfo file contains information related to the switching scope of the Fabric Interconnect. For anyone familiar with a Nexus 5K switch, this file is very similar in output.
The file starts off by containing information related to the system's uptime and NX-OS version. POST information is also displayed, containing system diagnostic results from power on.
One of the most important sections of the tech-support file from a historical standport is the output of `show logging log `. This will contain timestamped information related to different events that have occurred on the switch from the kernel loading to the time that the tech-support file was collected. Information contained in the output of the log file can be used to compare with log files from other components on the system in order to build a full picture of what was happening on the system at a particular point in time.
The sw_techsupportinfo file also contains information regarding the FEX module (or IOM), but an NX-OS perspective. It displays information relative tothe interfaces on the module, as well as the software version that is running on the FEX. `show interface brief ` and `show interface ` outputs display information and statistics about the interfaces on both the fixed and expansion modules of the Fabric Interconnect. These counters can be used to determine if there is an issue with packet level errors, or in tracking drops/CRC errors on an interface (both Ethernet and Fibre Channel interfaces are displayed, as well as uplink interfaces and virtual interfaces).
Although most of the configuration for the Fabric Interconnect is done from UCSM, the sw_techsupportinfo file also displays the running and startup configurations of the switch. Both are useful for verifiying that features are enabled and configured appropriately.
Another useful section in the file is `show account log `. This log file can be used to show who executed what commands, and at what time. This is very useful to determine if a particular activity occurred on the system before an issue came about.
The `show system reset-reason ` output can be used to diagnose why a system went offline. The last reset-reason will typically contain a short string of text explaining why the Fabric Interconnect went down, 'Reset Requested by CLI command reload', for example. This command is useful is diagnosing instances where a Fabric Interconnect went offline or rebooted on itself.
The remainder of the information in the tech-support file is related to processes running on the box, and ASIC level diagnostics. Nonetheless, much information can be gathered from the NX-OS level of the switch when trying to troubleshoot a particular issue, especially at the interface level.
sam_process_state and sam_cluster_state
The sam_process_state file is used to show the current status of processes running on the Fabric Interconnect, and equally as important, if the processes have ever generated a core file:
SERVICE NAME STATE RETRY(MAX) EXITCODE SIGNAL CORE
------------ ----- ---------- -------- ------ ----
svc_sam_controller running 0(4) 0 0 no
svc_sam_dme running 0(4) 0 0 no
svc_sam_dcosAG running 0(4) 0 0 no
svc_sam_bladeAG running 0(4) 0 0 no
svc_sam_portAG running 0(4) 0 0 no
svc_sam_statsAG running 0(4) 0 0 no
svc_sam_hostagentAG running 0(4) 0 0 no
svc_sam_nicAG running 0(4) 0 0 no
svc_sam_licenseAG running 0(4) 0 0 no
svc_sam_extvmmAG running 0(4) 0 0 no
httpd.sh running 0(4) 0 0 no
svc_sam_sessionmgrAG running 0(4) 0 0 no
svc_sam_pamProxy running 0(4) 0 0 no
sfcbd running 0(4) 0 0 no
dhcpd running 1(4) 0 15 no
sam_core_mon running 0(4) 0 0 no
svc_sam_rsdAG running 0(4) 0 0 no
The sam_cluster_state file contains information related to the HA cluster that exists between a pair of Fabric Interconnects. If all is well, the file should report that both members of the cluster are up:
Cluster Id: 0x20db42a092e311e0-0xb33a000decd2a744
Start time: Thu Jun 9 22:10:37 2011
Last election time: Mon Jun 13 20:26:36 2011
A: UP, PRIMARY
B: UP, SUBORDINATE
A: memb state UP, lead state PRIMARY, mgmt services state: UP
B: memb state UP, lead state SUBORDINATE, mgmt services state: UP
heartbeat state PRIMARY_OK
INTERNAL NETWORK INTERFACES:
eth1, UP
eth2, UP
HA READY
Detailed state of the device selected for HA storage:
Chassis, serial: FOX1334GQ8M, state: active
Chassis, serial: FOX1327G4VN, state: active
var/sysmgr/sam_logs directory
Another critical location in the UCSM tech-support .tar file for logsis in the var/sysmgr/sam_logs directory. Within this folder, you will find log files for specific services running on the Fabric Interconnect. Most all of the processes listd above from the sam_process_state file will have a log file generated for it. Depending on what type of issue you are trying to troubleshoot on the Fabric Interconnect, will determine which log file will be most useful to you. For instance, if you are trying to troubleshoot an issue with the licensing service, perhaps when trying to upload a license file, you can view the svc_sam_licenseAG.log file to see if the service is generating any errors. Likewise, the svc_sam_portAG.log file can be used to view information related to the port agent process.
Typically it is best to start by analyzing any related faults or events from the sam_techsupportinfo and then delve into a more detailed log file based on the particular issue that you are running into. The logs provide a very good indication as to what a particular service is doing, if it is throwing a fault, or generating an error.
Related Information
Procedure to Gracefully Shutdown and Powerup UCS system
What are System Event Logs in UCS manager
How to collect UCS Central tech support log bundle
- Mark as Read
- Mark as New
- Bookmark
- Permalink
- Report Inappropriate Content
Hi Jennifer ,
Thats awesome , thanks for the reply . I will try it .
Find answers to your questions by entering keywords or phrases in the Search bar above. New here? Use these resources to familiarize yourself with the community:
